Free during beta

See it. Trust it.
Trade it.

ChartMath scans the market in real time and alerts you when stocks match proven technical setups — with backtest data so you can trade with conviction.

No more missed entries No alert spam No coding required

Trading shouldn't feel this hard.

Every trader has been here. ChartMath was built to solve these problems.

Scanning hell

You've refreshed Finviz 47 times today. Still nothing. Meanwhile, NVDA broke out without you.

Missed the entry

"I literally saw that setup at 9:32." But you were in a meeting. Now it's up 8%.

Alert noise

Your phone buzzed 47 times before lunch. You checked 3. None were worth it.

"Why did this trigger?"

"AAPL triggered your alert." Cool. But why? What condition? What's the edge?

Three ways to discover your next trade

Whether you're browsing, hunting specific setups, or tracking your favorites — ChartMath adapts to how you trade.
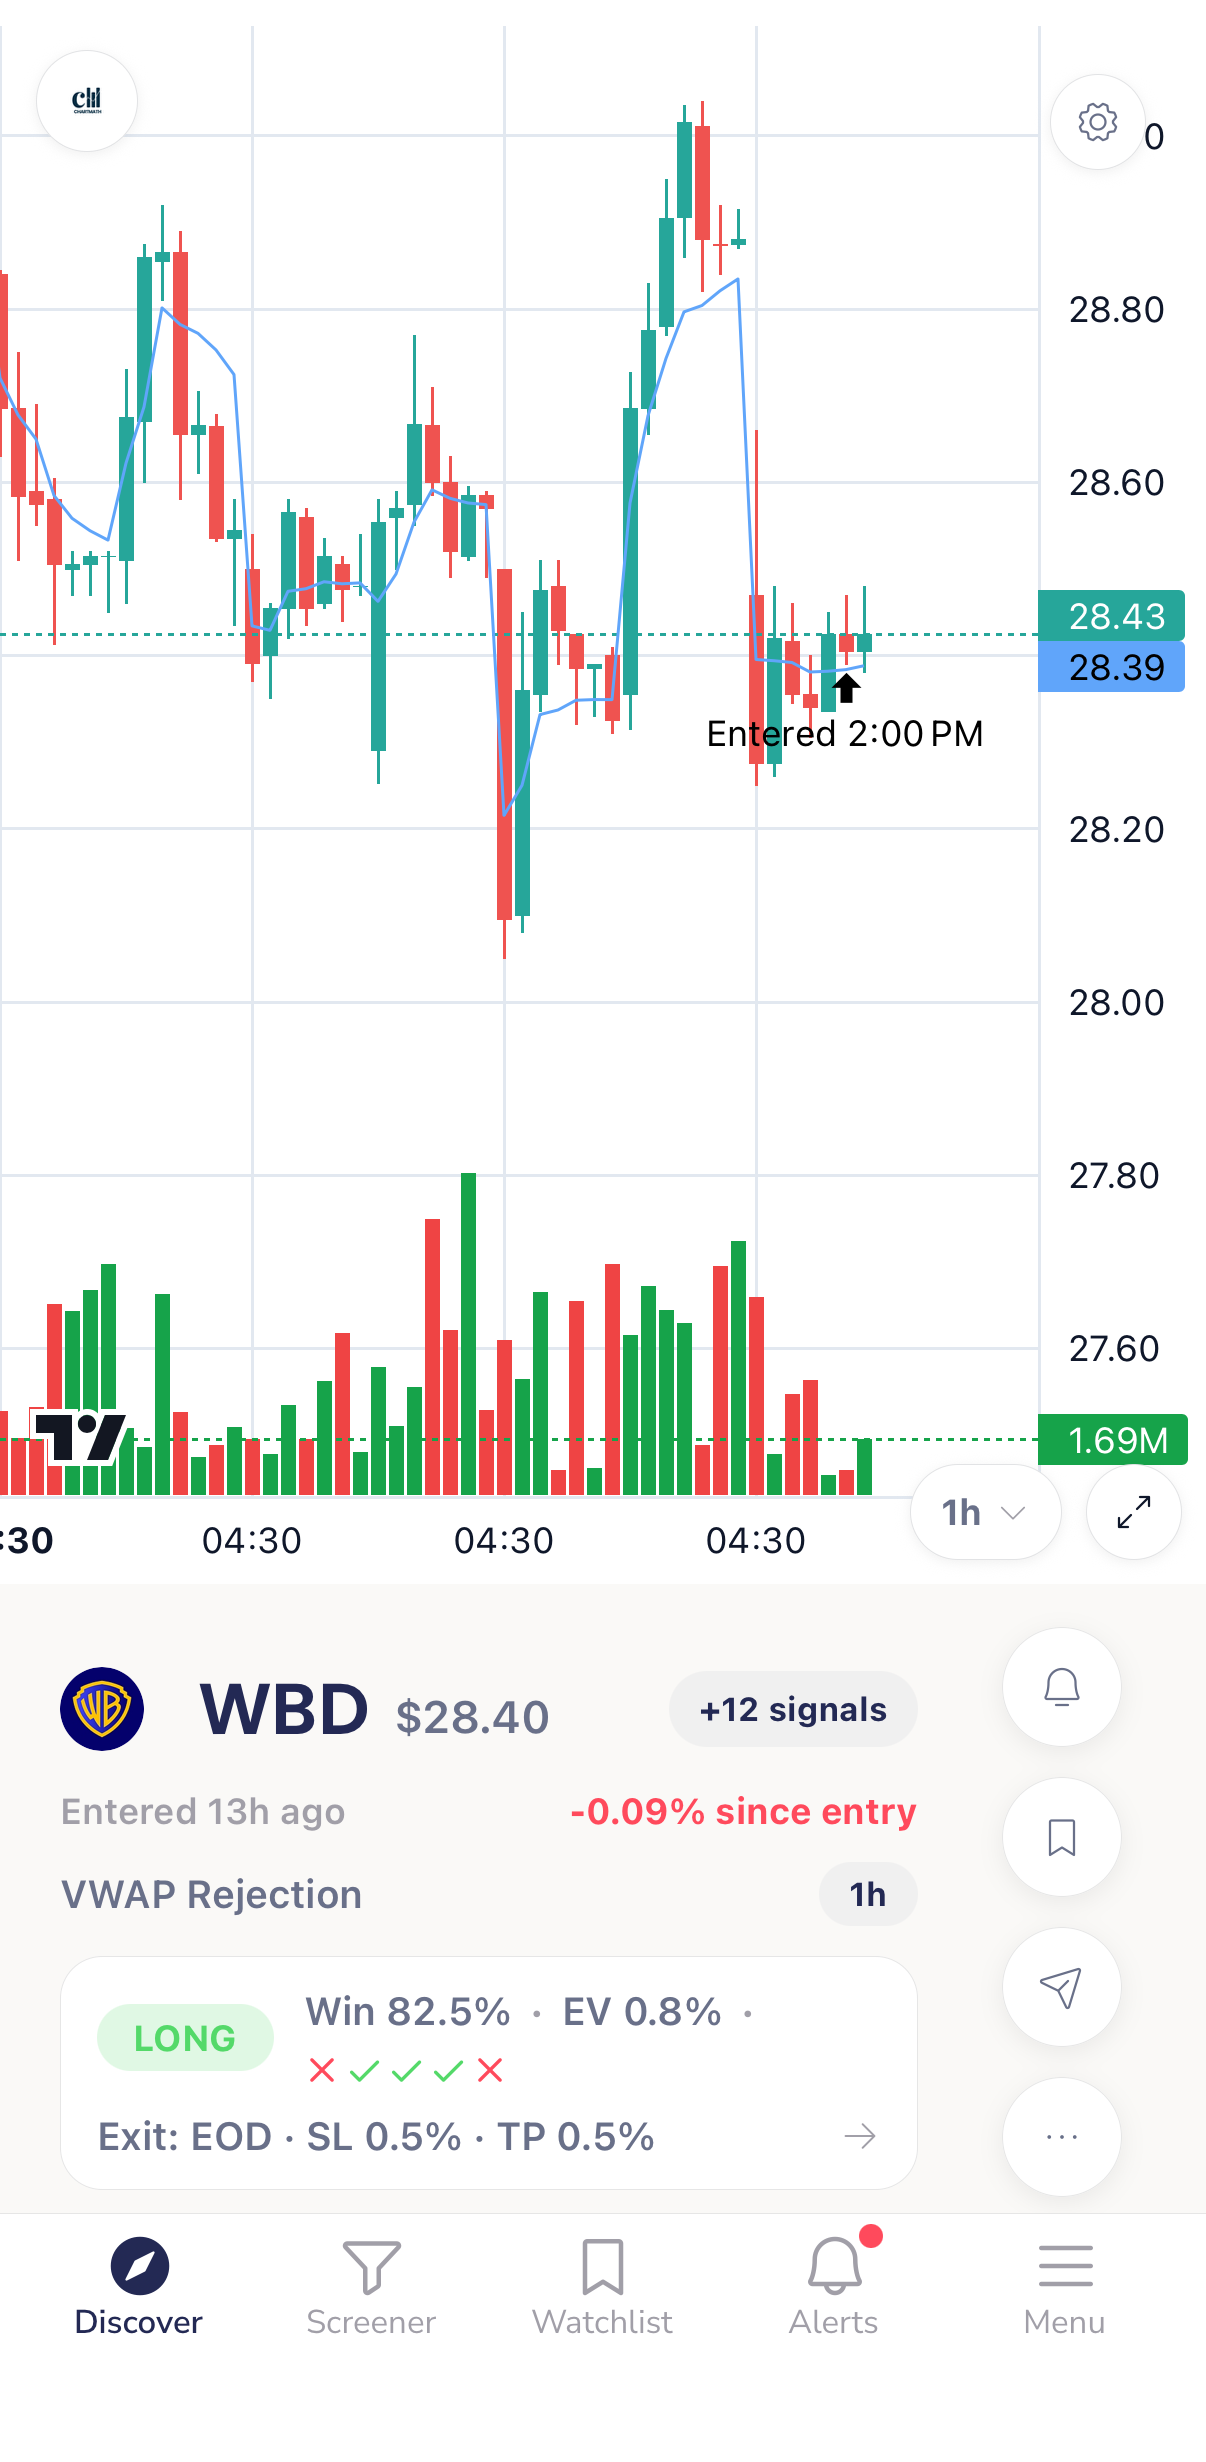
Discover tab
Discover tab

Swipe what's hot

TikTok-style feed of ranked setups. Sorted by quality and freshness — find the best opportunities happening right now in seconds.
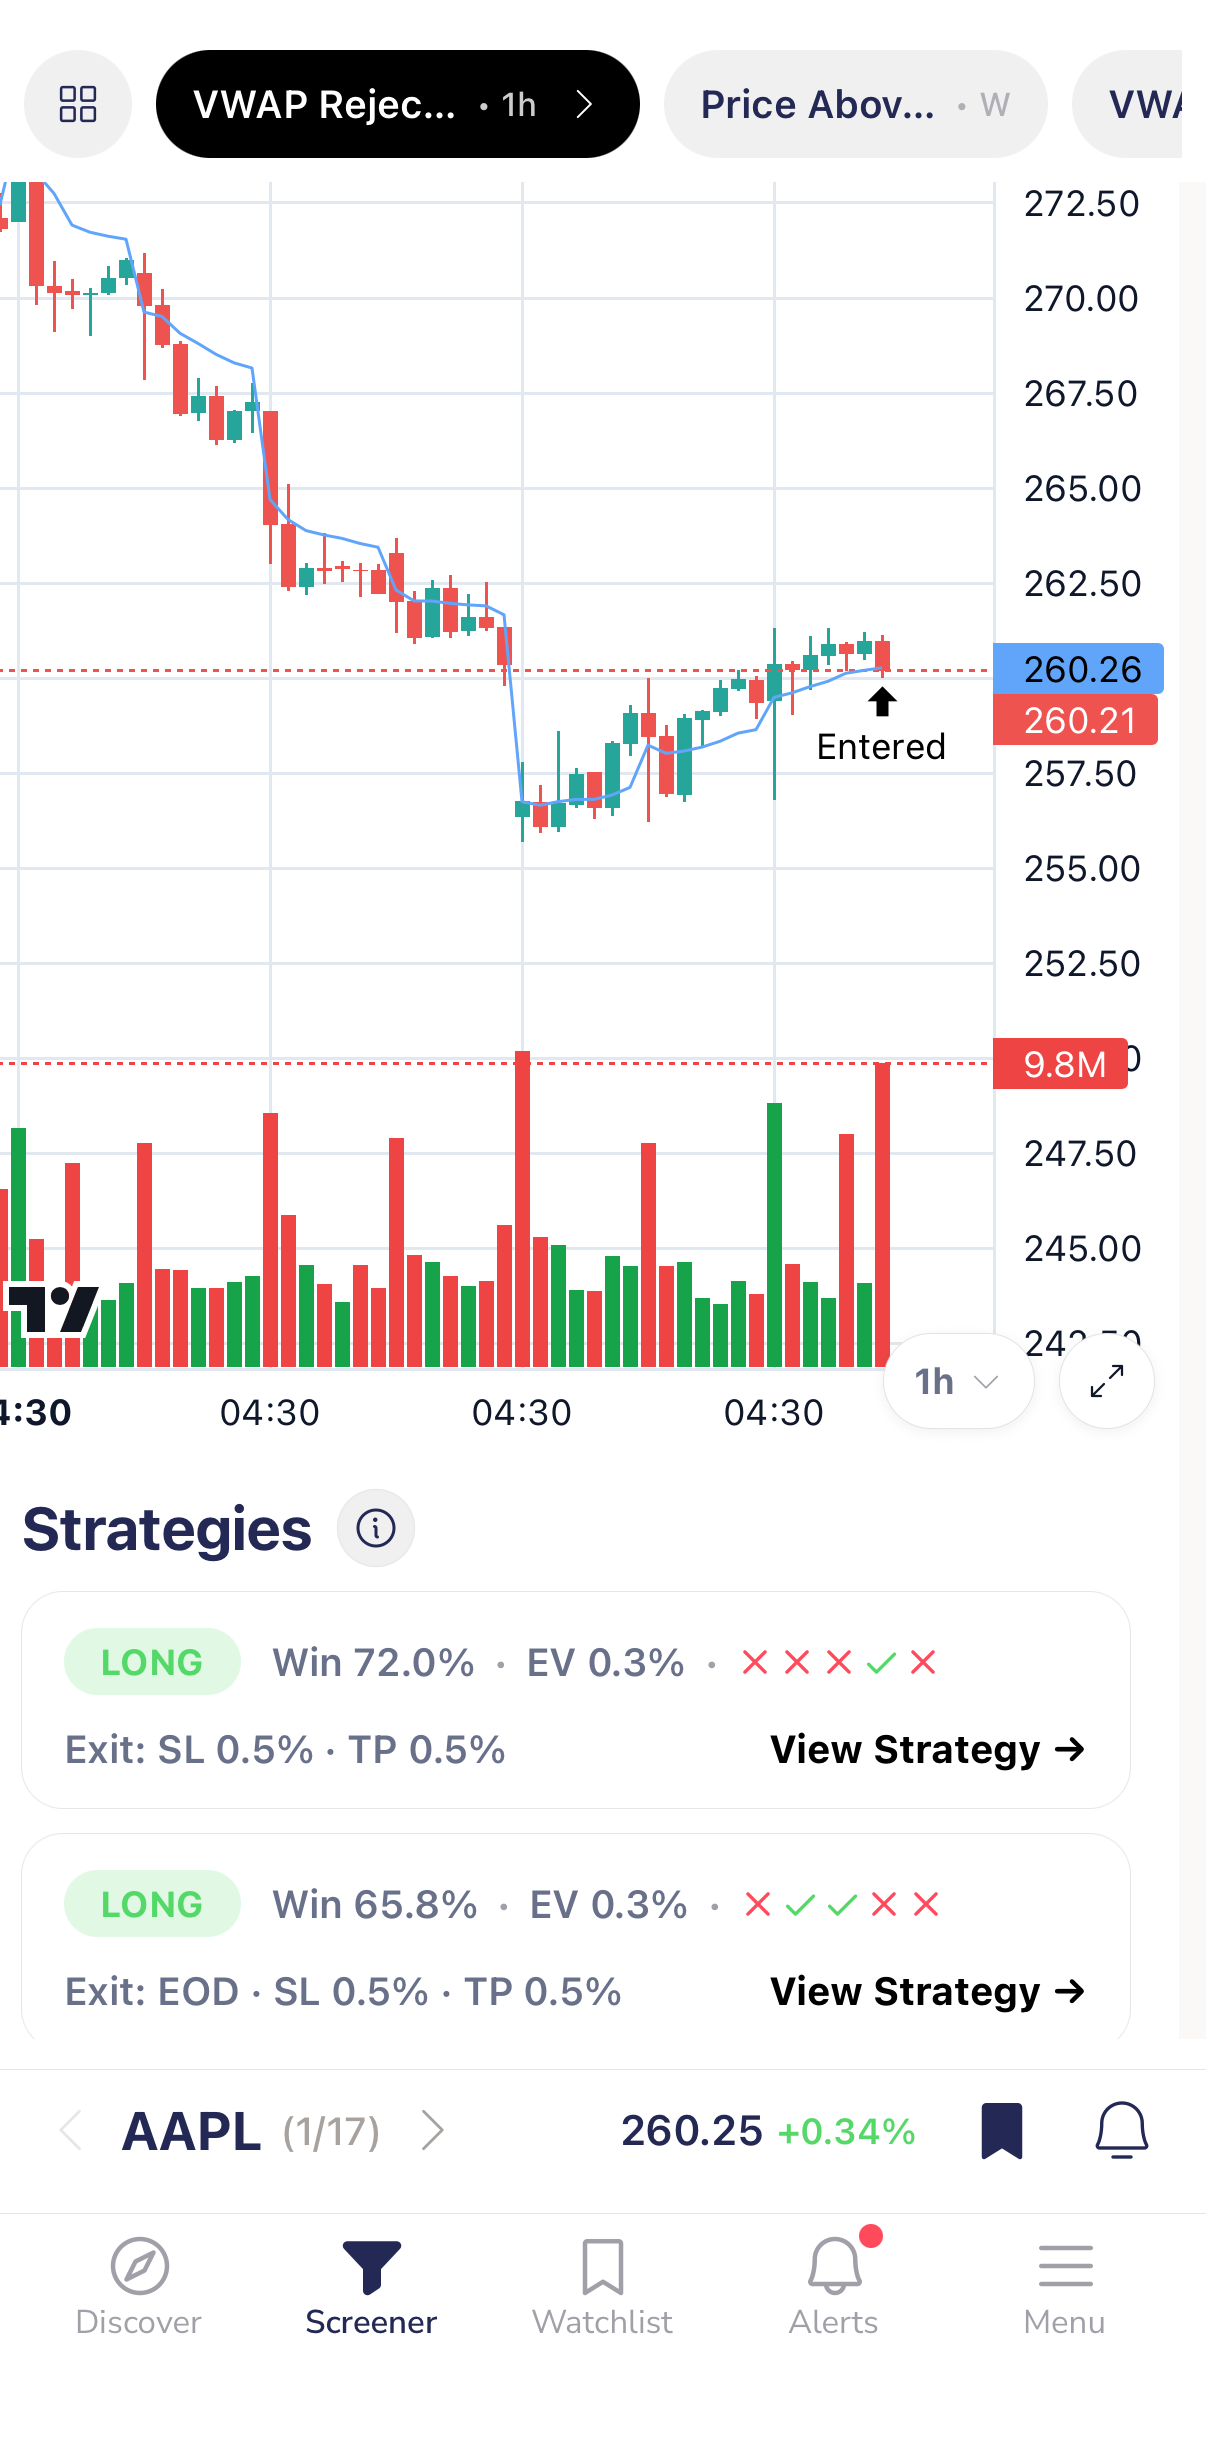
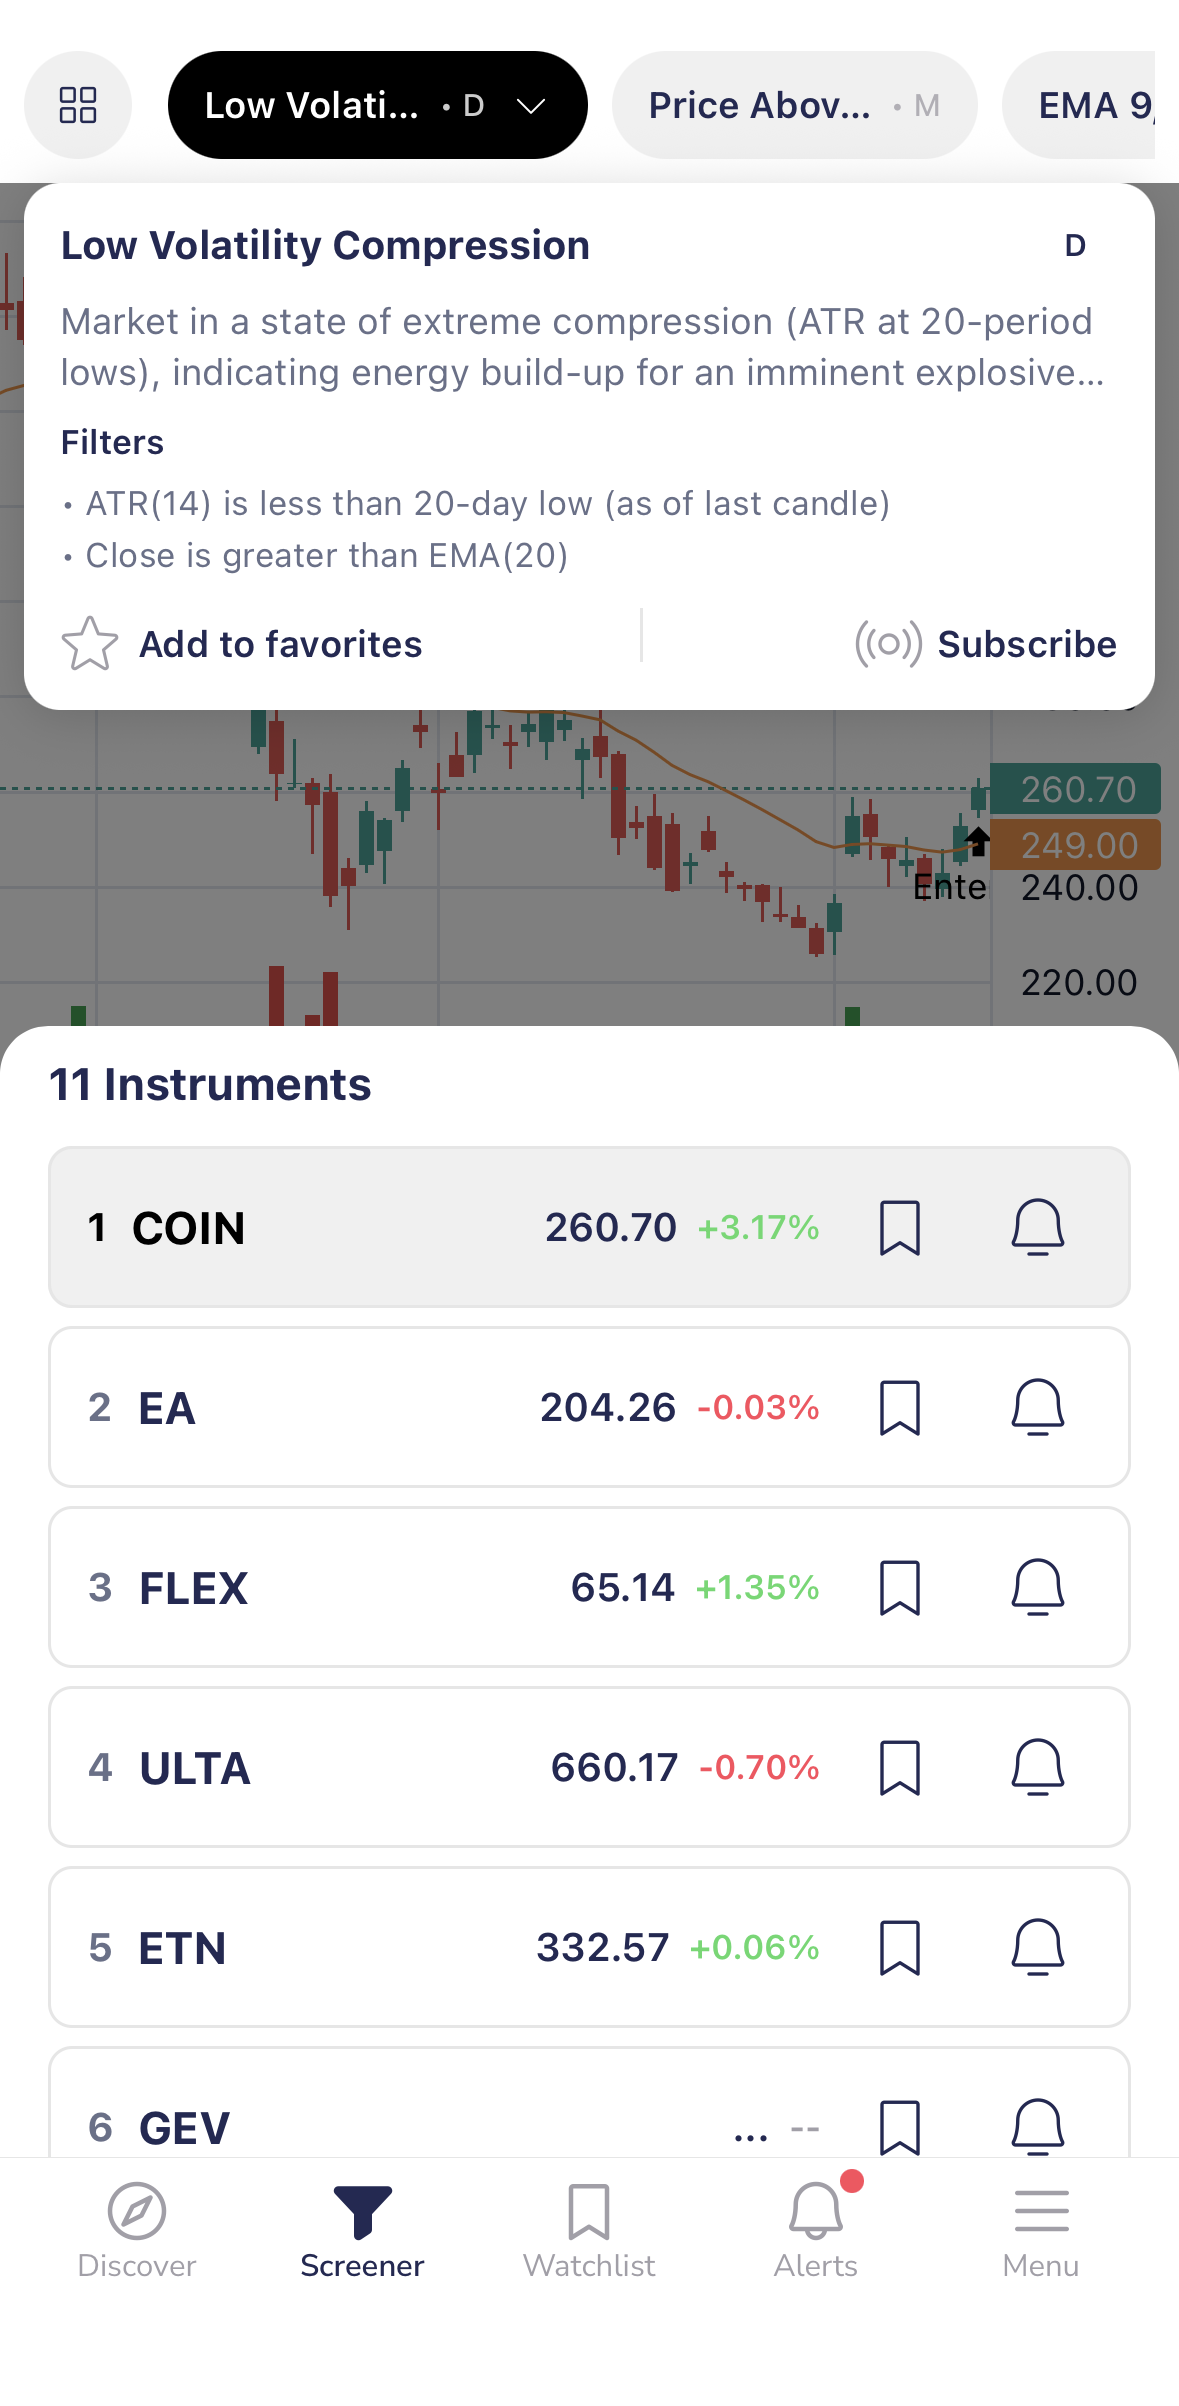
Screener tab
Screener tab

Pick your strategy

ORB? VWAP bounce? MACD crossover? Choose a screen you trust and see every stock that qualifies — live, as it happens.
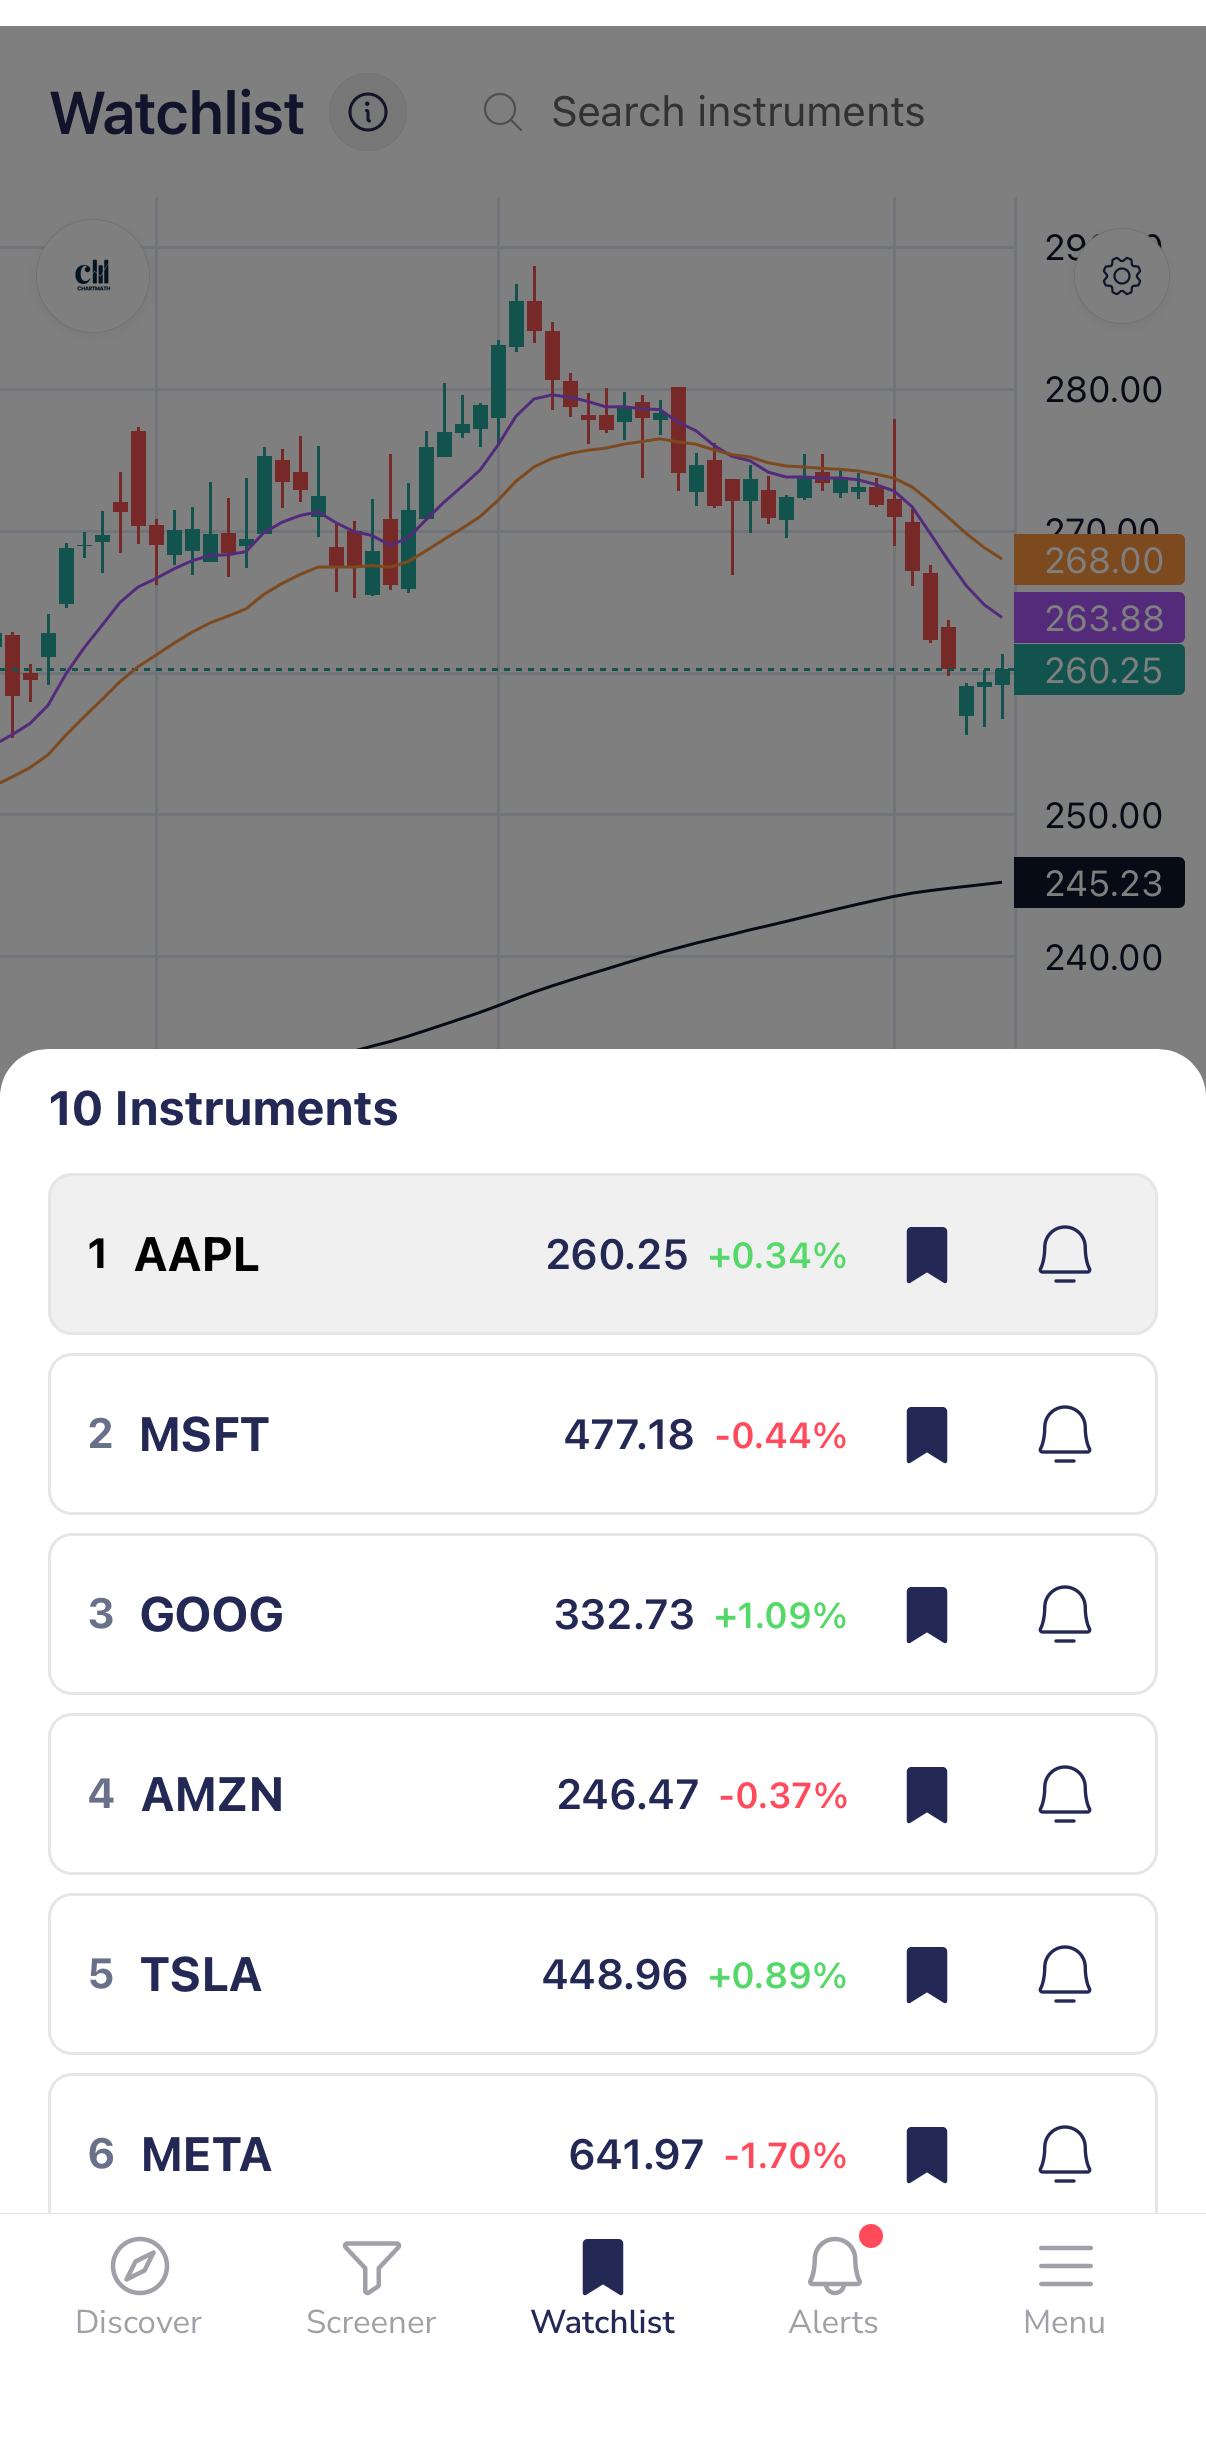
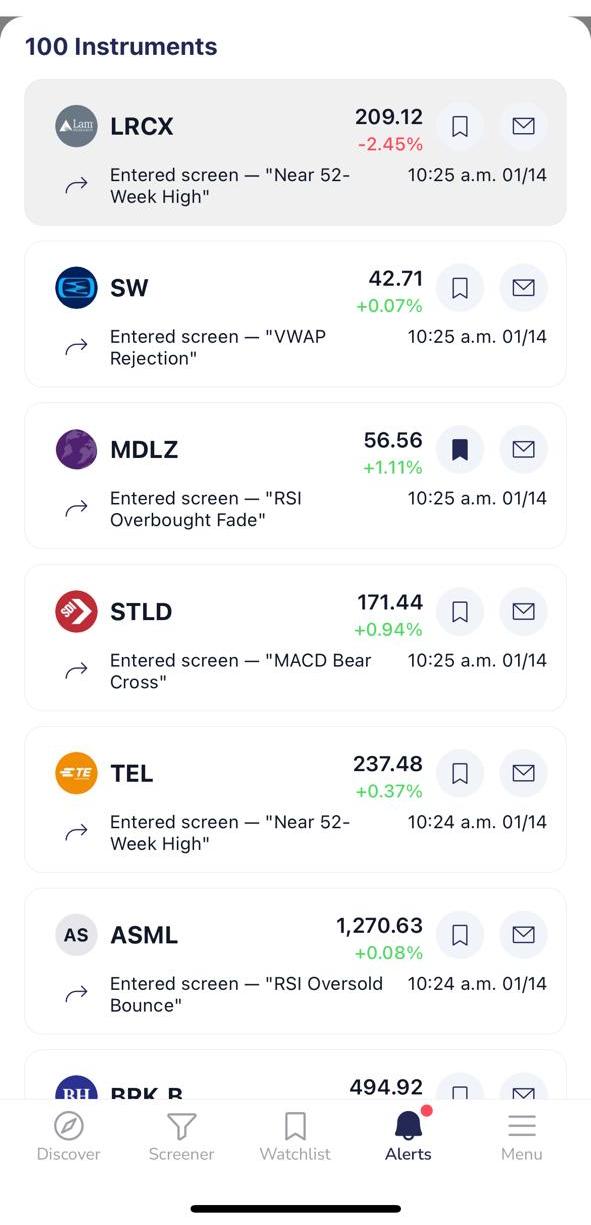
Watchlist tab
Watchlist tab

Track your stocks

Watch your favorites across 200+ screens. Get alerted the moment a setup forms on stocks you already care about.

How ChartMath works

From screen match to trading decision in three simple steps.

1

We watch 200+ screens

Our system monitors ORB, VWAP, RVOL, breakouts, momentum, and more — across top US equities, every timeframe.

2

You get right-time alerts

When a stock meets your criteria, you get a notification with a one-line explanation of why it triggered — not 100 spam alerts.

3

Decide in seconds

See the chart, the entry marker, and backtest data. Swipe through setups and decide in seconds, not hours.

200+ curated screens for every strategy

Whether you trade the open, hunt breakouts, or scan for momentum — we've got screens that match your style.

Opening Range Breakout

Catch the first major move of the day. 5m, 15m, and 30m ORB screens for intraday traders.

VWAP Plays

VWAP reclaims, rejections, and bounces. The institutional anchor that defines intraday direction.

Relative Volume

Volume spikes signal institutional interest. RVOL > 2x screens catch unusual activity early.

Breakouts & 52W Highs

Resistance breaks and new highs. Classic momentum setups for technical swing traders.

Gap Plays

Pre-market gaps up and down. Gap fills, gap-and-go, and continuation patterns.

Momentum & Trend

RSI, MACD, moving average crossovers. Ride the trend with time-tested momentum screens.

All screens run across multiple timeframes: 1m • 5m • 15m • 1h • Daily • Weekly • Monthly

Signal. Alert. Data.

Understand why setups triggered, get notified at the right time, and see the data behind every signal.

Signal explanation
Signal explained

Why was this flagged?

Every signal shows exactly which conditions were met — ORB breakout, RVOL spike, VWAP reclaim. No black boxes.

Real-time alerts
Real-time

Alerts when it matters

Get notified the moment stocks enter your screens. Set alerts on any screen — or create custom alerts on individual stocks. Never miss an entry again.

Backtest data
Data-driven

Backtest every strategy

See historical win rates, EV/trade, and drawdowns before you act. Trade with conviction, not hope.

All data shown for educational purposes only — not investment advice.

Built for serious traders

You know what you're looking for. You just can't watch everything at once. ChartMath is your force multiplier.

Day Traders

Intraday scalps & momentum plays

  • Right-time intraday alerts — catch ORB breaks, VWAP reclaims, and RVOL spikes as they happen
  • 1m, 5m, 15m timeframes — screens designed for fast-paced trading
  • Swipe to decide in seconds — see chart, entry marker, and explanation instantly

"I know the setups. I just couldn't watch everything. Now ChartMath catches what I'd miss."

Swing Traders

Multi-day moves & breakout setups

  • After-hours prep — EOD signals delivered before the close
  • Daily & weekly screens — breakouts, 52-week highs, momentum divergences
  • Check on your schedule — review setups when you have time, not when charts demand it

"I have 30 minutes a day. ChartMath shows me exactly what's worth looking at."

New to technical trading?

Every screen includes plain-English explanations. Learn why setups work as you use them. No coding or Pine Script required.

How ChartMath compares

We're not replacing your charting platform. We're the mobile companion that tells you when to look.

Feature ChartMath TradingView Finviz Trade Ideas
Mobile-first swipe interface
Real-time screen evaluation Alerts only EOD
200+ curated screens (no coding) Pine Script
Backtest data on every signal Pro only Limited
Free tier available $118+/mo
Three discovery modes (swipe/screen/watchlist)
Beta Access

$0

Free during beta

  • Right-time alerts with explanations
  • 200+ curated screens
  • Backtest data on every signal
  • US equities coverage
Get Early Access

No credit card required

Questions? See our FAQ

See it. Trust it. Trade it.

Join 500+ traders discovering setups in real time.