You finished Essay 1. You're back at the AAPL chart and it still looks like a winner. Essay 1 told you why that feeling lies: five trades aren't evidence, and on a casino floor it's the house that gets paid, not the gambler. But knowing that doesn't tell you what to do differently the next time you open a chart.
What to do differently has a name: trade systematically. Being systematic is the unglamorous secret behind people who make money from markets repeatedly instead of once. They run the same checkable rules every time, so the math from Essay 1 actually has room to play out. This essay teaches you to be systematic using four numbers. If you can't name all four for a trade, you don't have a trade. You have a tip.
The idea isn't new. In The Checklist Manifesto, the surgeon Atul Gawande tells the story of a hospital fighting deadly infections in its ICU. The Checklist Manifesto1. Gawande is the writer who told this story; the checklist itself was built by Peter Pronovost, a critical-care doctor at Johns Hopkins. His five-step list cut central-line infection rates from 11% to near zero in a year. The fix wasn't new knowledge; it was forcing steps everyone already knew to happen in order, every time. Doctors were infecting patients in 11% of procedures. A doctor there wrote down five basic steps the whole team already knew and made them tick the boxes in order, every time. Infections fell to almost zero within a year. Same doctors, same knowledge. The only new thing was the checklist.
Trading is the same shape. You already know good trades have stops, and that position size should follow your risk. The fix isn't more knowledge. It's a checklist: four numbers, named in order, before you click.
Number 1: Entry, the condition that triggers the trade.
The first number isn't a number. It's a sentence. A sentence that describes a price-action condition specific enough that two different people looking at the same chart would agree on whether the condition is true.
“AAPL looks good” is not an entry rule. Two people can't agree on what “looks good” means. “AAPL made a higher low above the 50-day EMA and printed a bullish engulfing candle on the daily, with volume above its 20-day average” is an entry rule.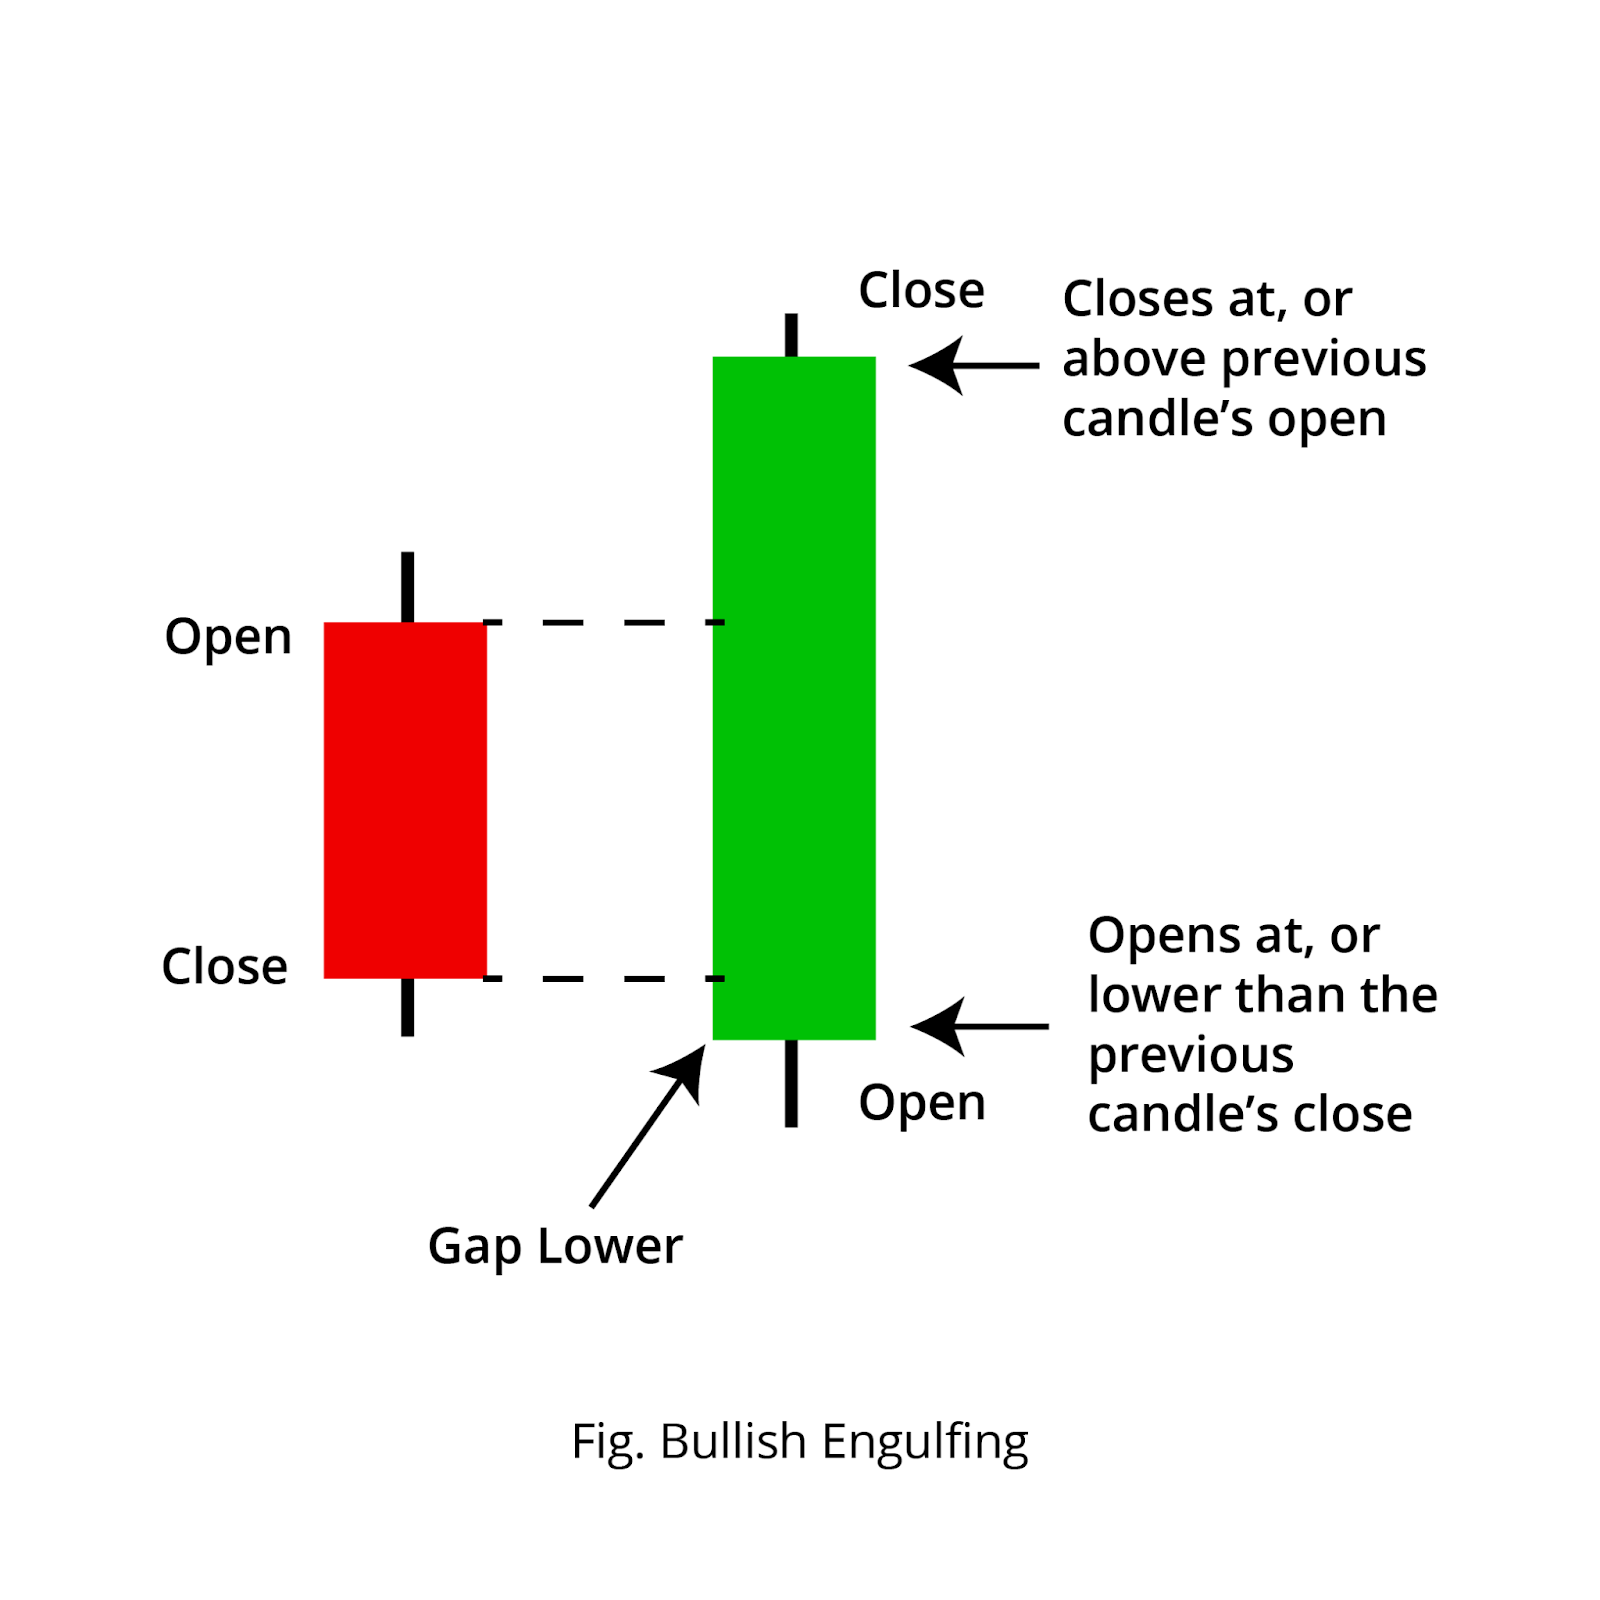 2. New to these terms? A higher low is a pullback that bottoms out above the previous dip, so the uptrend is still intact. The 50-day EMA is the average closing price over the last 50 days, weighted toward recent days, used as a trend line. A bullish engulfing candle is a green day whose range fully covers the prior red day, often read as a reversal. A consolidation is a quiet sideways range before a move. You don't have to trade these exact patterns; they're just an example of a rule precise enough to check.You can either look at the chart and check the four conditions, or you can't.
The reason this matters is that checkable is the precondition for countable. If you can't check whether the rule was true, you can't count how many times it's been true historically, which means you can't know the next three numbers either. Every screen on ChartMath is one of these sentences, translated into code so it can be checked across thousands of historical bars without your involvement. That's the whole purpose of a screen.
Number 2: Stop, where you're wrong.
The stop is two numbers wearing a trench coat. It's a price (the level at which you'll exit) and a percentage (how much of your account you lose if you're wrong). The first number is technical; the second is account-level. You need both.
The first stop level is structural. It lives in the chart. For a bullish engulfing setup, the structural stop is usually below the engulfing candle's low. For a breakout, it's usually below the consolidation. The structural stop is the answer to the question: at what price does my thesis stop being true?
The percentage is what most retail traders skip. The percentage decides position size. If your stop is 2% below your entry, and you want to risk 1% of your account on this trade, your position size has to be 0.5 of your account. Scrub either number: widen the stop and the same risk budget buys a smaller position. The stop is what tells you how many shares to buy. Not your conviction. Not the chart pattern. The stop.
Your size comes from your stop, not your conviction. The same risk allows a smaller position the further the stop sits from your entry.
This is the calculator that should run in the back of your head every time. The 1% number is conservative; many systematic traders use 0.25% or 0.5%. The point is that the number is fixed for the trade before you click. It doesn't get bumped up because the setup feels especially clean. The system has already decided.
Number 3: R-expectation, the long-run average R of trades like this.
R is the unit of trading. 1R is what you risked on the trade. If your stop is 2% below entry and you took the trade with 1% of your account at risk, a trade that hits the stop is -1R (you lost what you risked) and a trade that runs to 3% above entry is +1.5R. The R-multiple is the only honest way to compare a 1m scalp to a swing trade, because it normalizes for the size of the bet.
The R-expectation of a system is the average R per trade across a large sample.3. Expectancy = (win rate × avg win R) − (loss rate × avg loss R). A 60% win-rate system with 1.5R average win and 1R average loss has expectancy of (0.6 × 1.5) − (0.4 × 1) = +0.50R per trade. A 90% win-rate system with 0.2R average win and 1R average loss has expectancy of (0.9 × 0.2) − (0.1 × 1) = +0.08R per trade. The second one feels better; the first one compounds 6x faster. A +0.5R system nets, on average, half of what you risked on every trade. Stack enough of those and the account climbs.
A high win rate is not a high expectancy. The system with the higher win rate isn't always the system that compounds.
That is the central confusion in retail. “80% win rate” is the most compelling lie on Twitter, because it's usually paired with tiny R wins and full-size R losses. The math underneath is brutal. The Expectancy Lab is what lets you see this directly.
The system with the higher win rate isn't always the one that compounds. Watch what changes when you trade win rate for R.
Run the three presets. The tip-bot looks elite. 80% wins, who wouldn't want that, and yet the expectancy is negative. The lottery ticket looks awful, losing more than 80% of the time, and it still compounds. The boring +0.5R system in the middle is what every real edge looks like. None of them feel good. All of them are math.
Number 4: Sample size, what backs the R-expectation.
The fourth number is the one Essay 1 was building toward. A system with +0.8R expectancy backed by 12 historical trades is a hypothesis. A system with +0.4R expectancy backed by 1,200 historical trades is a business. The first one has higher expected return per trade and you should still prefer the second one, because the second one is actually +0.4R and the first one might be anything.
The number you want to see on a screen is somewhere in the hundreds. A few dozen is a hint. Four-digit sample sizes are where you start treating the R-expectation as a forecast instead of a wish.
Putting the four together.
A trade with all four numbers reads like: “Bullish engulfing daily, stop below engulfing low at $182.40, R-expectation +0.7R per trade, 412 historical instances.” That's a system you can run. That's a trade you can take mechanically. That's a trade whose loss won't shake you, because the loss was priced into the expectancy you signed up for.
A trade without the four numbers reads like: “AAPL looks like a winner.” You already know what that is.
“AAPL looks ready to rip. My buddy’s called two of these right this month.”
System or tip? Run all four numbers. Three of four still leaves you with a tip.
Before you click buy
Can't tick one? You don't have a trade. You have a tip.