15 Proven Technical Setups Every Day Trader Should Know

You've got your charting platform open, coffee in hand, and the market's about to ring the bell. But here's the problem: there are thousands of stocks moving right now, and you have no idea which ones are setting up for high-probability trades. You could spend hours scanning charts manually, or you could learn to recognize the technical setups that professional traders use to identify opportunities in seconds.
Technical setups are specific, repeatable price patterns backed by historical data that signal potential trading opportunities. Unlike random chart watching, these setups have been backtested across thousands of trades to show actual win rates, expected value, and risk parameters. In this comprehensive guide, we'll walk through 15 proven technical setups that day traders and swing traders rely on daily, complete with entry criteria, exit strategies, and real backtest data to help you decide which patterns align with your trading style.
Whether you're executing quick scalps on 5-minute charts or holding swing positions for days, understanding these technical setups will transform how you approach the market. Let's dive into the patterns that separate profitable traders from those still guessing.
Why Technical Setups Matter More Than Ever in 2026
The trading landscape has evolved dramatically. What worked in 2020 doesn't necessarily work today, and the sheer volume of market data available can be overwhelming. This is exactly why technical setups have become more critical than ever. They provide a structured framework for decision-making in an environment where information overload is the norm.
Here's the reality: most traders fail not because they lack intelligence or dedication, but because they trade without a proven edge. They chase momentum without understanding the underlying pattern, or they exit winners too early because they don't know the historical profit targets for that specific setup. Technical setups solve this problem by giving you a playbook of patterns that have demonstrated statistical edges over time.
Modern backtesting technology has made it possible to validate these patterns across decades of market data. We're no longer relying on anecdotal evidence or gut feelings. When you trade an Opening Range Breakout (ORB) or a VWAP reclaim, you can know the historical win rate, average return per trade, and maximum drawdown. This data-driven approach transforms trading from gambling into a calculated risk management exercise.
But here's the challenge: even if you know these 15 technical setups by heart, manually scanning thousands of stocks across multiple timeframes is virtually impossible. You'd need to refresh screeners constantly, watch dozens of charts simultaneously, and somehow avoid missing the exact moment a setup triggers. This is where modern scanning technology becomes essential, but we'll get to that later. First, let's explore the setups themselves.
1. Opening Range Breakout (ORB)
The Opening Range Breakout is one of the most popular technical setups among day traders, and for good reason. The concept is simple: measure the high and low of the first X minutes of trading (typically 5, 15, or 30 minutes), then enter a trade when price breaks above or below that range with conviction.
The logic behind ORB setups is that the opening range represents an equilibrium zone where early buyers and sellers establish initial positions. When price breaks this range with strong volume, it often signals that one side has gained control and momentum is building in that direction. Professional traders and institutions often wait for the opening volatility to settle before making their moves, which is why ORB breaks can lead to sustained directional moves.
Entry Criteria: Wait for a candle to close above the opening range high (for long positions) or below the opening range low (for short positions). Volume should be at least 1.5x the average volume of the opening range period. Many traders also look for the break to occur on a strong momentum candle rather than a slow grind.
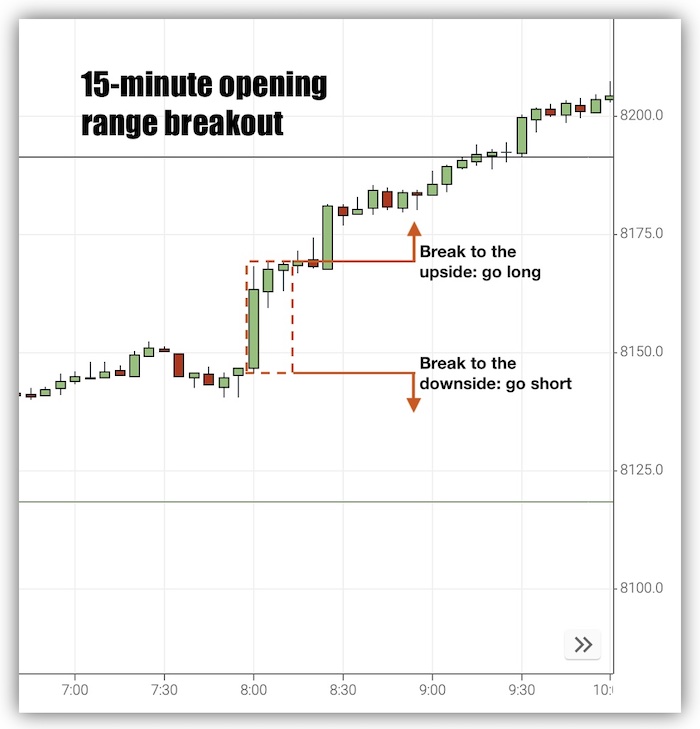
Exit Strategy: Profit targets are typically set at 1.5x to 2x the size of the opening range. For example, if the 15-minute opening range is $1.00 wide, your target would be $1.50 to $2.00 from your entry. Stop-loss is placed just inside the opening range, usually 10-20 cents depending on the stock's average true range.
Backtest Data: Historical analysis of ORB setups shows win rates ranging from 55% to 65% depending on market conditions and timeframe selection. The 15-minute ORB tends to perform better than the 5-minute version because it filters out more false breakouts. Expected value per trade averages 0.8R to 1.2R (where R is your risk amount), making it a solid foundation for any day trading strategy.
The best market conditions for ORB setups are trending days with clear directional bias and stocks that have catalysts (earnings, news, sector rotation). Avoid trading ORB on low-volume stocks or during choppy, range-bound market conditions where false breakouts are common.
2. VWAP Touch and Reclaim
The Volume Weighted Average Price (VWAP) is arguably the most important intraday indicator for institutional traders, which makes VWAP-based technical setups incredibly reliable. VWAP represents the average price weighted by volume throughout the trading day, and it acts as a dynamic support and resistance level that institutions use to benchmark their execution quality.
When a stock pulls back to touch VWAP and then bounces with volume, it signals that buyers are stepping in at what they perceive as fair value. This creates a high-probability long entry. Conversely, when a stock rallies to VWAP from below and gets rejected, it can signal a short opportunity.
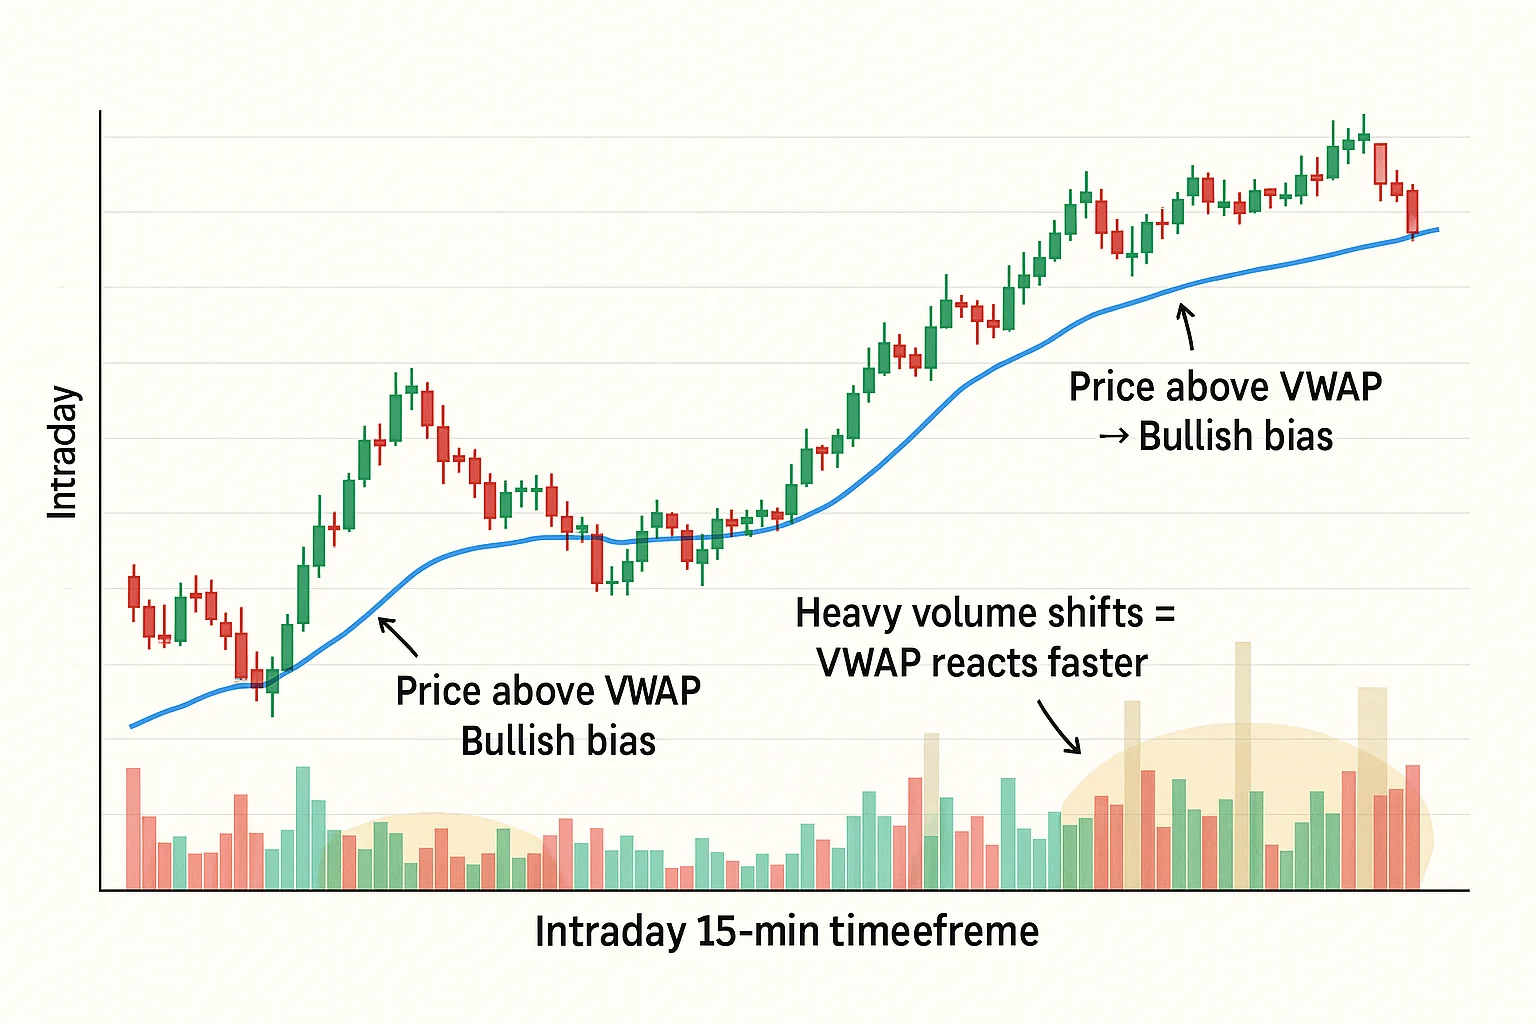
Entry Criteria: Look for price to touch or slightly penetrate VWAP, then watch for a reversal candle (bullish engulfing, hammer, or strong close near the high) with volume at least 1.3x the recent average. The best VWAP touches occur after a strong initial move away from VWAP, creating a clear "first pullback" scenario.
Exit Strategy: For VWAP reclaim longs, initial targets are the previous swing high or a 1:2 risk-reward ratio. Stop-loss is placed below the VWAP touch low, typically 15-30 cents depending on volatility. Many traders scale out of positions, taking partial profits at 1:1 and letting the remainder run to 1:2 or higher.
Backtest Performance: VWAP touch setups show win rates of 60-70% in trending market conditions, with average returns of 1.5R per trade. The key is filtering for quality setups—not every VWAP touch is created equal. The best performers occur on stocks with relative volume above 2.0 and clear intraday trends.
Combining VWAP with other technical indicators like RSI or MACD can improve your edge. For example, a VWAP touch that coincides with RSI bouncing off 40 (in an uptrend) provides multiple layers of confirmation. This is exactly the type of multi-factor analysis that separates professional traders from amateurs.
3. Relative Volume (RVOL) Spike
Relative Volume measures current volume compared to the average volume at that same time of day. When RVOL spikes above 2.0 or 3.0, it indicates unusual activity that often precedes significant price movement. This makes RVOL spike one of the most powerful technical setups for catching momentum plays early.
The beauty of RVOL is that it's a leading indicator rather than a lagging one. While moving averages and MACD tell you what already happened, RVOL tells you something is happening right now. Institutional buying, breaking news, or sector rotation often shows up in volume before it shows up in price.
Entry Threshold: Look for RVOL above 2.0 combined with price movement in a clear direction. The best setups occur when RVOL spikes and price breaks a key technical level (previous day high, resistance, or opening range). Volume without price movement is just noise; you need both elements aligned.
Filtering False Signals: Not all RVOL spikes are created equal. News-driven spikes can be traps if you enter too late. The key is to distinguish between sustainable momentum and temporary volatility. Check if there's a fundamental catalyst (earnings, FDA approval, sector news) and whether the price action is orderly or chaotic. Orderly trends with increasing RVOL are tradeable; parabolic spikes often lead to sharp reversals.
Historical Win Rates: RVOL-based entries show win rates of 58-68% when combined with proper price action confirmation. Average returns range from 1.0R to 2.5R depending on how early you catch the move. The highest expected value comes from entering on the first or second RVOL spike of the day, not the fifth or sixth when the move is exhausted.
Best timeframes for RVOL trading are 5-minute and 15-minute charts for day traders, and daily charts for swing traders looking for multi-day momentum plays. Combining RVOL with other technical setups like ORB or VWAP reclaim creates powerful confluence zones with even higher win rates.
4. Bull Flag Continuation Pattern
The bull flag is a classic continuation pattern that occurs after a strong upward move (the flagpole) followed by a tight consolidation period (the flag). This setup represents a pause in momentum where early buyers take profits and new buyers accumulate positions before the next leg higher.
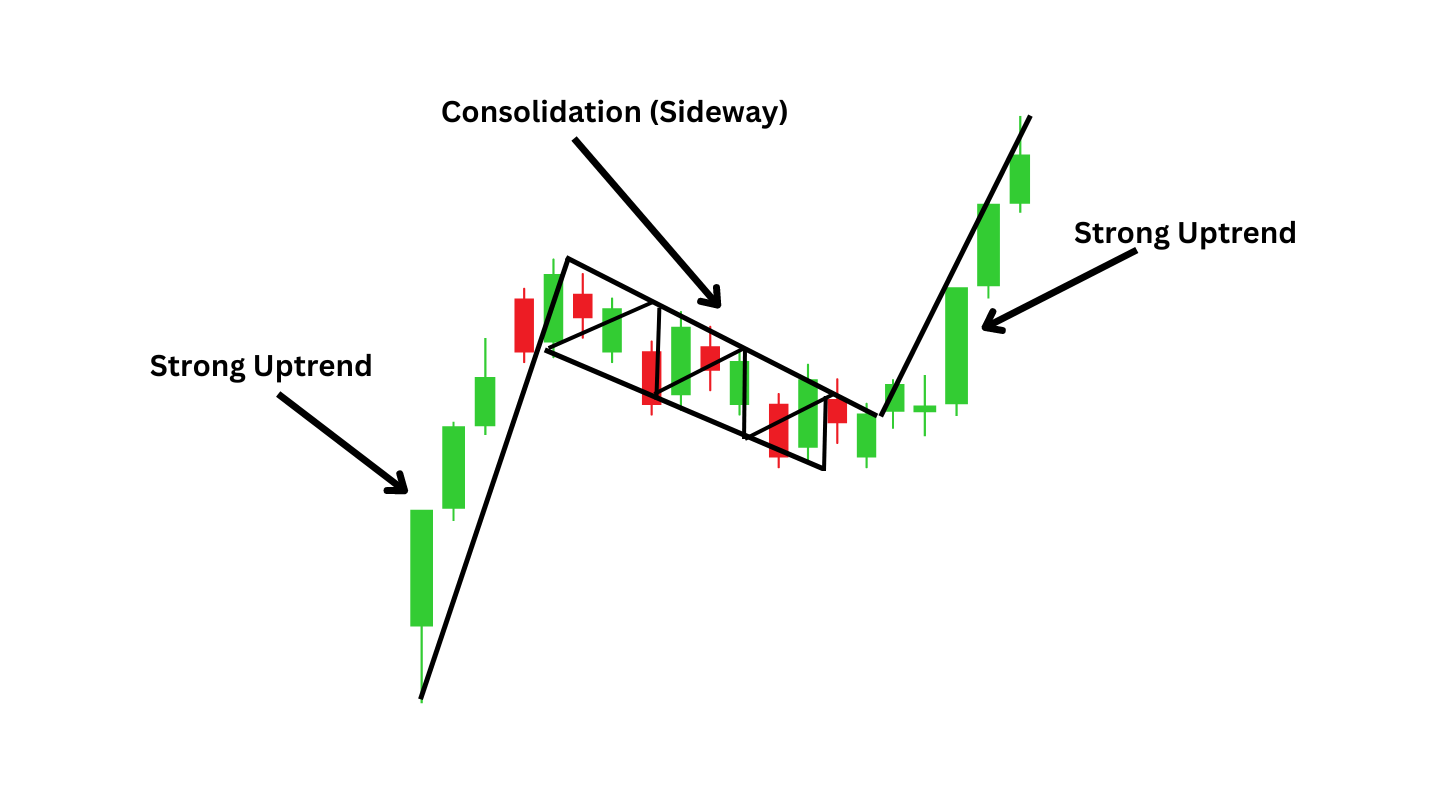
Bull flags work because they represent healthy profit-taking in the context of a strong trend. The consolidation phase allows the stock to "digest" gains without giving back significant ground, which indicates underlying strength. When the flag breaks to the upside, it often triggers stops from shorts and attracts momentum buyers, creating a powerful continuation move.
Entry Trigger: Enter when price breaks above the upper trendline of the flag consolidation with a strong candle close. The breakout should occur on volume at least 1.5x the average volume during the flag formation. Many traders wait for a 5-minute or 15-minute candle to close above the flag high to avoid false breakouts.
Volume Confirmation: This is critical. A flag breakout on weak volume is likely to fail. You want to see volume expanding as price breaks the flag, ideally reaching or exceeding the volume seen during the initial flagpole formation. This confirms that new buyers are entering aggressively.
Profit Targets: The measured move for a bull flag is the height of the flagpole added to the breakout point. If the flagpole was a $2.00 move and the flag breaks at $25.00, your target is $27.00. Conservative traders take profits at 75% of the measured move, while aggressive traders hold for the full target or beyond.
Backtest Data: Bull flag setups show win rates of 62-72% across various market conditions, with higher success rates in strong trending markets. Average returns range from 1.5R to 3.0R, making this one of the highest expected value technical setups when properly identified. The key is patience—waiting for the flag to fully form rather than jumping in during the consolidation.
5. Ascending Triangle Breakout
The ascending triangle is a bullish continuation pattern characterized by a flat resistance level and rising support. This pattern shows that buyers are becoming more aggressive with each pullback, willing to pay higher prices, while sellers remain anchored at a specific resistance level. Eventually, buying pressure overwhelms the sellers and the stock breaks out.
Pattern Structure: Look for at least two touches of the flat resistance level and two higher lows forming the ascending support line. The pattern typically takes 2-6 weeks to form on daily charts, or several hours to days on intraday charts. The longer the pattern takes to develop, the more significant the breakout tends to be.
Entry Criteria: Enter when price closes above the resistance level with volume at least 1.5x the 20-day average. Some traders prefer to wait for a retest of the breakout level as support before entering, which reduces false breakouts but may cause you to miss some moves. The aggressive approach is to enter on the breakout candle; the conservative approach is to wait for the pullback.
Stop-Loss Placement: Place your stop below the most recent swing low within the triangle, or below the ascending support line. This typically represents a 2-5% risk depending on the stock's volatility. Never place stops at obvious round numbers where other traders' stops are clustered.
Expected Move Calculation: Measure the widest part of the triangle (from the first touch of resistance down to the corresponding support level) and add that distance to the breakout point. This gives you a statistical price target based on the pattern's structure.
Historical Performance: Ascending triangle breakouts show win rates of 65-75% in bull markets and 55-65% in neutral markets. They tend to underperform in bear markets when overhead resistance is more difficult to overcome. Average returns range from 1.8R to 3.5R, with the best performers occurring on stocks with strong relative strength and sector tailwinds.
6. Gap and Go Setup
The gap and go is a momentum-based technical setup that capitalizes on stocks gapping up significantly in pre-market trading and continuing that momentum into the regular session. This pattern is particularly popular among day traders because it provides clear entry and exit parameters with defined risk.
Gaps occur when significant news or events create an imbalance between buyers and sellers overnight. Earnings beats, FDA approvals, analyst upgrades, or sector-wide news can all trigger gaps. The key question is whether the gap will hold and continue, or fade back to fill the gap. The gap and go setup focuses on continuation scenarios.
Pre-Market Gap Requirements: Look for gaps of at least 5% on stocks priced above $5 with average daily volume above 500,000 shares. Smaller gaps often lack the momentum to sustain continuation, while gaps on low-volume stocks can be manipulated or illiquid. The sweet spot is 5-15% gaps on liquid stocks with clear catalysts.
Entry Timing: The first 5-15 minutes of the market open are critical. Watch for the stock to establish a base or consolidation pattern in the first few minutes, then enter when it breaks above the opening range high. This confirms that buyers are in control and the gap is likely to hold. Avoid chasing parabolic moves in the first minute—let the setup come to you.
Volume and Momentum Confirmation: Volume should remain elevated throughout the move, ideally staying above 2x average. Price action should show higher highs and higher lows, not erratic whipsaws. The best gap and go setups have orderly, stair-stepping price action rather than vertical spikes.
Exit Strategies: This is where gap and go gets interesting. You need to distinguish between gap continuation and gap fade scenarios. For continuations, use trailing stops or take profits at key resistance levels (previous day high, psychological round numbers). For fades, exit quickly if the stock breaks below the opening range low or VWAP. Many traders use a time stop, exiting by 10:30-11:00 AM when the opening momentum typically fades.
Backtest Win Rates: Gap and go setups show win rates of 55-65% depending on gap size and market conditions. Larger gaps (10%+) have higher win rates but also higher volatility. Expected value ranges from 1.2R to 2.5R per trade. The key is filtering for quality—only trade gaps with clear catalysts and strong pre-market volume.
7. Moving Average Crossover
Moving average crossovers are among the most widely used technical setups in trading, and while they're often criticized as lagging indicators, they remain effective when used correctly. The concept is straightforward: when a faster moving average crosses above a slower moving average, it signals upward momentum; when it crosses below, it signals downward momentum.
Popular MA Combinations: The most common pairings are the 9/21 EMA for short-term trading, 20/50 SMA for swing trading, and the famous 50/200 SMA "golden cross" for longer-term trend identification. Day traders often use the 9/21 on 5-minute or 15-minute charts, while swing traders focus on daily chart crossovers.
Entry on Crossover: Don't just blindly enter when the lines cross. Wait for price confirmation—ideally a strong candle close in the direction of the crossover with volume above average. The best crossovers occur when price is already trending and the crossover confirms the momentum, not when price is chopping sideways.
Lagging Indicator Challenges: The main criticism of moving average crossovers is that they lag price action, causing you to enter late and give back profits during whipsaws. The solution is to combine crossovers with leading indicators like RVOL or RSI, or to use them as confirmation for other technical setups rather than standalone signals.
Backtest Data Across Timeframes: On daily charts, the 20/50 crossover shows win rates of 58-65% in trending markets but drops to 40-45% in ranging markets. On 15-minute charts, the 9/21 crossover performs better with win rates of 60-68% when filtered for high RVOL stocks. Average returns range from 1.0R to 2.0R depending on how quickly you exit when the trend reverses.
Combining moving average crossovers with momentum trading filters dramatically improves performance. For example, only taking 9/21 crossovers on stocks with RVOL above 2.0 and price above VWAP increases win rates by 10-15 percentage points. This is the power of confluence—stacking multiple technical setups to create higher-probability trades.
8. Support and Resistance Bounce
Support and resistance levels are the foundation of technical analysis, and bounce setups at these levels offer some of the highest probability trades available. The concept is simple but powerful: price tends to respect levels where significant buying or selling occurred in the past, creating predictable bounce or rejection zones.
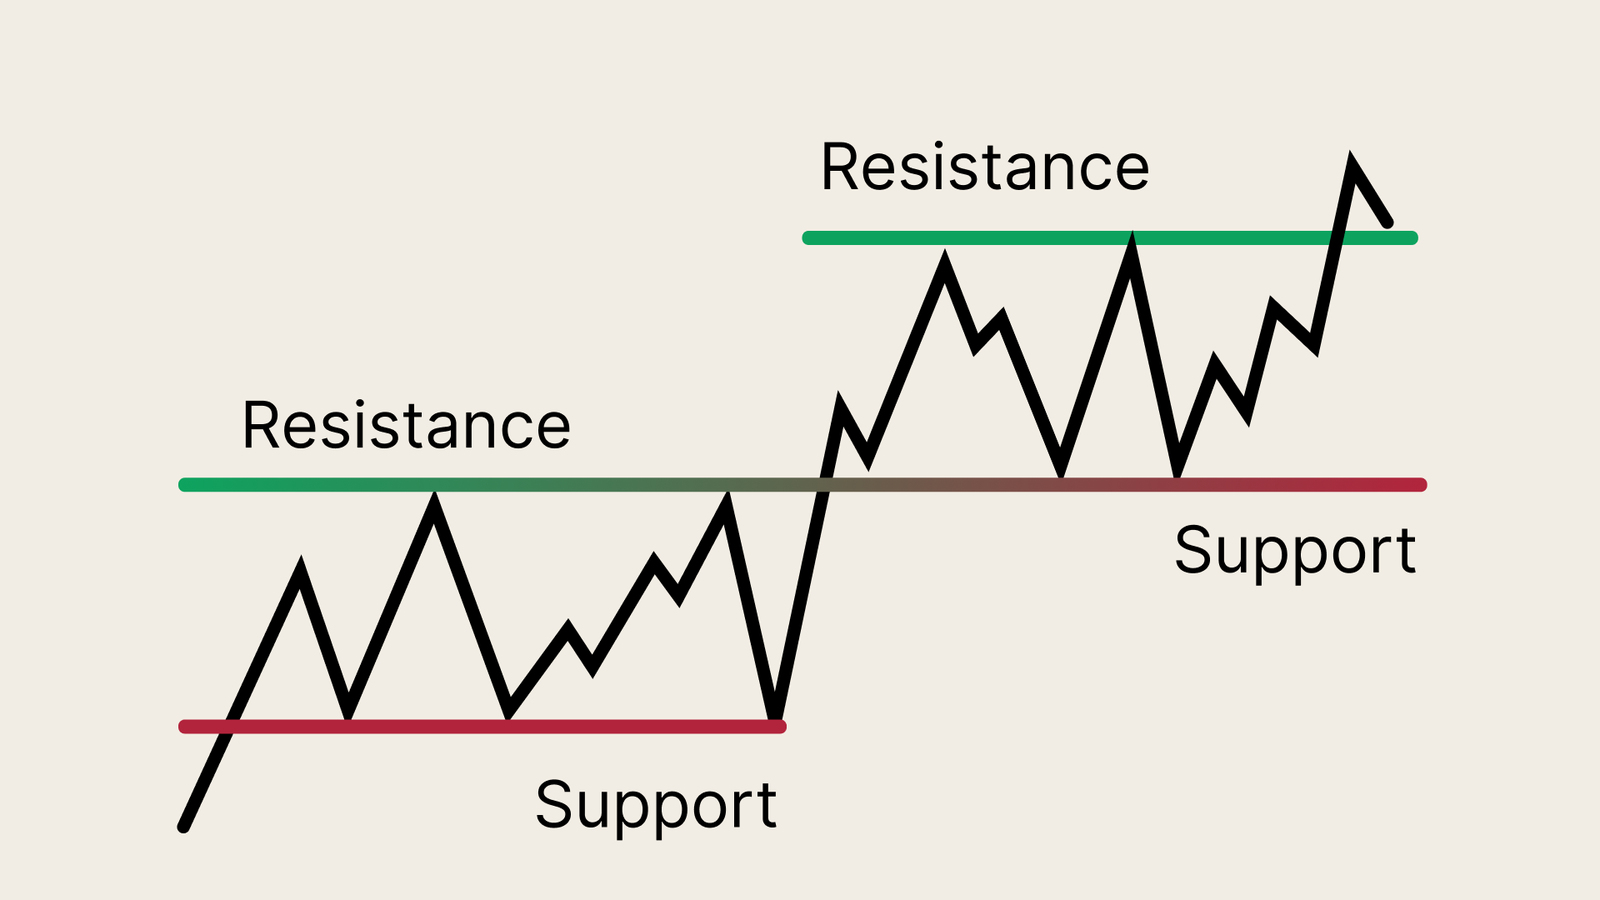
Identifying Key S/R Levels: Look for price levels where the stock has reversed multiple times in the past. The more touches a level has, the more significant it becomes. Also pay attention to psychological round numbers ($50, $100, $150), previous day high/low, and weekly/monthly highs and lows. Volume profile can also reveal price levels where the most volume traded, indicating institutional interest.
Entry Criteria: Don't enter just because price reaches a support level. Wait for a rejection candle—a hammer, bullish engulfing, or strong close near the high, that shows buyers are defending the level. Volume should increase on the bounce, confirming that buyers are stepping in aggressively. The best entries occur on the first or second touch of a level, not the fifth or sixth when the level is weakening.
Multiple Timeframe Confirmation: Always check higher timeframes to ensure your support level aligns with broader market structure. A support level on a 5-minute chart is much more reliable if it coincides with support on the 1-hour or daily chart. This multi-timeframe approach filters out weak levels and focuses your attention on the zones that institutions are watching.
Stop-Loss and Risk Management: Place stops just below the support level (for longs) or above resistance (for shorts), typically 10-30 cents depending on the stock's average true range. If the level breaks, you want to exit immediately because the setup has failed. Never give a support bounce "more room"—that's how small losses become large ones.
Historical Success Rates: Support and resistance bounces show win rates of 65-75% when properly identified with volume confirmation. The key word is "properly"—most traders draw support and resistance lines incorrectly or don't wait for confirmation. Average returns range from 1.5R to 2.5R, with the best performers occurring at major levels that have held multiple times.
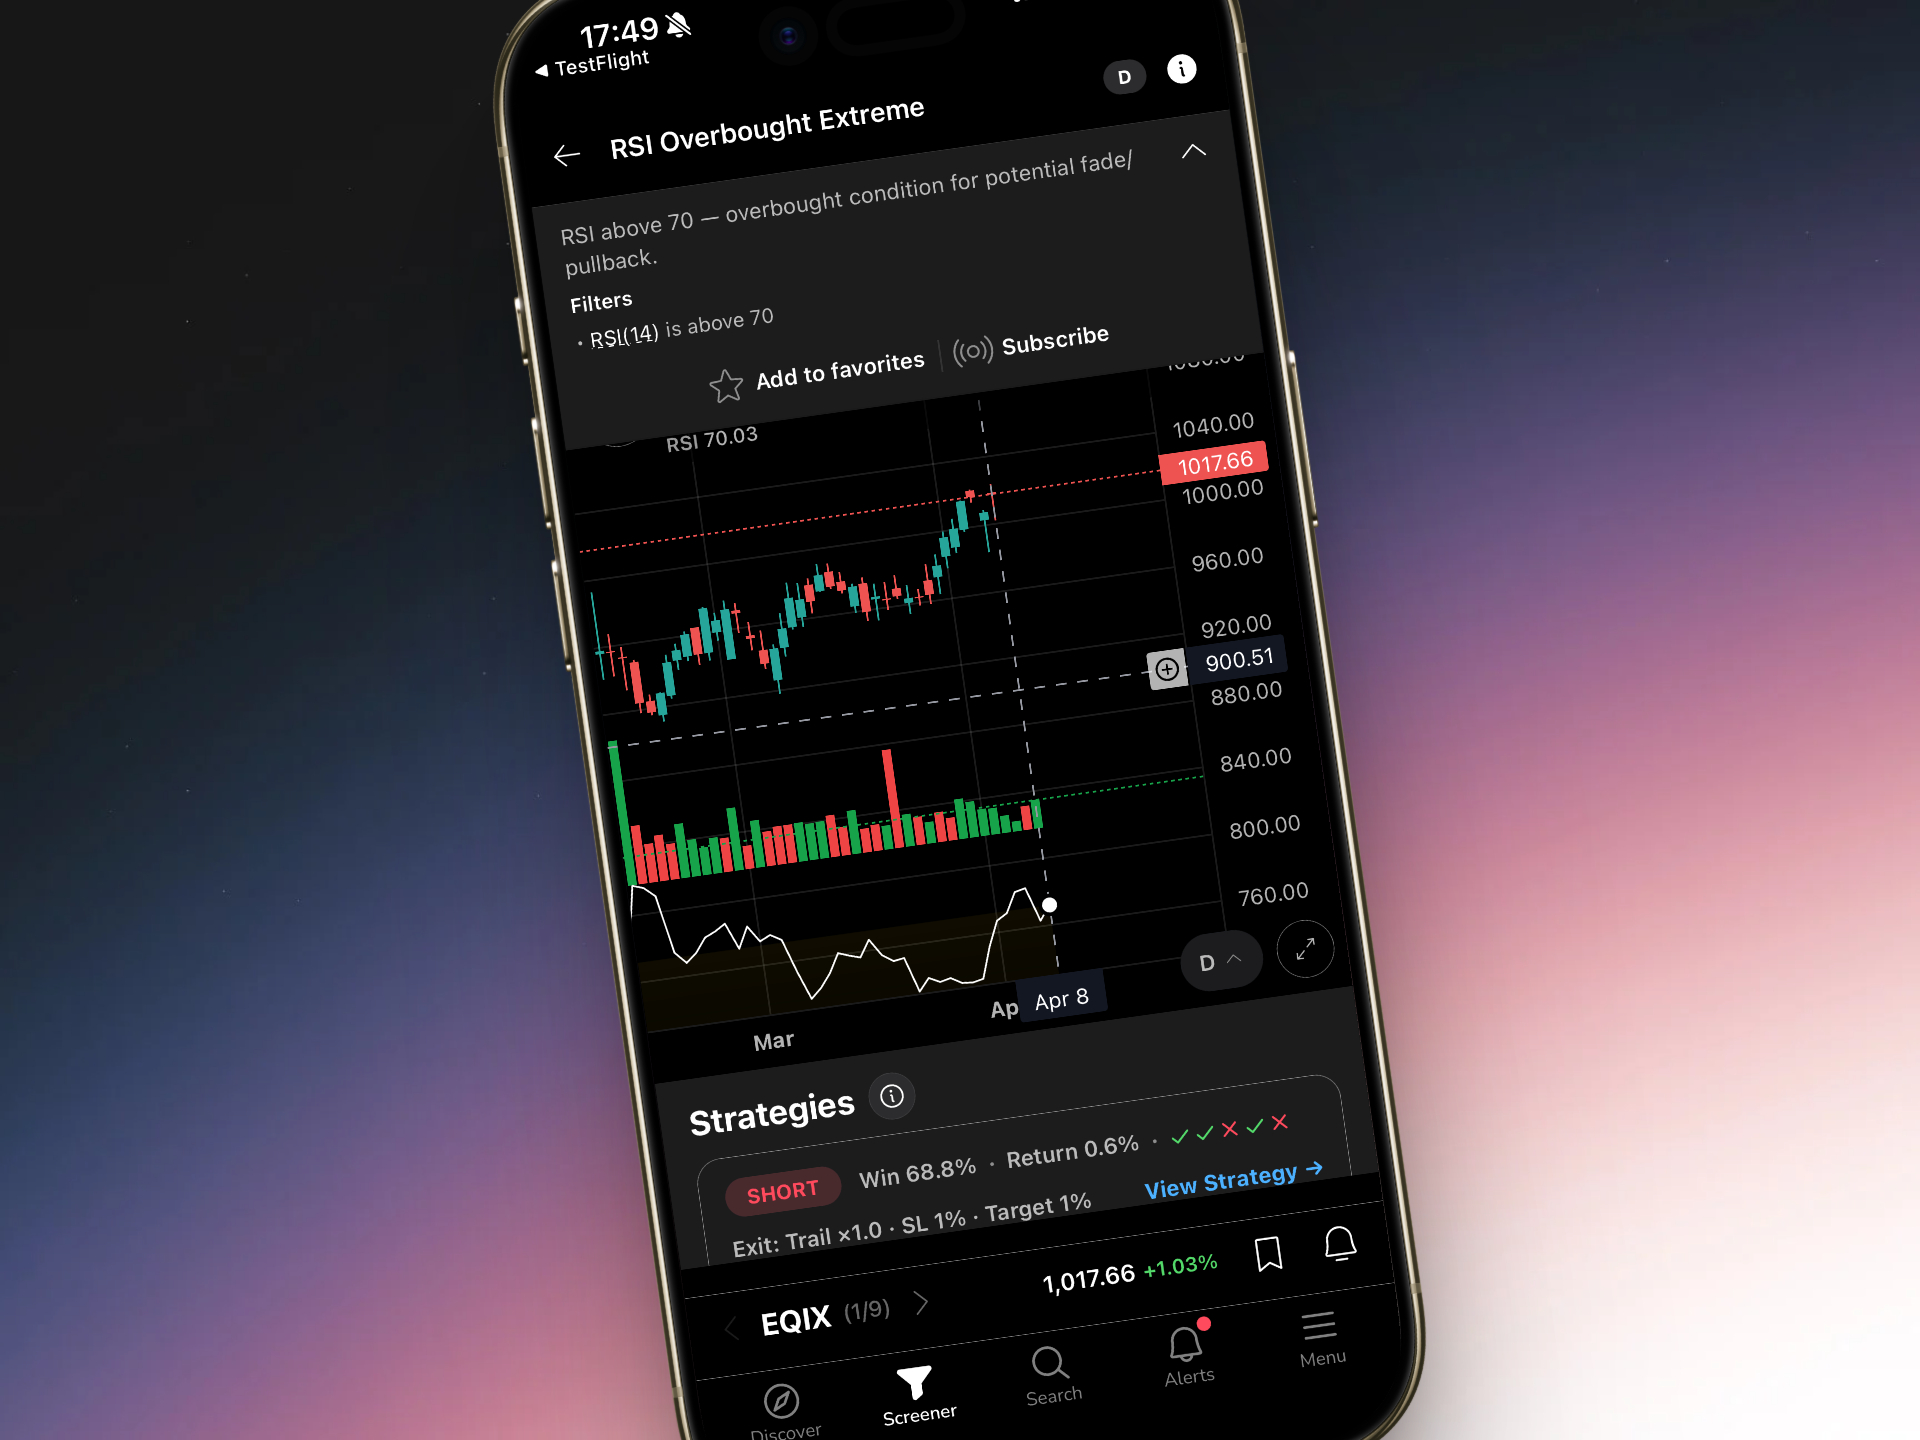
9. RSI Divergence Reversal
RSI divergence is one of the most powerful reversal technical setups available, yet it's often misunderstood or misapplied. Divergence occurs when price makes a new high (or low) but the RSI indicator fails to confirm that high (or low), suggesting that momentum is weakening and a reversal may be imminent.
Bullish and Bearish Divergence: Bullish divergence occurs when price makes a lower low but RSI makes a higher low, indicating that selling pressure is decreasing. Bearish divergence occurs when price makes a higher high but RSI makes a lower high, indicating that buying pressure is weakening. Both setups signal potential trend reversals.
Entry Timing: Don't enter on divergence alone, it can persist for multiple candles or even days. Wait for price action confirmation such as a reversal candle, break of a trendline, or moving average crossover. The divergence tells you a reversal is possible; the price action confirmation tells you it's happening now.
RSI Threshold Levels: Traditional RSI levels are 30 (oversold) and 70 (overbought), but many traders use 20/80 for stronger signals or 40/60 for trend-following entries. In strong trends, RSI can remain overbought or oversold for extended periods, so divergence is more reliable than absolute levels. Adjust your thresholds based on the stock's typical behavior and market conditions.
Backtest Performance: RSI divergence setups show win rates of 60-70% in ranging markets but drop to 45-55% in strong trending markets where momentum can persist despite divergence. This is why confirmation is critical, divergence alone is not enough. Average returns range from 1.5R to 3.0R, with the best performers occurring at major support or resistance levels where divergence and structure align.
False Signal Filtering: Not all divergences lead to reversals. Filter for quality by requiring divergence to occur at key support/resistance levels, combining it with other technical indicators like MACD or volume analysis, and ensuring the broader trend supports your reversal thesis. Divergence against the primary trend is more reliable than divergence with the trend.
10. MACD Histogram Flip
The MACD (Moving Average Convergence Divergence) histogram flip is a momentum-based technical setup that identifies early trend changes before they become obvious on price charts. While the MACD line crossover is well-known, the histogram flip often provides earlier signals with less lag.
Understanding MACD Components: The MACD consists of the MACD line (12 EMA minus 26 EMA), the signal line (9 EMA of the MACD line), and the histogram (MACD line minus signal line). The histogram flip occurs when the histogram changes from negative to positive (bullish) or positive to negative (bearish), indicating a shift in momentum.
Entry on Histogram Color Change: Enter when the histogram flips from red to green (bullish) or green to red (bearish) with price confirmation. The best setups occur when the flip happens near the zero line, indicating a strong momentum shift. Flips that occur far from the zero line are often late signals in exhausted moves.
Combining with Price Structure: Never trade MACD histogram flips in isolation. Combine them with support/resistance levels, trendlines, or chart patterns for confirmation. For example, a bullish histogram flip at a key support level with a hammer candle is a high-probability long setup. The MACD provides the momentum signal; the price structure provides the context.
Expected Value and Win Rate: MACD histogram flips show win rates of 55-65% depending on market conditions and timeframe. They perform best on trending stocks and underperform on choppy, range-bound stocks where the histogram flips frequently without meaningful price movement. Average returns range from 1.0R to 2.0R, making this a solid confirmation tool rather than a standalone strategy.
Best Timeframes: For day trading, use MACD on 5-minute or 15-minute charts with settings adjusted to 6/13/5 for faster signals. For swing trading, stick with the standard 12/26/9 settings on daily charts. The key is matching the indicator's sensitivity to your trading timeframe and style.
11. Volume Breakout Above Average
Volume is the fuel that drives price movement, and volume breakouts above average levels often precede significant price moves. This technical setup focuses on identifying unusual volume spikes that indicate institutional accumulation or distribution before the price move becomes obvious.
Volume Threshold Requirements: Look for volume to exceed 2x to 3x the 20-day average volume. On intraday charts, compare current volume to the average volume for that specific time of day (this is where RVOL comes in). The higher the volume spike relative to normal, the more significant the signal.
Price Action Confirmation: Volume alone is meaningless without directional price movement. You need to see volume increasing as price breaks key levels, resistance for longs, support for shorts. The best setups show volume expanding on breakout candles and contracting on pullback candles, indicating that buyers (or sellers) are in control.
Accumulation vs. Distribution: High volume can indicate either accumulation (bullish) or distribution (bearish). The key is the price action context. Volume spikes on up days near support suggest accumulation; volume spikes on down days near resistance suggest distribution. Also watch for volume patterns, increasing volume on rallies and decreasing volume on pullbacks is bullish; the opposite is bearish.
Backtest Data: Volume-confirmed breakouts show win rates of 65-75%, significantly higher than breakouts on weak volume (45-55%). This makes volume one of the most important filters for any breakout trading strategy. Average returns range from 1.5R to 3.0R, with the best performers occurring when volume exceeds 3x average and price breaks multiple technical levels simultaneously.
Time-of-Day Considerations: Volume patterns vary throughout the trading day. The first and last hours typically see the highest volume, while midday often sees volume dry up. Adjust your volume thresholds accordingly, a 2x volume spike at 2:00 PM is more significant than the same spike at 9:45 AM when volume is naturally elevated.
12. Pocket Pivot Setup
The pocket pivot is a lesser-known but highly effective technical setup developed by Investor's Business Daily. It identifies accumulation days where buying volume exceeds the highest selling volume from the previous 10 days, suggesting that institutions are building positions.
Definition and Criteria: A pocket pivot occurs when a stock closes up for the day and the volume on that up day exceeds the highest volume on any down day in the previous 10 trading sessions. This indicates that buyers are more aggressive than sellers have been recently, suggesting a shift in supply and demand dynamics.
Base-Building Requirements: Pocket pivots are most effective when they occur after a stock has built a proper base, a consolidation period of at least 4-6 weeks where the stock digests previous gains. The pivot should occur in the lower half of the base, ideally near the 10-week or 50-day moving average, indicating that the stock is finding support before the next leg higher.
Stop-Loss and Position Sizing: Place stops below the low of the pocket pivot day or below the nearest support level, typically 5-8% below your entry. Because pocket pivots are swing trading setups rather than day trading setups, you need to give them more room to work. Position size accordingly, if your stop is 7% away, size your position so that 7% equals your maximum acceptable loss per trade.
Historical Win Rates: Pocket pivot setups show win rates of 60-70% when combined with proper base analysis and market timing. They perform best in bull markets and underperform in bear markets when institutional buying is scarce. Average returns range from 2.0R to 4.0R over holding periods of 2-8 weeks, making this one of the higher expected value swing trading setups available.
Best Market Environments: Pocket pivots work best when the overall market is in a confirmed uptrend and leading stocks are breaking out. Don't trade pocket pivots in bear markets or when the major indices are below their 50-day moving averages. Market timing is critical for this setup, even perfect pocket pivots fail in bad market conditions.
13. Three Bar Play (Momentum Continuation)
The three bar play is a simple but effective momentum continuation pattern that identifies stocks in strong trends with minimal pullbacks. The setup consists of three consecutive candles making higher highs and higher lows (for uptrends) or lower highs and lower lows (for downtrends), signaling sustained directional momentum.
Pattern Structure: For a bullish three bar play, each of the three candles must have a higher high and higher low than the previous candle. The candles should be relatively uniform in size, indicating steady momentum rather than parabolic acceleration. Avoid patterns where the third candle is significantly larger than the first two, as this often signals exhaustion.
Entry on Fourth Bar: Enter on the fourth bar when it continues the pattern, making a new higher high for longs or lower low for shorts. Some traders enter on the break of the third bar's high, while others wait for the fourth bar to close to confirm continuation. The aggressive approach captures more of the move but has more false signals; the conservative approach has fewer false signals but smaller gains.
Volume and Range Requirements: Volume should be consistent or increasing across the three bars, and each bar should have a reasonable range (not tiny doji candles). The pattern works best on stocks with RVOL above 1.5 and average true range (ATR) that allows for meaningful profit targets. Avoid trading this pattern on low-volatility stocks where the potential reward doesn't justify the risk.
Backtest Performance: Three bar plays show win rates of 58-68% across various timeframes, with higher success rates on 15-minute and 1-hour charts compared to 5-minute charts where noise is more prevalent. Average returns range from 1.2R to 2.5R, with the best performers occurring in strong trending markets where momentum persists.
Timeframe Optimization: This pattern works on all timeframes but performs best on 15-minute to daily charts. On very short timeframes (1-minute, 5-minute), the pattern occurs too frequently and has too many false signals. On very long timeframes (weekly, monthly), the pattern is rare and the holding period is too long for most traders. The sweet spot is 15-minute to daily charts for most trading styles.
14. Fibonacci Retracement Bounce
Fibonacci retracement levels are based on the mathematical relationships discovered by Leonardo Fibonacci and have been used by traders for decades to identify potential support and resistance zones. While some dismiss Fibonacci as mystical nonsense, the levels work because enough traders watch them, creating self-fulfilling prophecies.
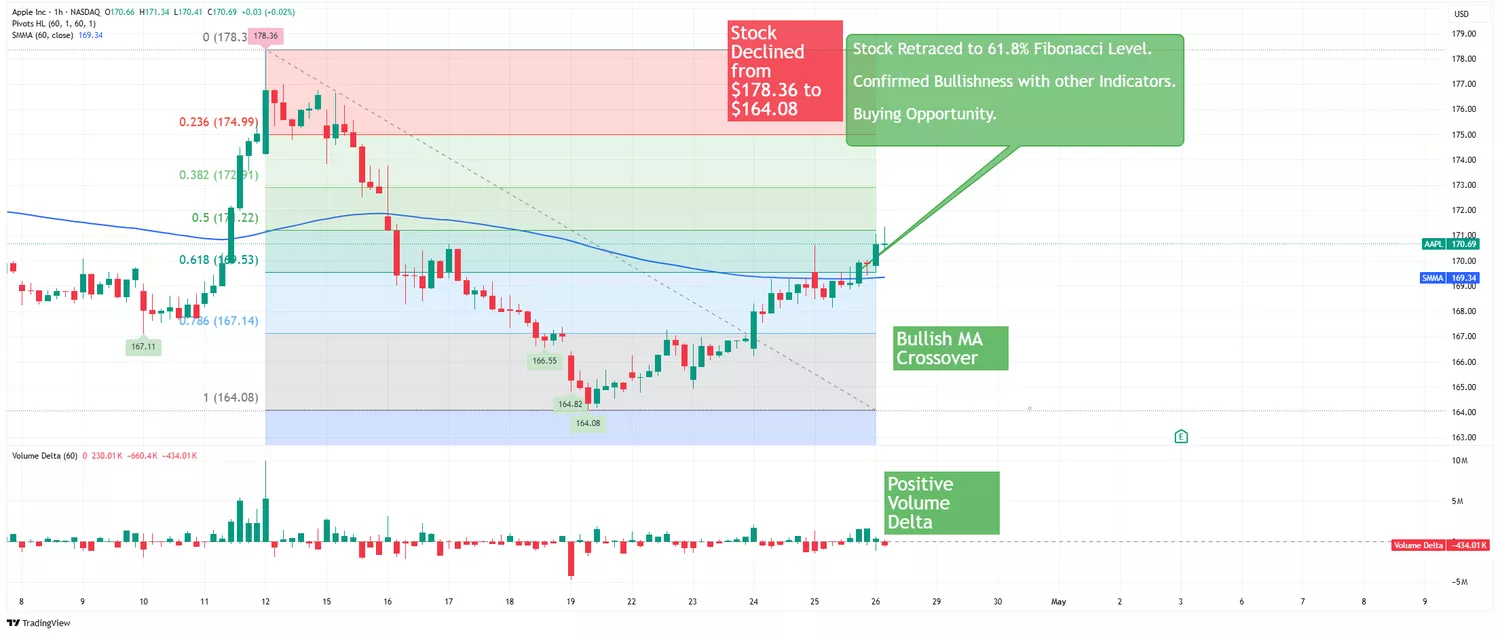
Key Fibonacci Levels: The most important retracement levels are 38.2%, 50%, and 61.8%. After a strong move, price often retraces to one of these levels before continuing in the original direction. The 50% level is technically not a Fibonacci number but is widely watched and often acts as support/resistance. The 61.8% level (the "golden ratio") is considered the last line of defense before the original move is invalidated.
Entry Criteria: Don't blindly buy at Fibonacci levels. Wait for price to reach the level and show a reaction, a reversal candle, volume spike, or other confirmation that buyers (or sellers) are defending the level. The best Fibonacci bounces occur when the retracement level coincides with other technical factors like previous support/resistance, moving averages, or round numbers.
Combining with Support/Resistance: Fibonacci levels are most powerful when they align with other technical analysis tools. For example, if the 61.8% retracement of a recent rally coincides with the 50-day moving average and a previous swing low, you have a high-probability support zone. This confluence of factors increases the likelihood that the level will hold.
Historical Success Rates: Fibonacci retracement bounces show win rates of 60-70% when combined with proper confirmation and confluence analysis. The 50% and 61.8% levels tend to be more reliable than the 38.2% level, which is often too shallow to provide meaningful support. Average returns range from 1.5R to 3.0R depending on how far the continuation move extends.
Risk-Reward Optimization: The beauty of Fibonacci setups is that they provide clear risk parameters. Your stop goes just below the Fibonacci level you're trading (for longs), and your target is the previous high or an extension level (127.2%, 161.8%). This typically provides 2:1 to 4:1 risk-reward ratios, making Fibonacci bounces attractive even with moderate win rates.
15. Parabolic SAR Flip
The Parabolic SAR (Stop and Reverse) is a trend-following indicator that provides clear entry and exit signals through the placement of dots above or below price. When the dots flip from above price to below (or vice versa), it signals a potential trend change and provides a trailing stop-loss level for existing positions.
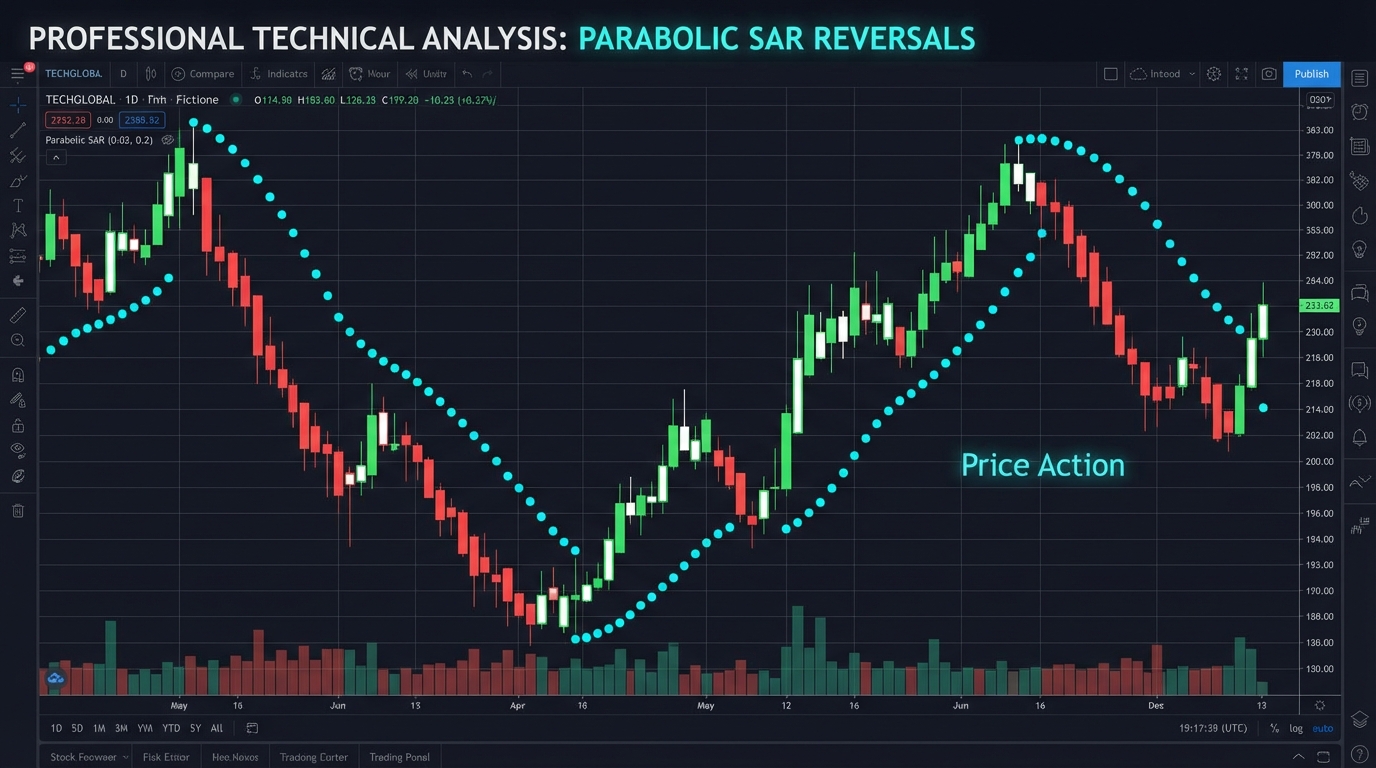
How Parabolic SAR Works: The indicator places dots above price during downtrends and below price during uptrends. The dots accelerate (move closer to price) as the trend continues, which is why it's called "parabolic." When price crosses the dots, they flip to the other side, signaling a potential trend reversal. The SAR also provides a trailing stop level, if you're long and price touches the SAR dots, it's time to exit.
Entry on SAR Flip: Enter long when the SAR dots flip from above price to below price, and enter short when they flip from below to above. However, don't enter on the flip alone, wait for price confirmation such as a strong directional candle or break of a key level. The SAR flip tells you the trend may be changing; the price action confirms it's actually happening.
Trailing Stop Strategy: One of the best uses of Parabolic SAR is as a trailing stop for existing positions. As the SAR dots move closer to price, they provide an objective exit level that locks in profits while giving the trend room to continue. This removes emotion from the exit decision, when price touches the SAR, you exit, no questions asked.
Backtest Data in Different Volatility Environments: Parabolic SAR performs best in trending, moderate-volatility environments. In choppy, range-bound markets, the indicator flips frequently, generating many false signals with win rates dropping to 40-50%. In strong trending markets, win rates increase to 65-75% with average returns of 2.0R to 4.0R. The key is filtering for trending stocks and avoiding the indicator during consolidation periods.
Combining with Other Momentum Indicators: Parabolic SAR works well when combined with other technical indicators like ADX (Average Directional Index) to confirm trend strength. Only take SAR flips when ADX is above 25, indicating a strong trend is present. This simple filter can increase win rates by 10-15 percentage points by avoiding choppy market conditions where SAR underperforms.
How to Choose the Right Technical Setups for Your Trading Style
Now that you understand 15 proven technical setups, the question becomes: which ones should you actually trade? The answer depends on your trading style, timeframe, risk tolerance, and available screen time. Let's break down how to build a personalized trading playbook.
Matching Setups to Timeframes: If you're a scalper executing trades on 1-minute to 5-minute charts, focus on setups that trigger frequently and resolve quickly: ORB, VWAP touches, RVOL spikes, and three bar plays. If you're a swing trader holding positions for days or weeks, focus on daily chart setups: bull flags, ascending triangles, pocket pivots, and Fibonacci retracements. Don't try to trade daily chart patterns on 5-minute charts, the timeframe mismatch will kill your edge.
Risk Tolerance and Setup Selection: Some setups have higher win rates but smaller average returns (VWAP touches, support bounces), while others have lower win rates but larger average returns (gap and go, pocket pivots). If you have low risk tolerance and need frequent wins to stay psychologically engaged, focus on the higher win rate setups. If you can handle drawdowns and are comfortable with 55-60% win rates in exchange for 2-3R average winners, trade the higher reward setups.
Combining Multiple Setups: The most powerful approach is to look for confluence, multiple technical setups aligning at the same time. For example, a stock that gaps up (gap and go), breaks the opening range (ORB), and reclaims VWAP (VWAP touch) all within the first 30 minutes is a much higher probability trade than any single setup alone. This is how professional traders think, they stack edges to create asymmetric risk-reward opportunities.
Backtesting Your Own Combinations: Don't just take our word for it, backtest these setups yourself to see which ones align with your psychology and schedule. Use historical data to test different combinations, timeframes, and filters. Track your results in a trading journal to identify which setups you execute well and which ones you struggle with. Your personal edge might be different from someone else's, and that's perfectly fine.
If you want to dive deeper into building a systematic approach to backtesting, check out our comprehensive guide on how to build winning backtesting strategies that covers everything from data collection to statistical validation.
Building a Personalized Trading Playbook: Start by selecting 3-5 setups that match your style and timeframe. Master these setups completely, understand their nuances, failure modes, and optimal market conditions. Once you're consistently profitable with your core setups, you can gradually add more to your playbook. Most professional traders have 5-10 core setups they trade repeatedly rather than trying to trade everything.
Automating Technical Setup Discovery with Modern Scanning Technology
Here's the brutal truth: even if you memorize all 15 of these technical setups, manually scanning thousands of stocks across multiple timeframes is virtually impossible. By the time you identify a setup forming, it's often too late to enter at optimal levels. This is where modern scanning technology becomes a game-changer for serious traders.
The Time Cost of Manual Scanning: Let's do the math. If you're watching 50 stocks across 3 timeframes (5-minute, 15-minute, daily), that's 150 charts to monitor. Even if you can scan each chart in 10 seconds, that's 25 minutes per scan cycle. To catch intraday setups, you'd need to scan every 15-30 minutes, which means spending 2-3 hours per day just looking at charts. And you'll still miss setups that form between your scan cycles.
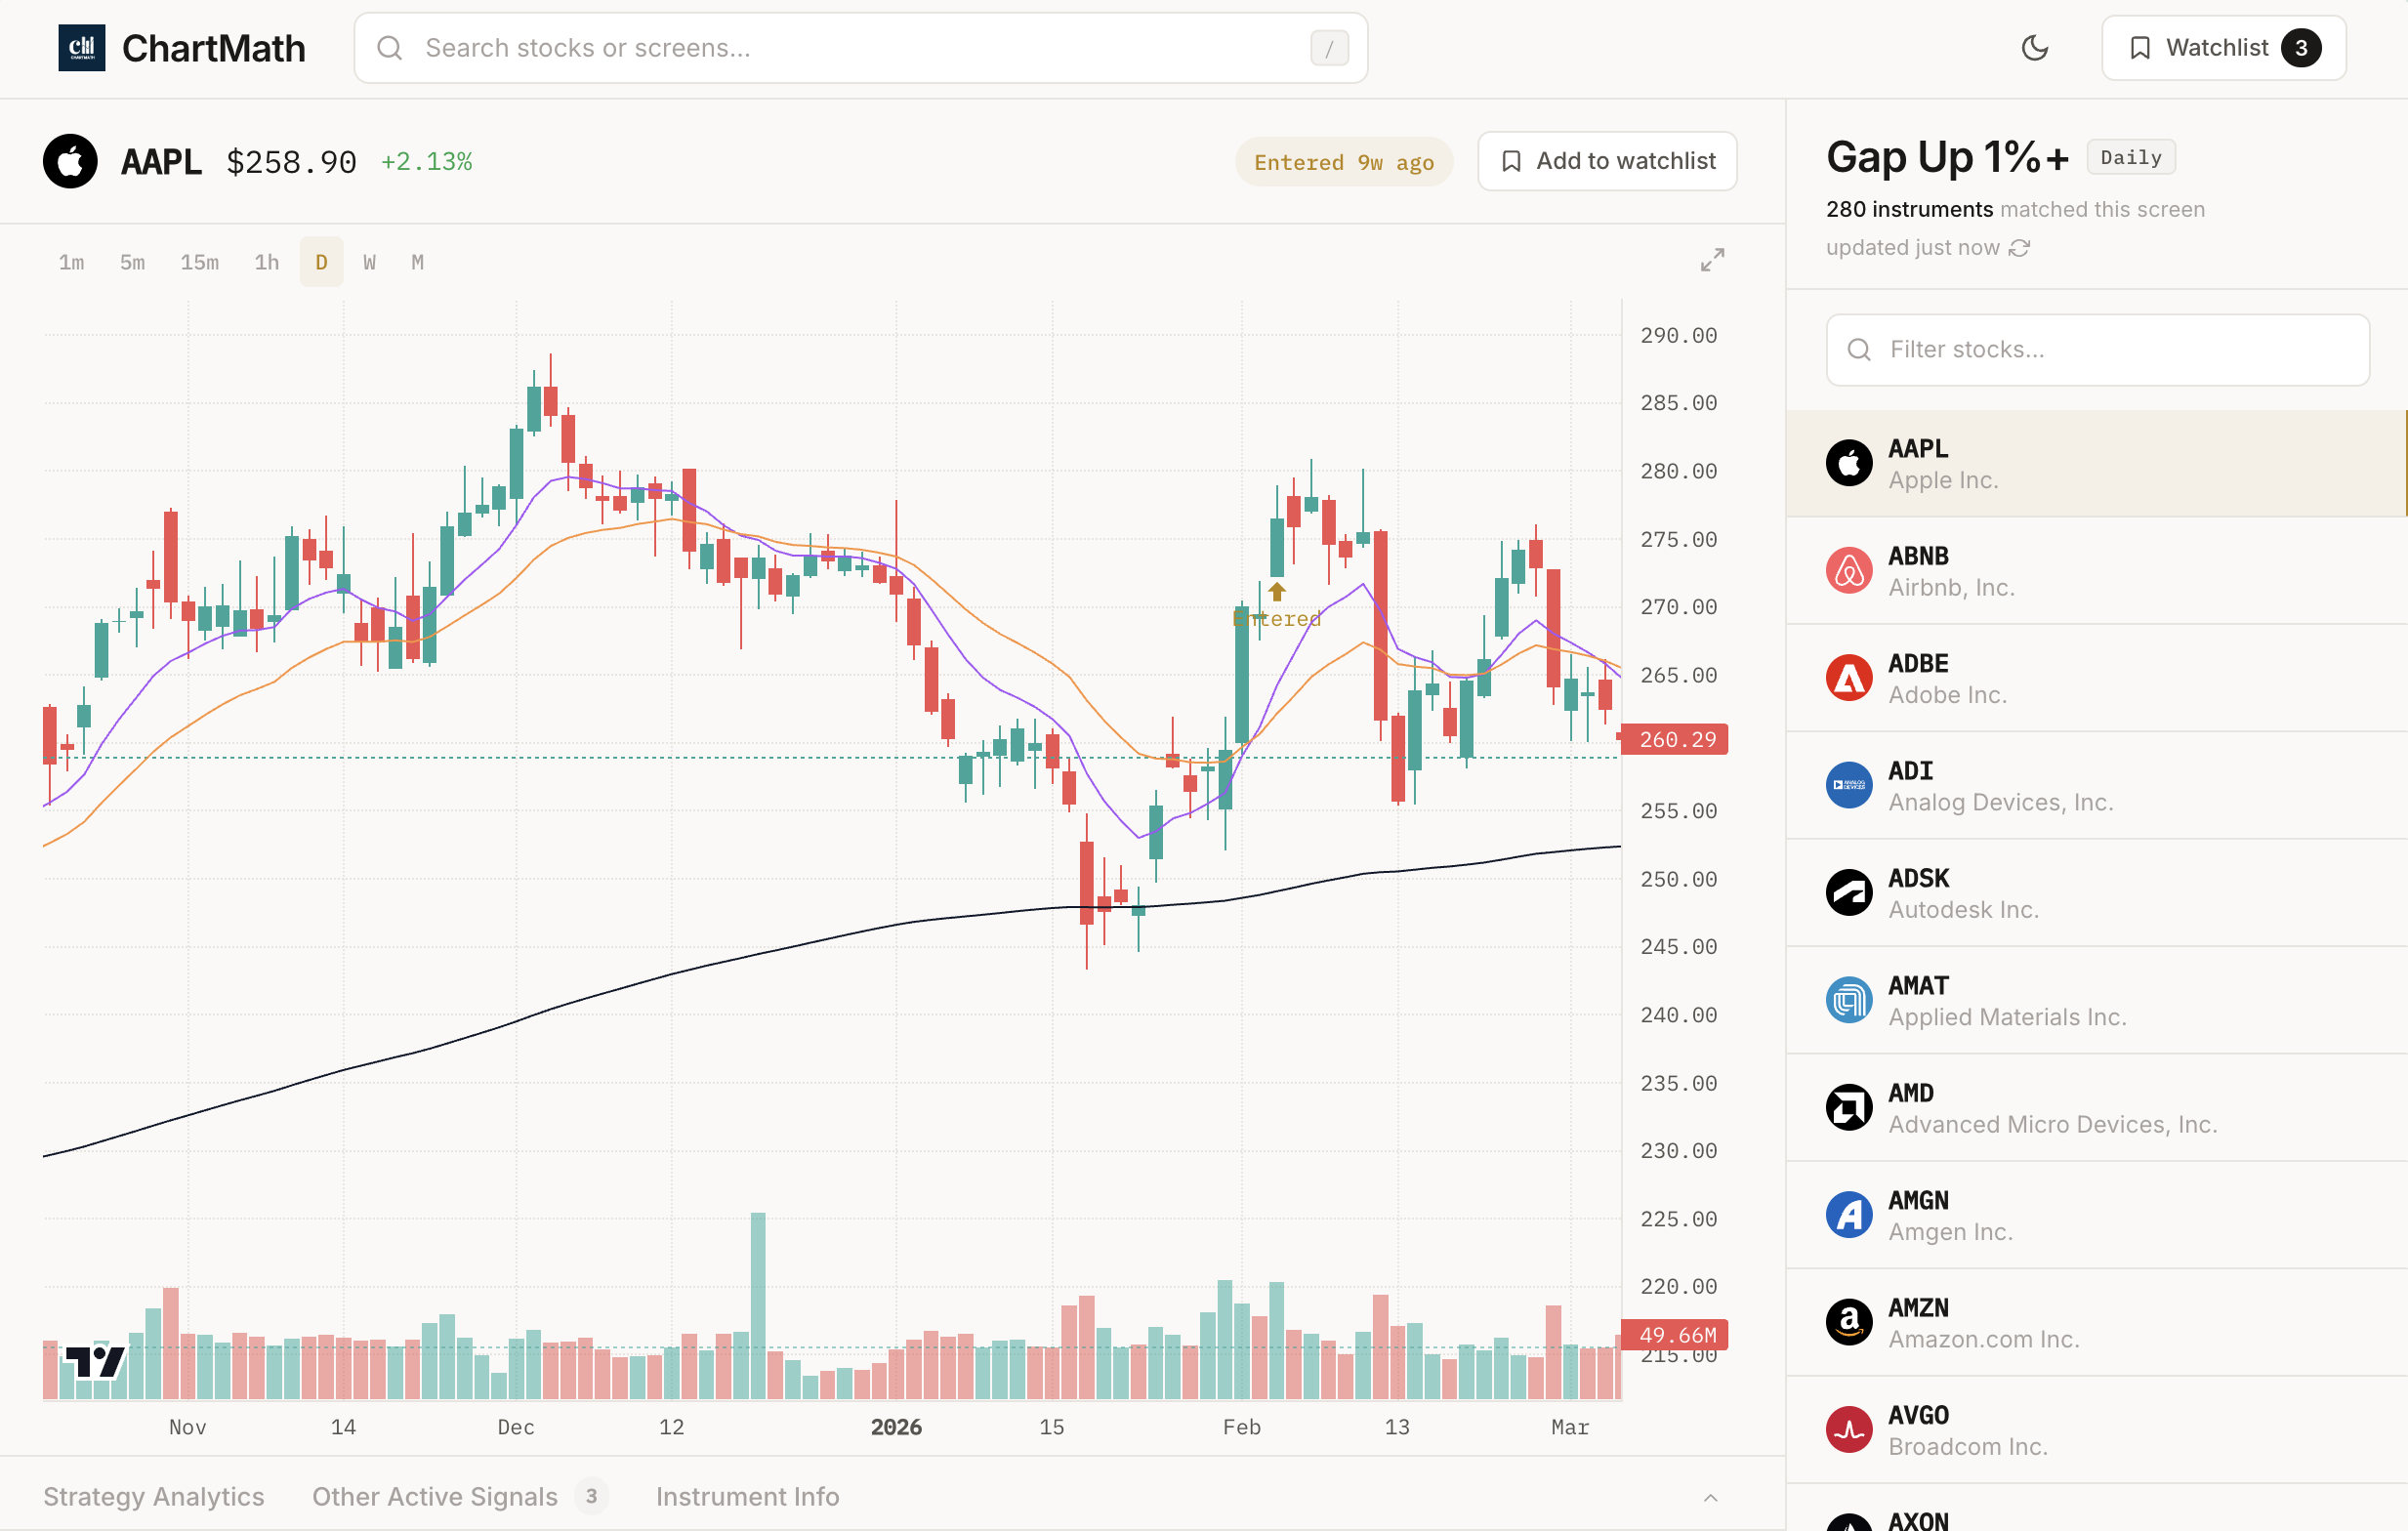
How Real-Time Scanners Work: Modern stock screeners continuously monitor the entire market (or your watchlist) and instantly alert you when stocks match your technical setup criteria. Instead of you scanning 150 charts, the software scans 5,000+ stocks every second and only shows you the ones that matter. This is like having a team of analysts working 24/7 to find your exact setups.
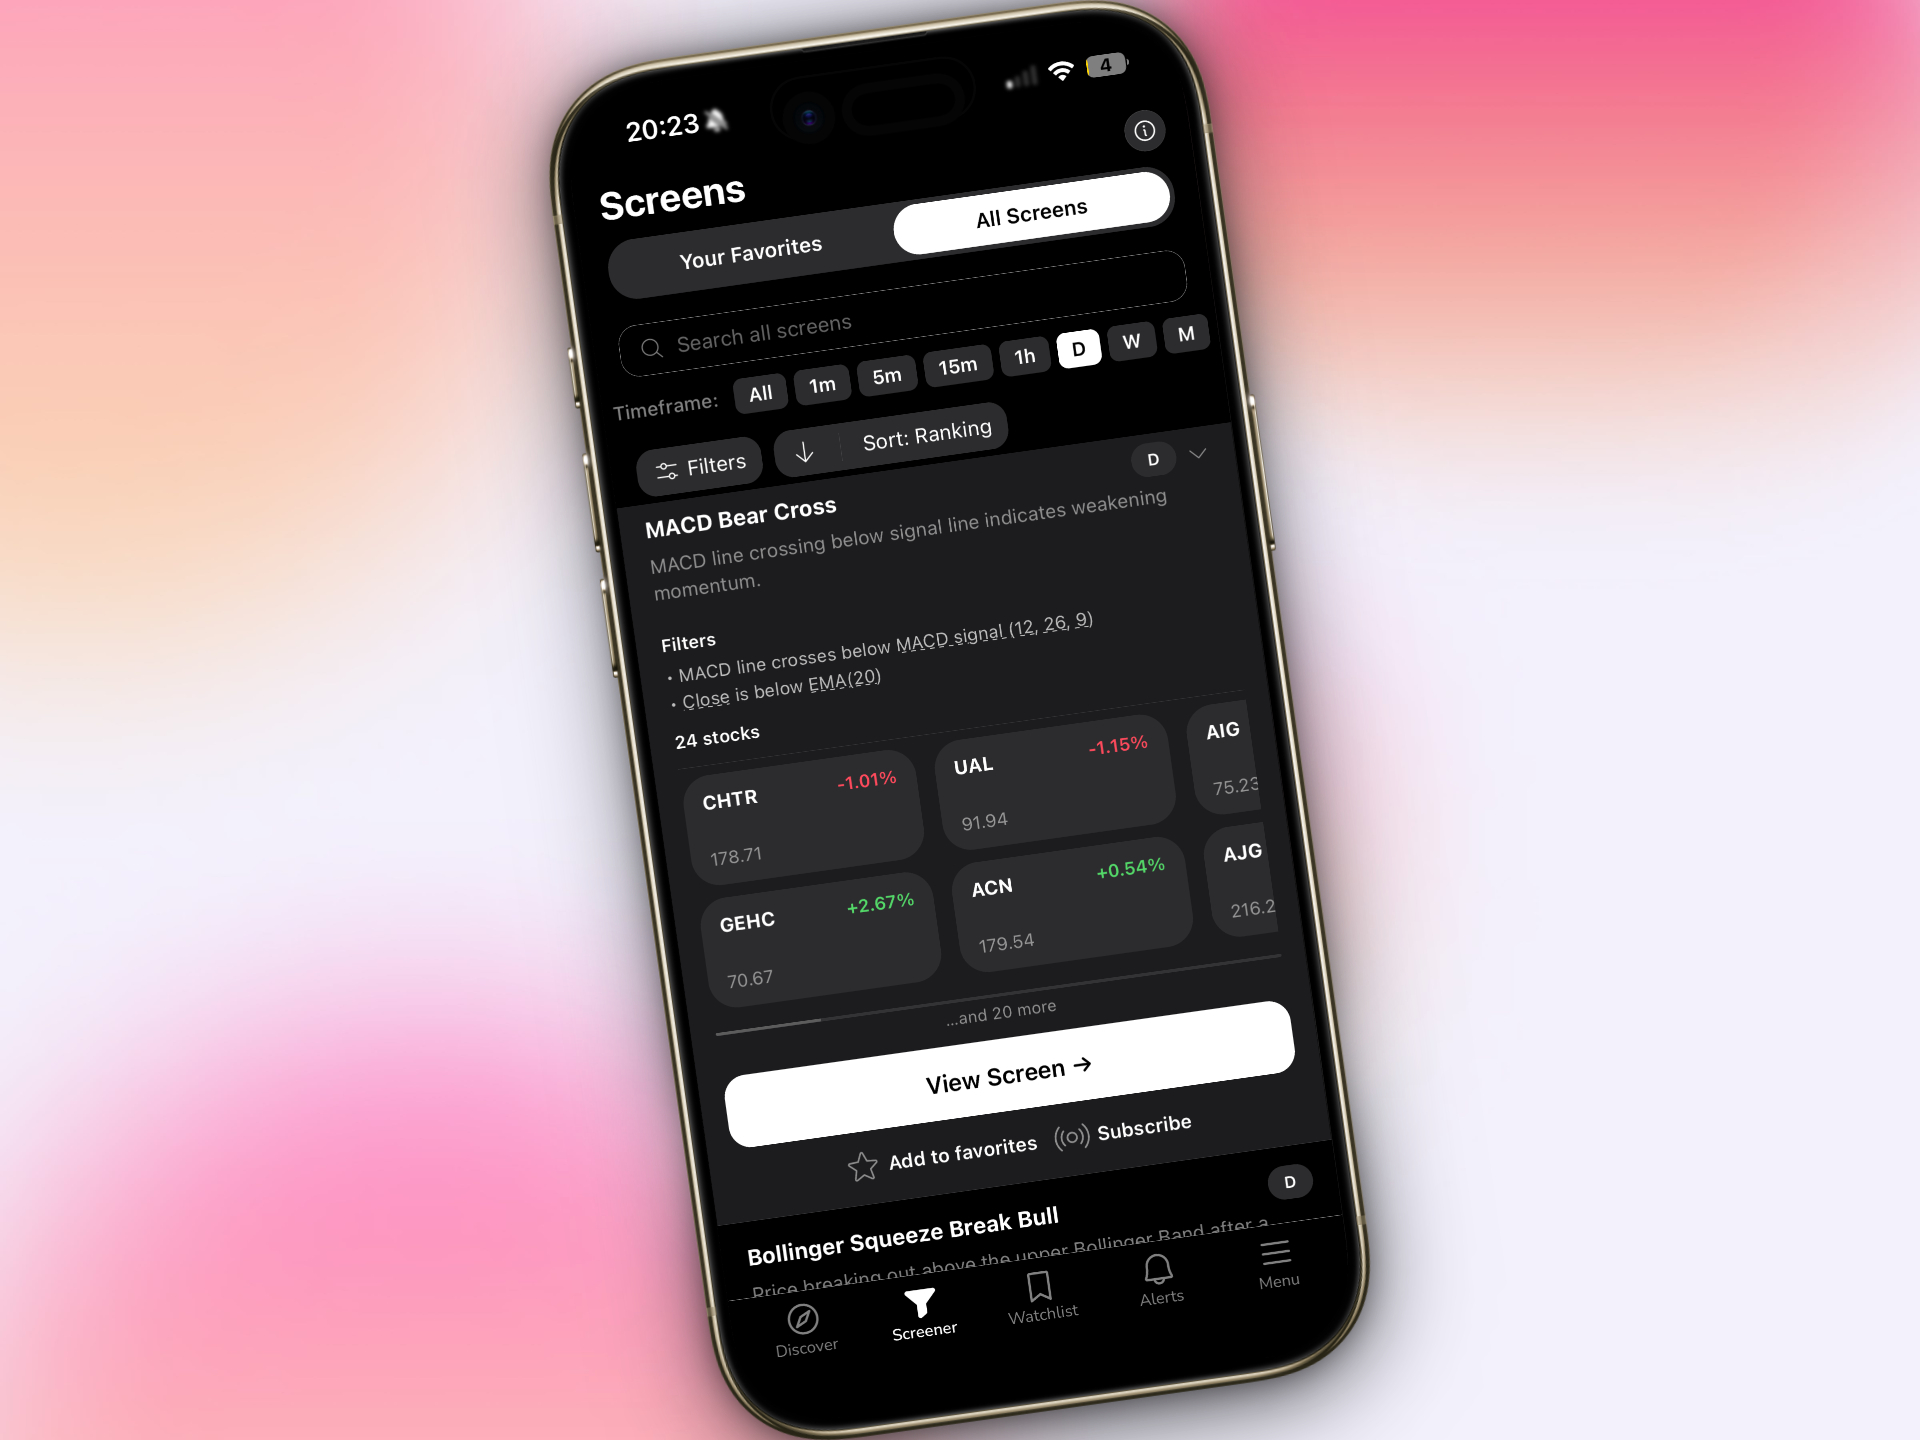
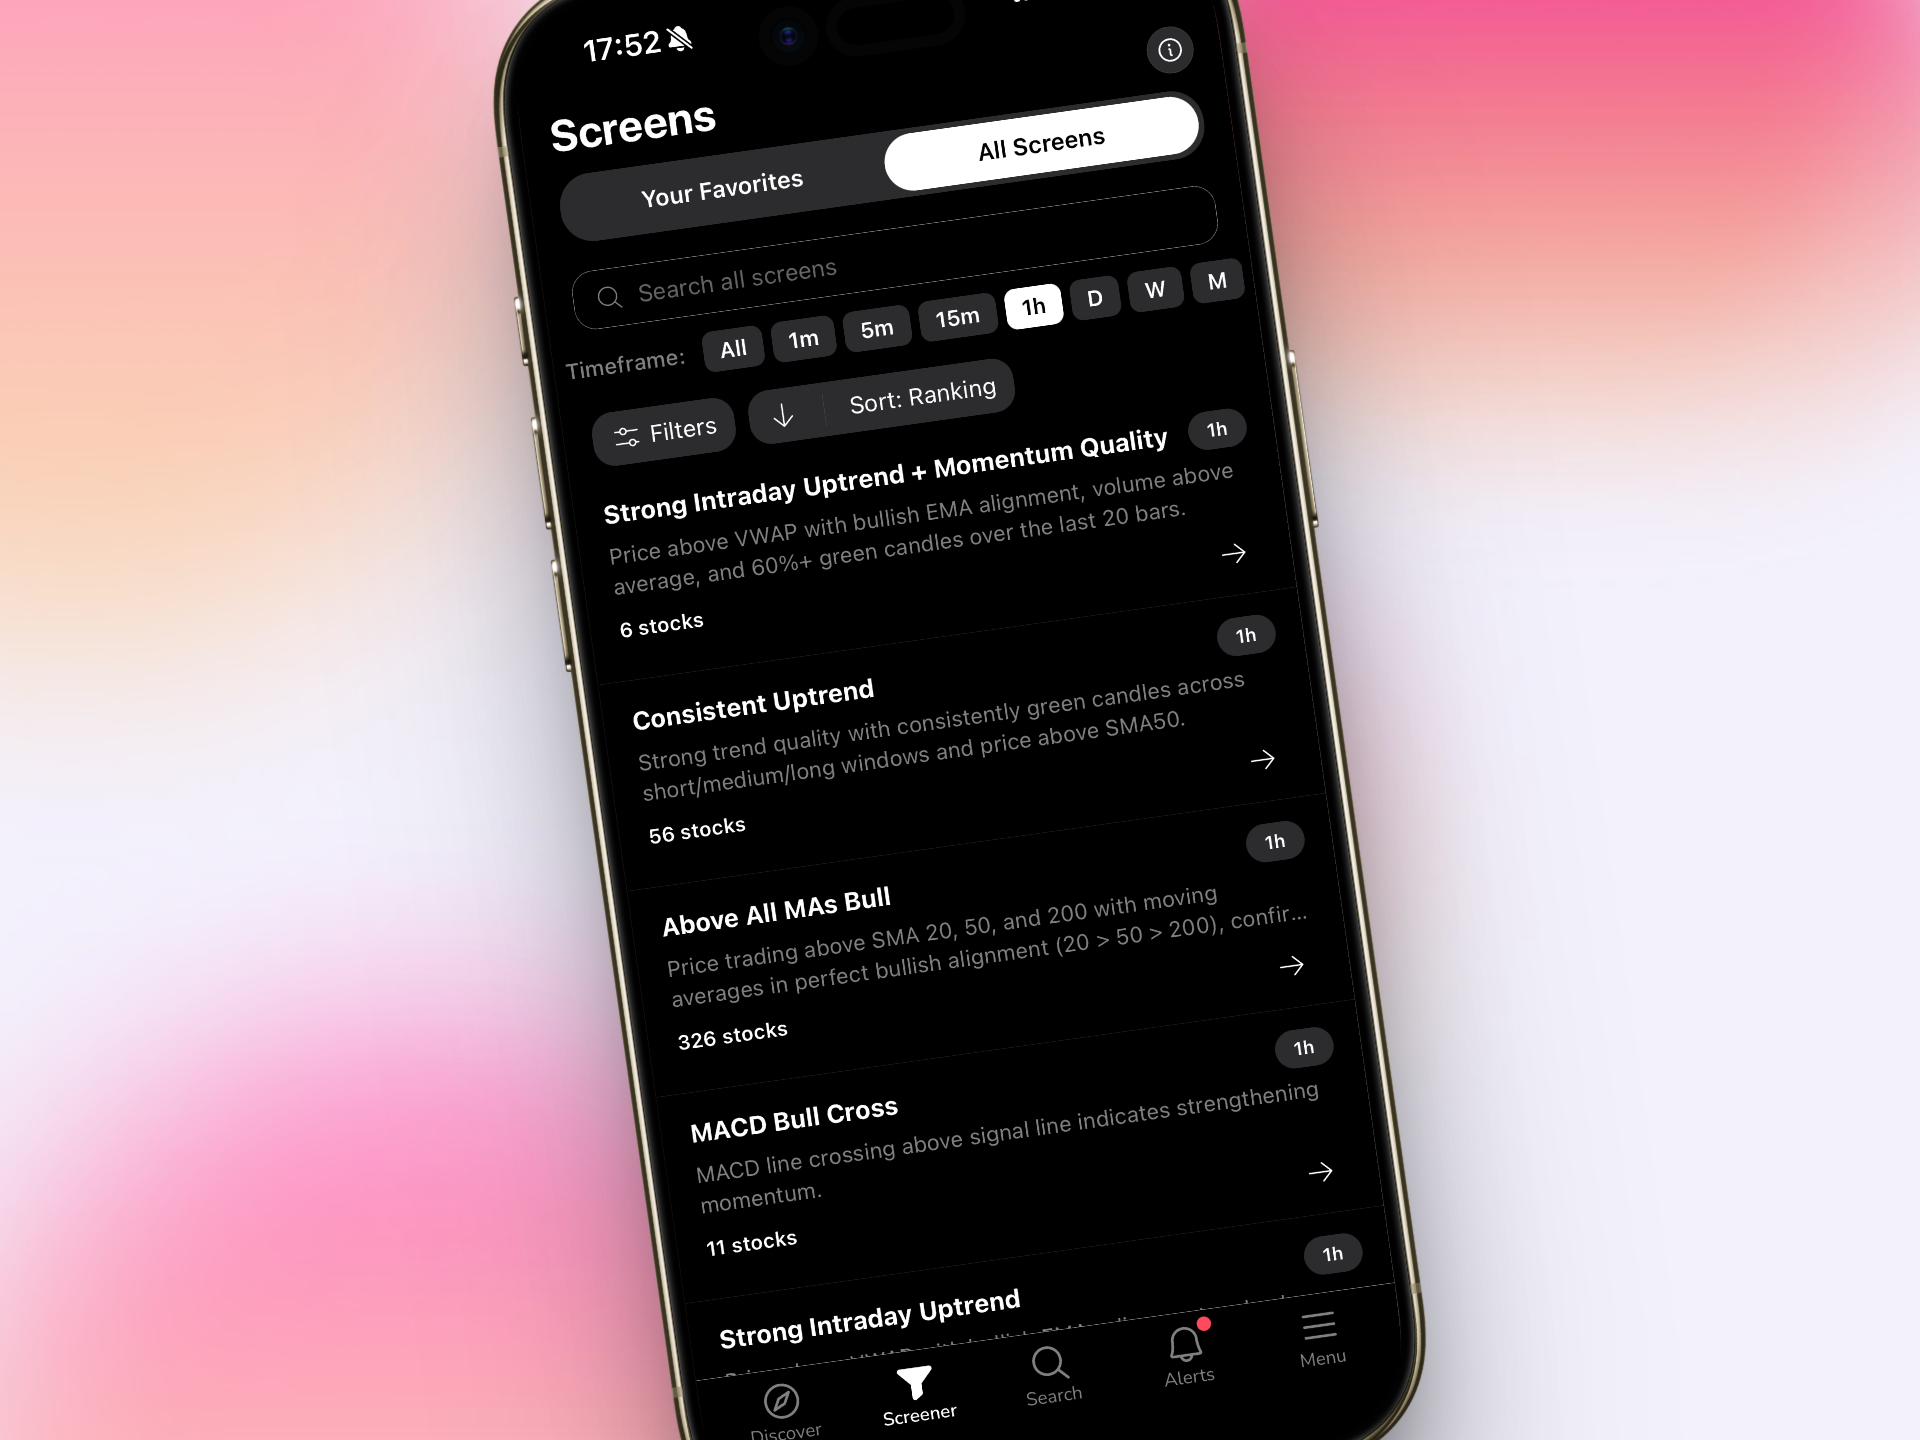
For example, ChartMath runs 200+ pre-built technical screens covering all the setups we've discussed, ORB breaks, VWAP touches, RVOL spikes, bull flags, ascending triangles, and more. When a stock matches the criteria, you get an instant alert with plain-English explanations of why the setup triggered and what the historical performance data shows.
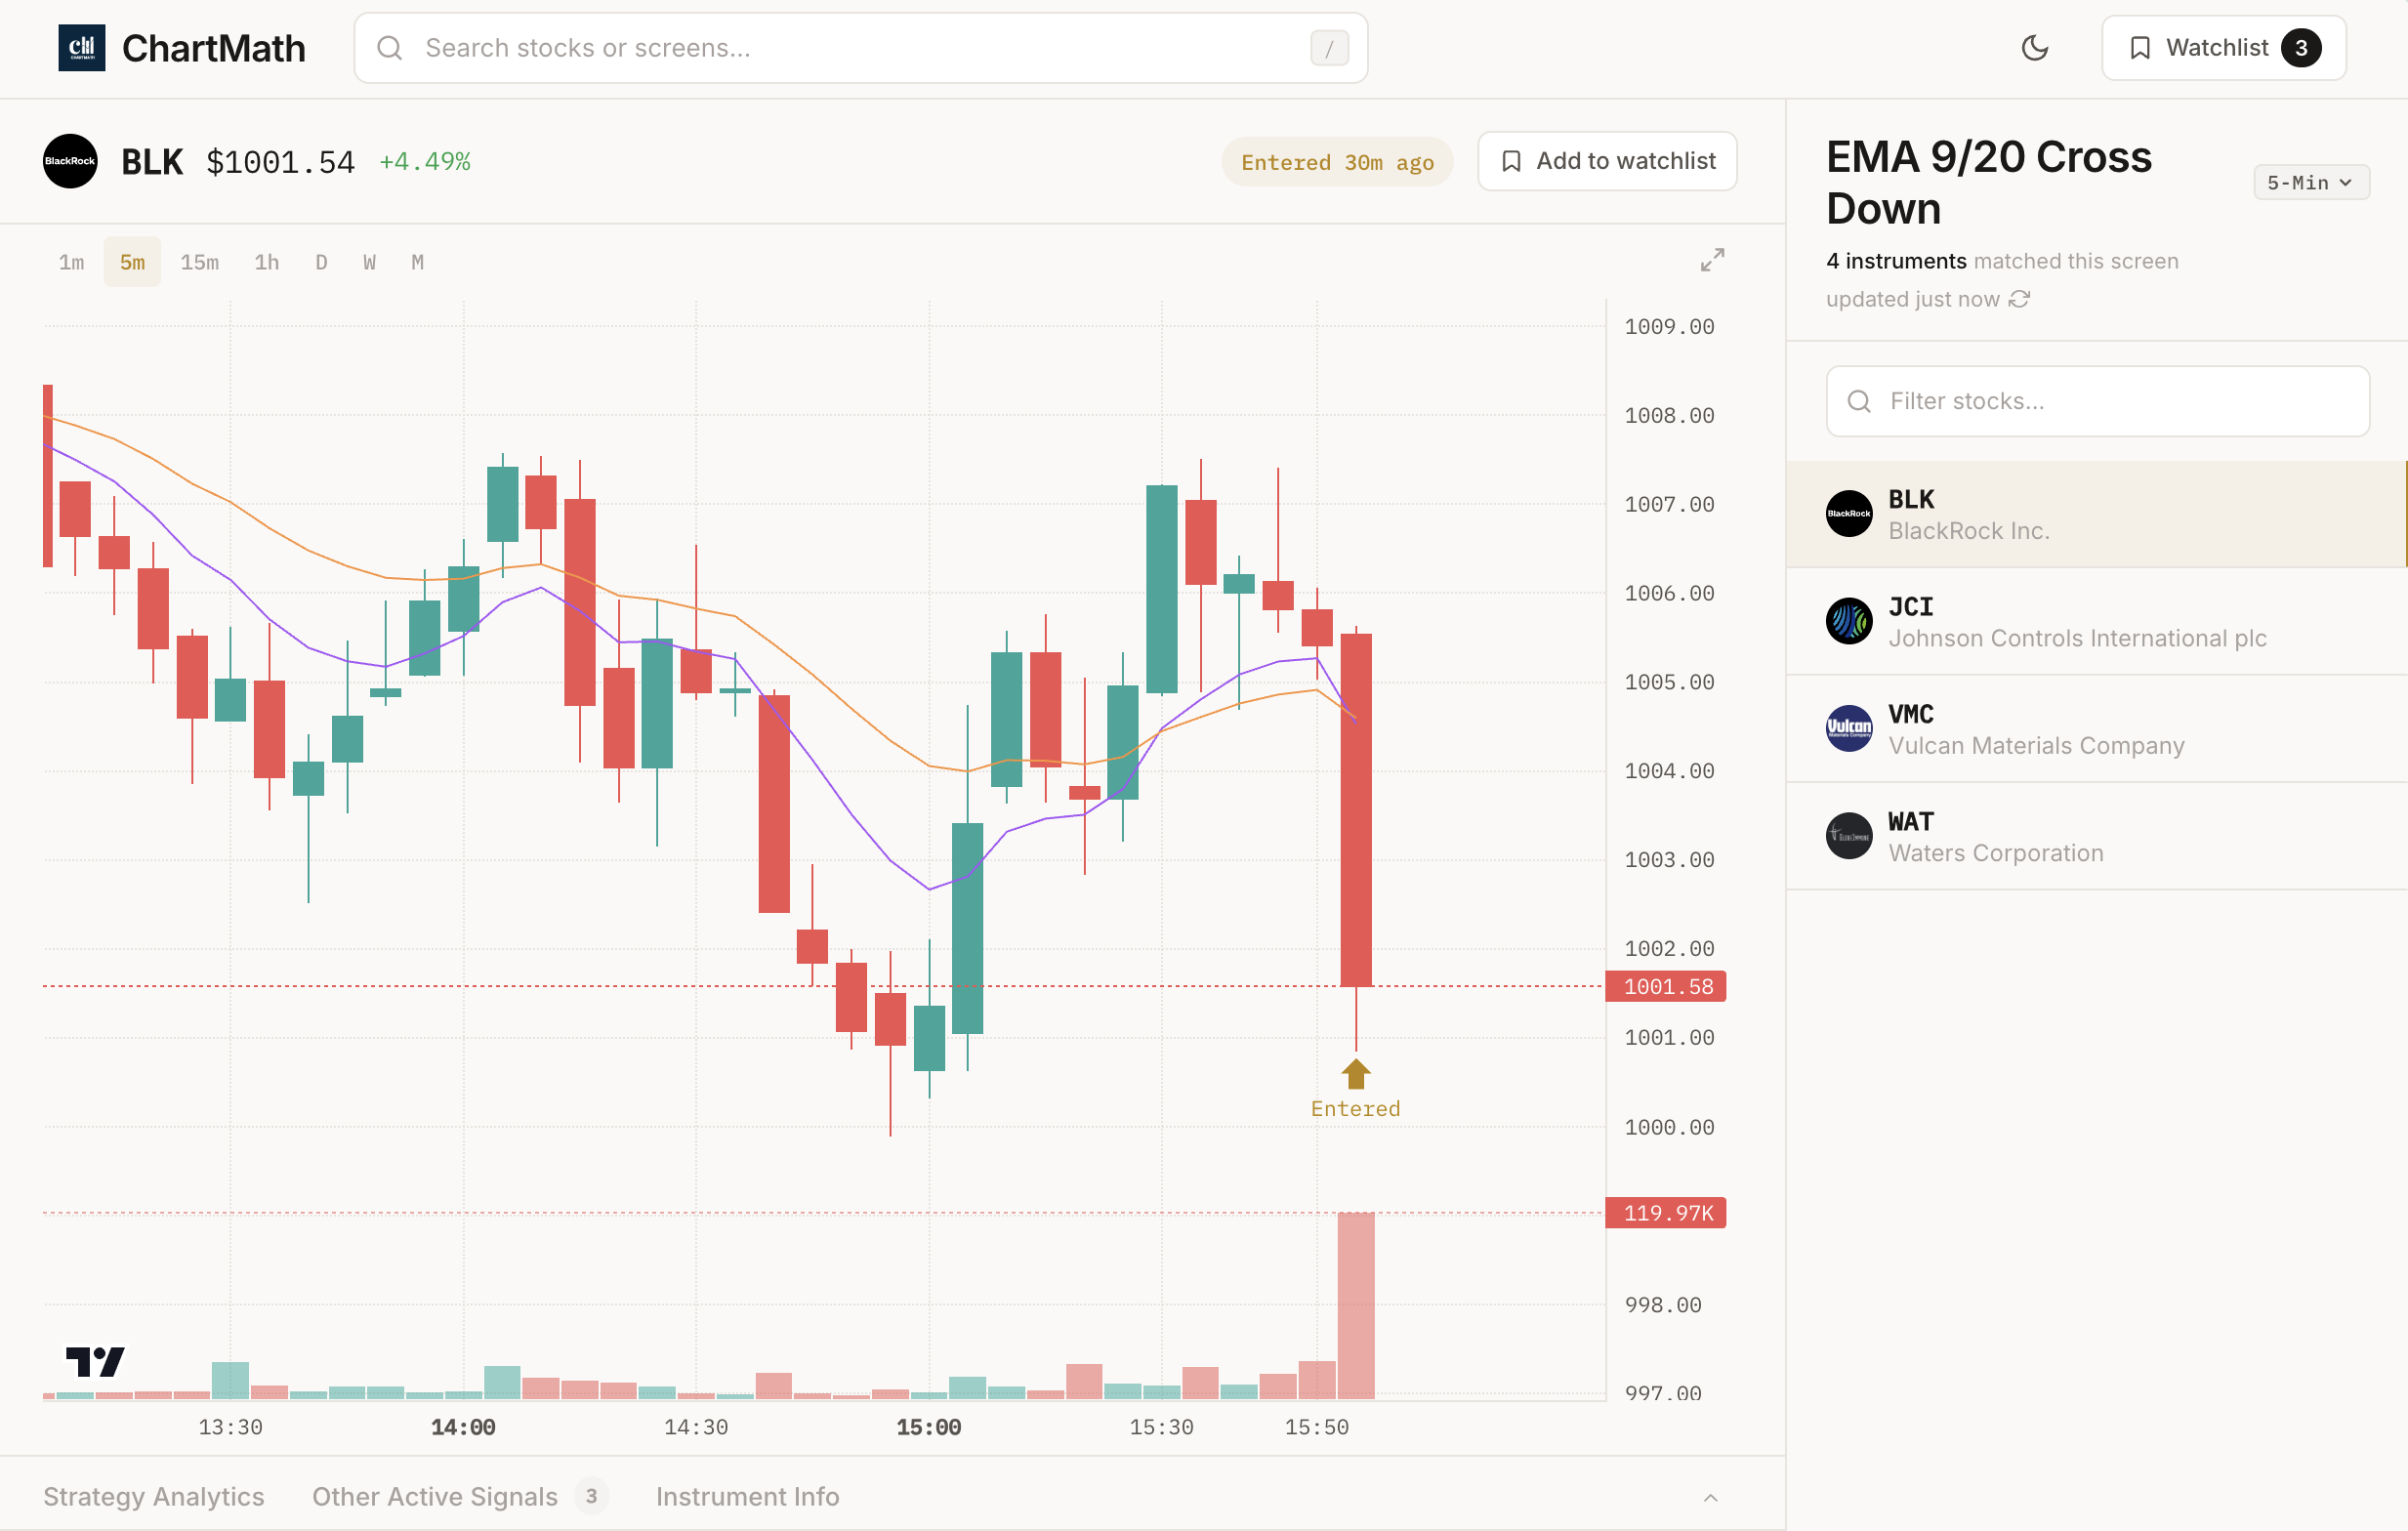
Benefits of Backtest Data Integration: This is where modern platforms separate themselves from basic screeners. Instead of just telling you "Stock XYZ broke above VWAP," advanced platforms show you the historical win rate, average return, and maximum drawdown for that specific setup. This allows you to make informed decisions about which alerts to act on and which to ignore.
Imagine getting an alert that says: "TSLA just triggered a 15-minute ORB long setup. Historical win rate: 68%. Average return: 1.8R. Last 10 signals: 7 winners, 3 losers." That's actionable intelligence, not just data noise. You can immediately assess whether the setup aligns with your risk tolerance and trading plan.
Alert Systems and Quality Filtering: Not all alerts are created equal, and alert fatigue is real. The best scanning platforms rank alerts by quality and freshness, showing you the highest-probability setups first. They also filter out low-quality signals based on volume, liquidity, and historical performance, so you're not drowning in notifications for penny stocks or illiquid names.
If you're serious about integrating automated alerts into your workflow, our guide on how to integrate trading alerts with your charting platform walks through the technical setup process step-by-step.
Mobile-First Solutions: The market doesn't stop when you're in a meeting or away from your desk. Mobile-first scanning platforms like ChartMath deliver push notifications to your phone the moment a setup triggers, complete with chart thumbnails and setup details. You can review the alert, check the chart, and execute the trade from your phone, all within 30 seconds of the signal.
This is particularly valuable for day traders who can't sit in front of screens all day, and for swing traders who want to monitor end-of-day setups without spending hours on manual analysis. The technology handles the scanning; you handle the decision-making and execution.
For a deeper dive into optimizing your scanning workflow, check out our article on how to use stock screeners for day trading in 2026, which covers advanced filtering techniques and workflow optimization.
Frequently Asked Questions About Technical Setups
What win rate should I expect from technical setups?
Most professional traders achieve win rates between 55% and 70% when trading proven technical setups with proper risk management. The exact win rate depends on the specific setup, market conditions, and your execution quality. Higher win rate setups (VWAP touches, support bounces) typically have smaller average returns, while lower win rate setups (gap and go, pocket pivots) often have larger average returns. The key metric is expected value (win rate × average win - loss rate × average loss), not win rate alone. A 60% win rate with 2:1 reward-risk ratio is far better than an 80% win rate with 1:2 reward-risk.
How many setups should I focus on as a beginner?
Start with 3-5 core setups that match your trading style and timeframe. Trying to trade all 15 setups simultaneously will overwhelm you and prevent you from developing true expertise in any single pattern. Master your core setups completely, understand their nuances, failure modes, and optimal market conditions, before adding more to your playbook. Most professional traders have 5-10 setups they trade repeatedly rather than trying to trade everything. Quality over quantity is the rule in trading.
Do technical setups work in all market conditions?
No, and this is critical to understand. Most technical setups perform best in trending markets with clear directional bias and underperform in choppy, range-bound conditions. Breakout setups (ORB, ascending triangles, bull flags) work well in bull markets but struggle in bear markets where overhead resistance is difficult to overcome. Reversal setups (RSI divergence, Fibonacci bounces) work well in ranging markets but generate false signals in strong trends. The best traders adjust their setup selection based on current market conditions rather than trading the same patterns regardless of environment.
How important is backtesting for setup validation?
Backtesting is absolutely critical. Without historical performance data, you're essentially gambling, hoping that a pattern will work without any statistical evidence. Backtesting shows you the actual win rate, average return, maximum drawdown, and optimal market conditions for each setup. This allows you to make informed decisions about position sizing, risk management, and which setups to trade. Modern platforms provide this backtest data automatically, but you should also backtest your own combinations and filters to develop a personalized edge. For a comprehensive guide to backtesting methodology, see our article on building winning backtesting strategies.
Can I combine fundamental and technical analysis?
Absolutely, and many successful traders do exactly this. Use fundamental analysis to build a watchlist of high-quality stocks with strong earnings, revenue growth, and sector tailwinds, then use technical setups to time your entries and exits. For example, you might identify a fundamentally strong growth stock, then wait for a pocket pivot or bull flag setup to enter rather than buying randomly. This approach combines the "what to buy" (fundamentals) with the "when to buy" (technicals), creating a more complete trading strategy. The key is not to let fundamental bias override technical signals, if the setup fails, exit regardless of how much you love the fundamentals.
Start Trading with Proven Technical Setups Today
You now have a comprehensive understanding of 15 proven technical setups that professional traders use daily to identify high-probability opportunities. From Opening Range Breakouts to Parabolic SAR flips, each setup provides specific entry criteria, exit strategies, and historical backtest data to guide your trading decisions.
But knowledge alone isn't enough. The real challenge is implementing these setups in real-time markets where opportunities appear and disappear in seconds. This is where the right tools make all the difference. Instead of manually scanning hundreds of charts and missing quality setups while you're away from your desk, modern scanning technology can automatically detect these patterns and alert you instantly.
ChartMath was built specifically to solve this problem. Our platform continuously scans the market across 200+ technical screens, instantly alerting you when stocks match proven setups like ORB, VWAP touches, RVOL spikes, and all the patterns we've covered in this guide. Every alert includes backtest data showing historical win rates and expected value, so you can make informed decisions about which trades to take.
Ready to stop missing quality technical setups and start trading with data-driven confidence? Watch a demo to see how ChartMath identifies high-probability setups in real-time, or download the app and start discovering your next trade opportunity. You can also access our web-based screener to start scanning immediately.
The setups are proven. The data is clear. The only question is: will you keep manually scanning charts and missing opportunities, or will you leverage technology to trade smarter? Your next winning trade is forming right now, make sure you don't miss it.

Ankush Jindal
LinkedInSee these setups live in ChartMath
200+ curated screens with backtest data. 14-day free trial.