Golden Cross Scanner: Desktop vs Mobile Trading Platforms 2026
You've set your alerts for the golden cross pattern on twelve different stocks. You're refreshing your desktop scanner every fifteen minutes. You step away for a meeting, and by the time you're back, three perfect setups have already moved 4% without you. Sound familiar?
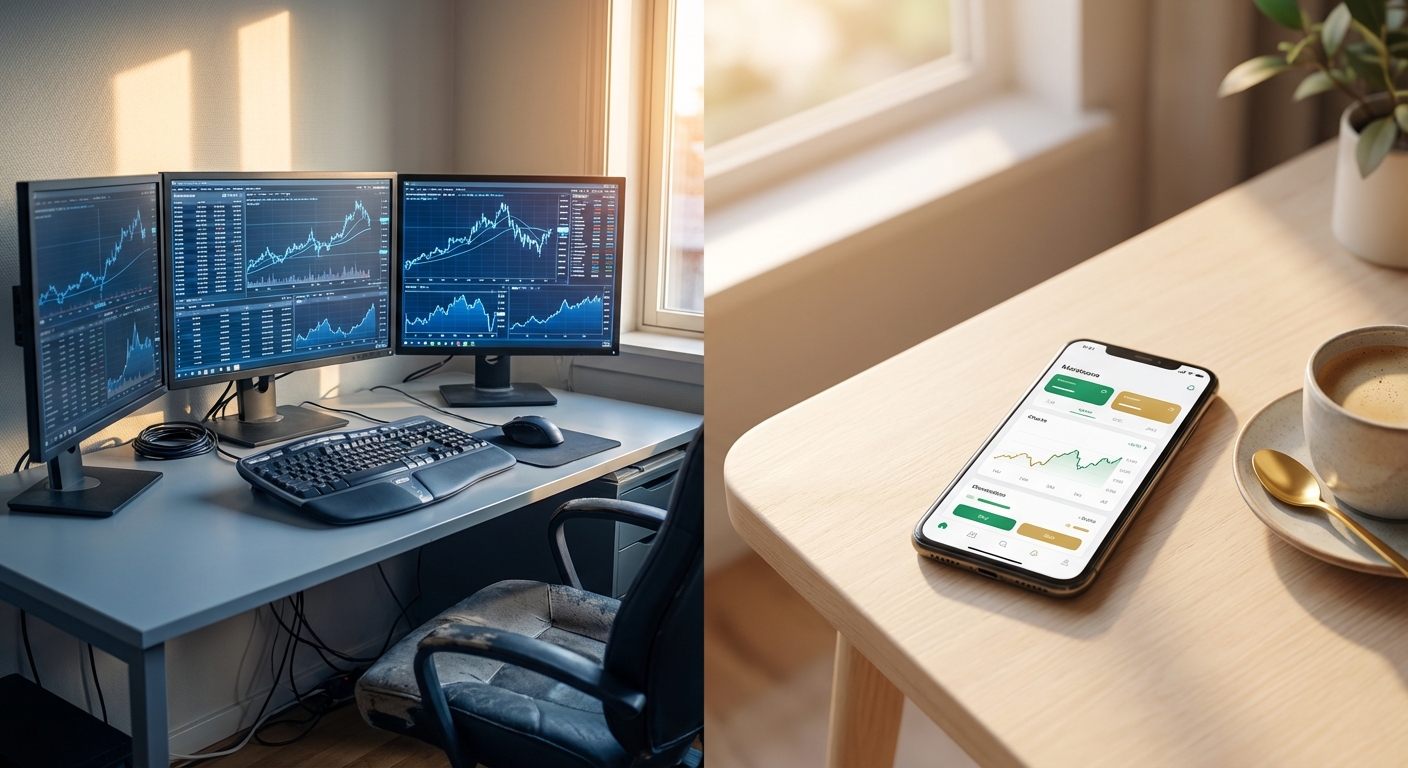
The golden cross scanner has become an essential tool for technical traders in 2026, but the platform you choose can make or break your ability to catch these high-probability setups. The debate isn't just about features anymore; it's about whether you need to be chained to your desk or if you can discover trades from anywhere.
This comprehensive comparison breaks down desktop-focused trading platforms versus mobile-first solutions, examining real-time scanning capabilities, alert systems, user interface design, pricing models, and accessibility. Whether you're a day trader executing scalps throughout the session or a swing trader with limited screen time, understanding which platform type fits your workflow will directly impact your trading results.
What Is a Golden Cross Scanner and Why Traders Need One
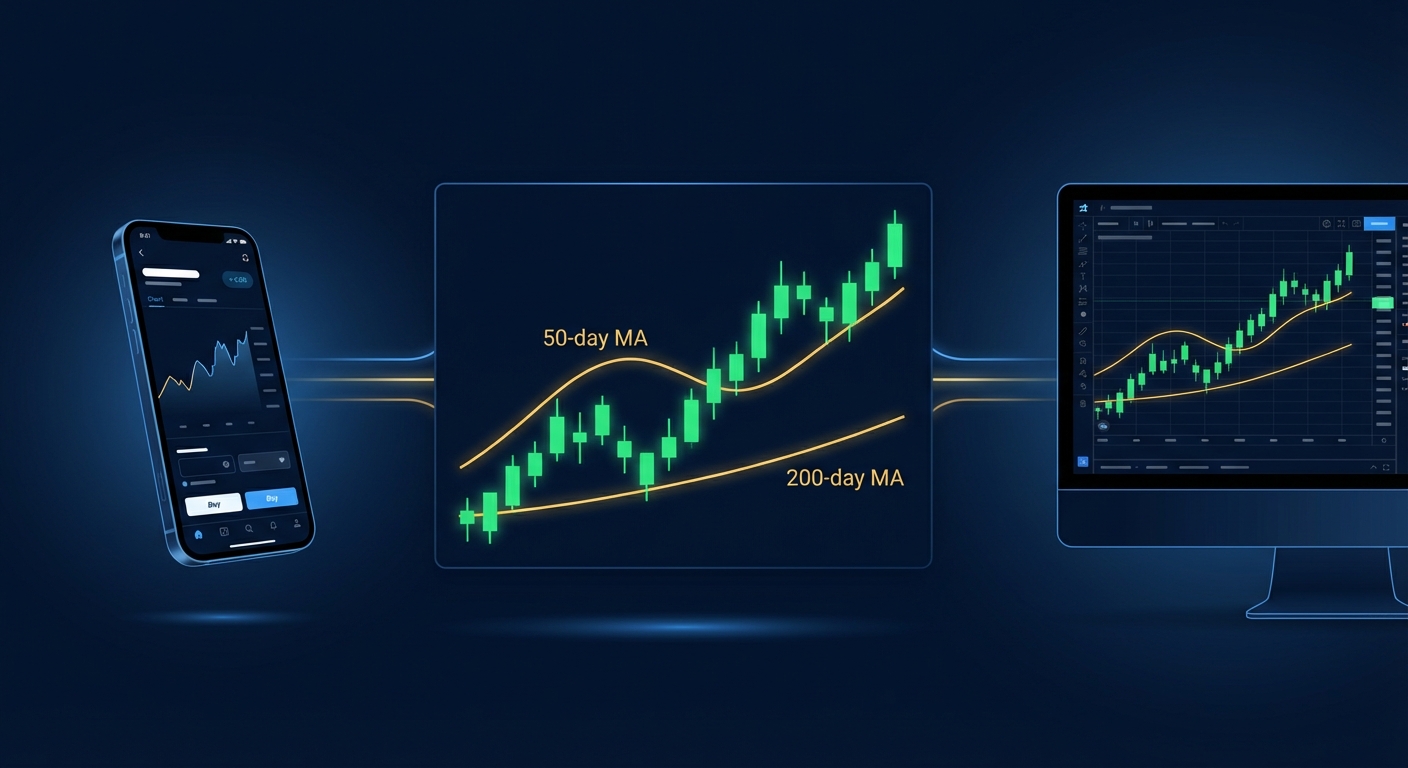
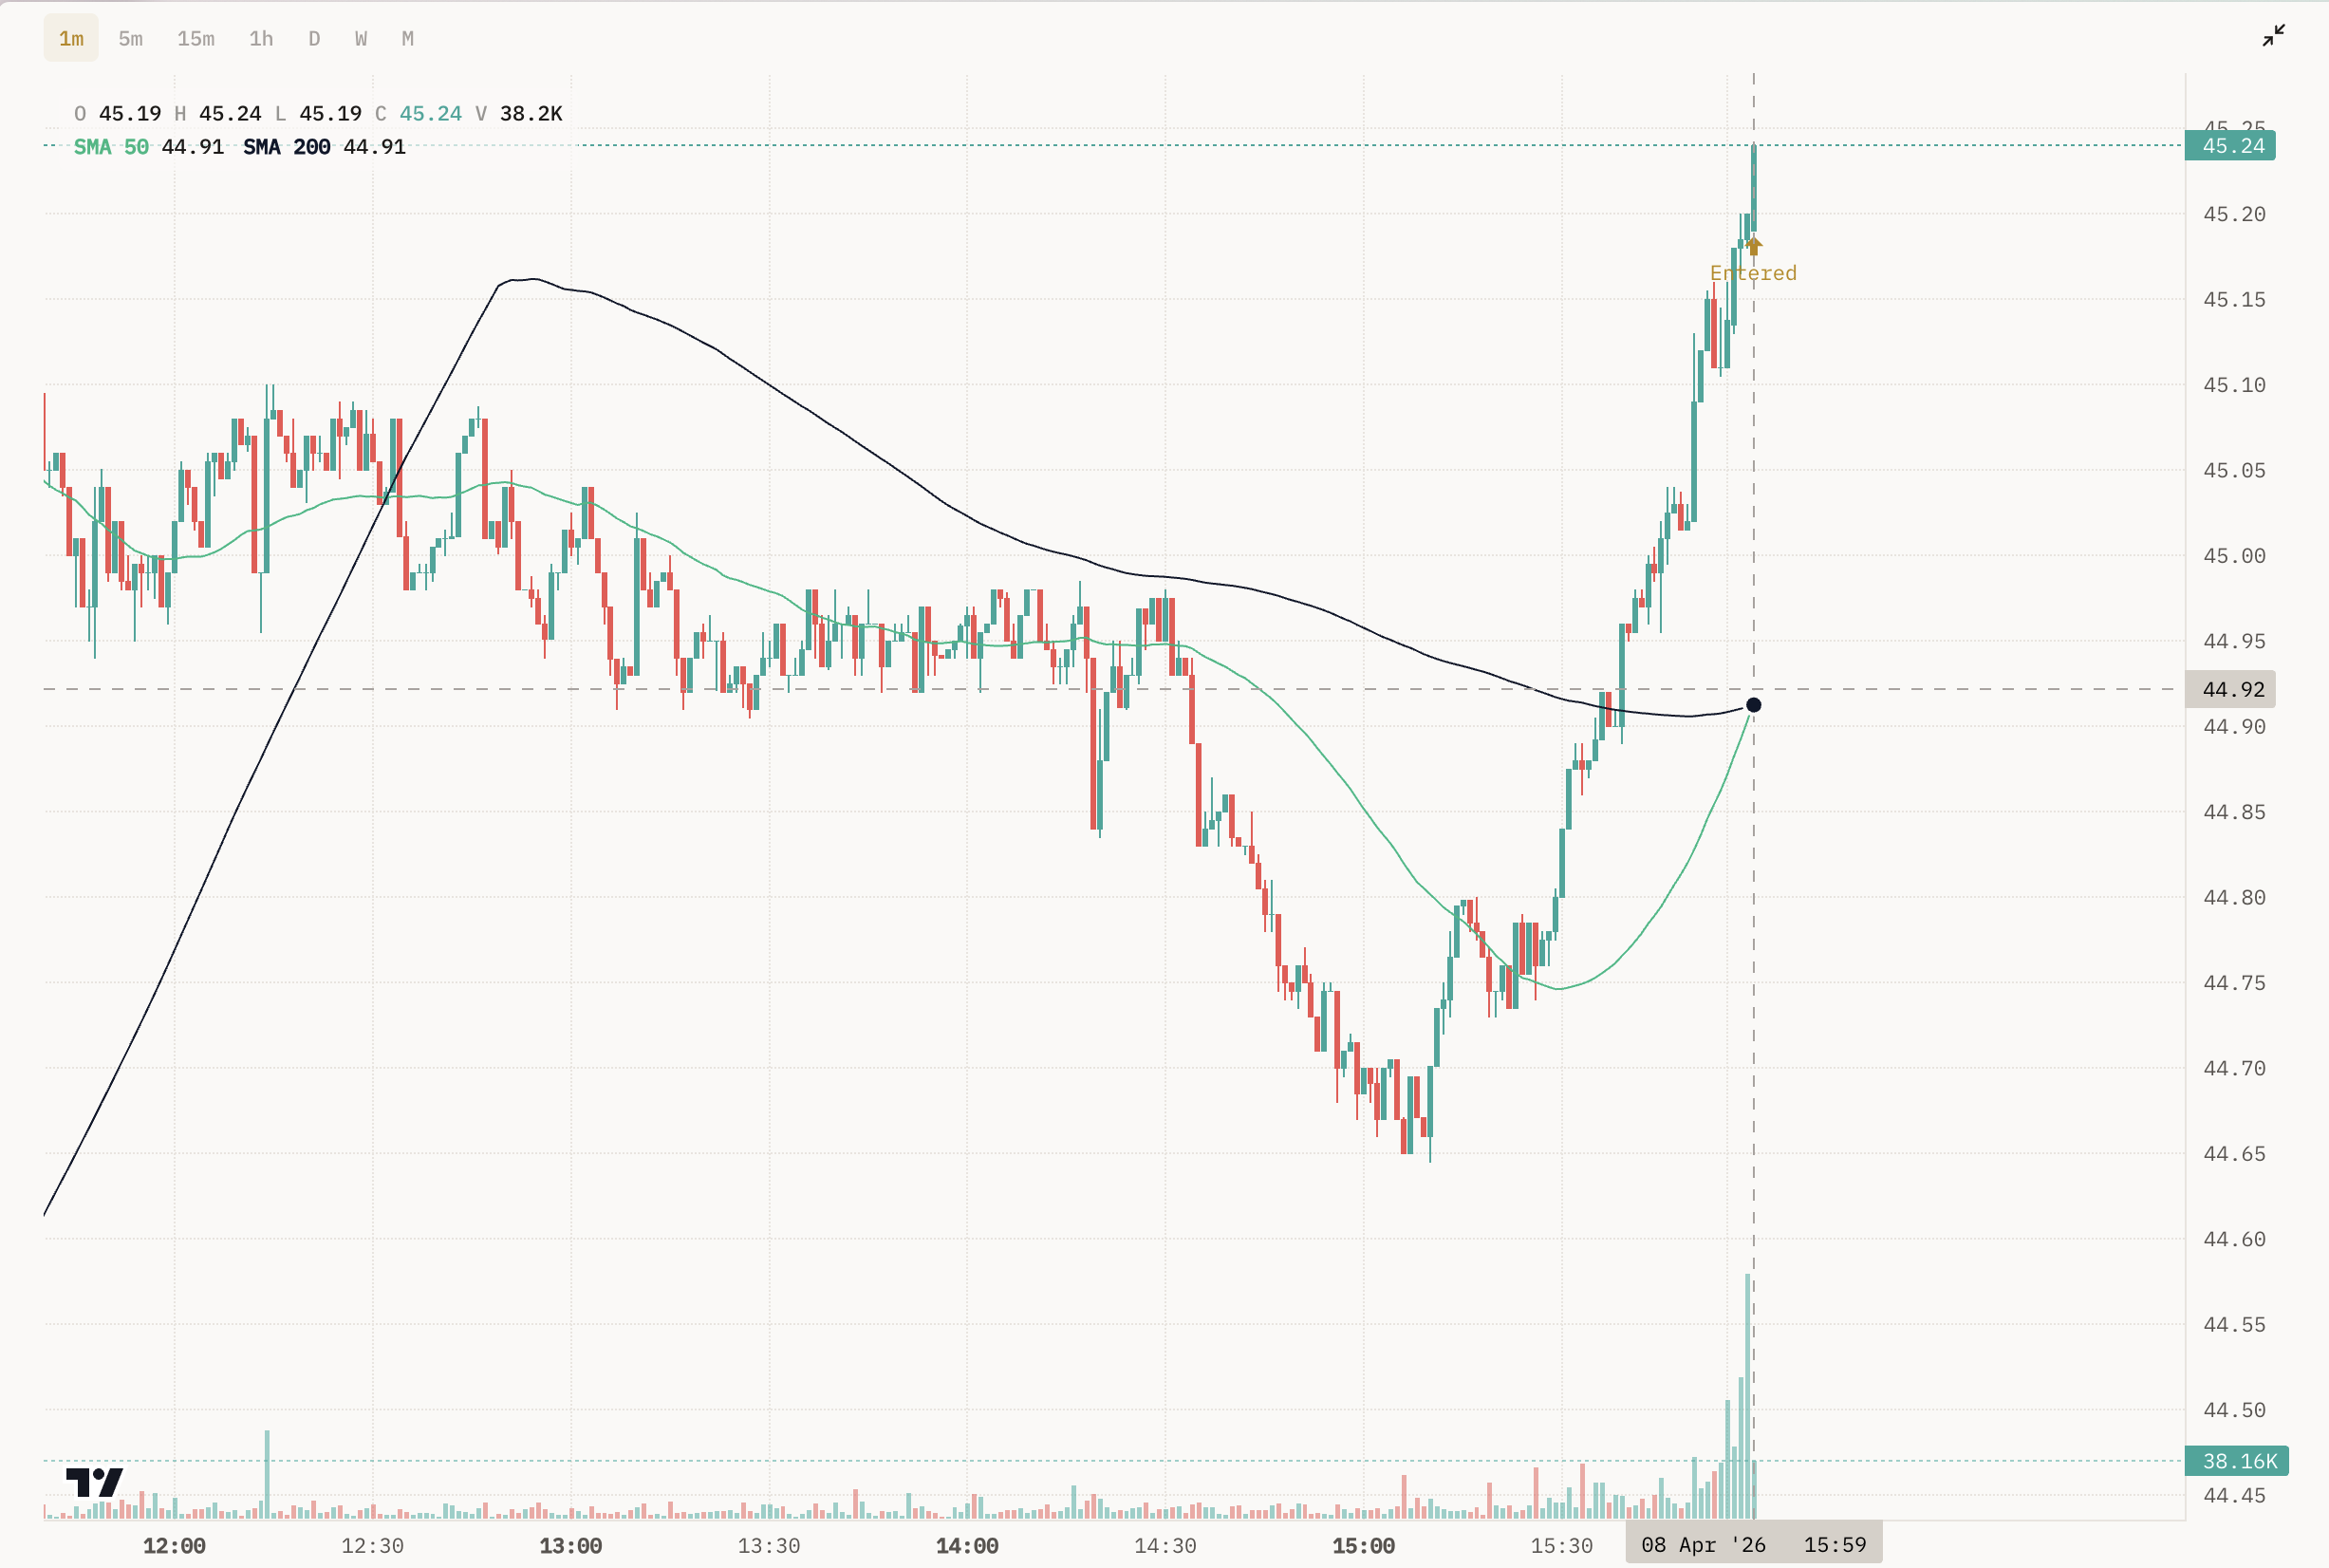
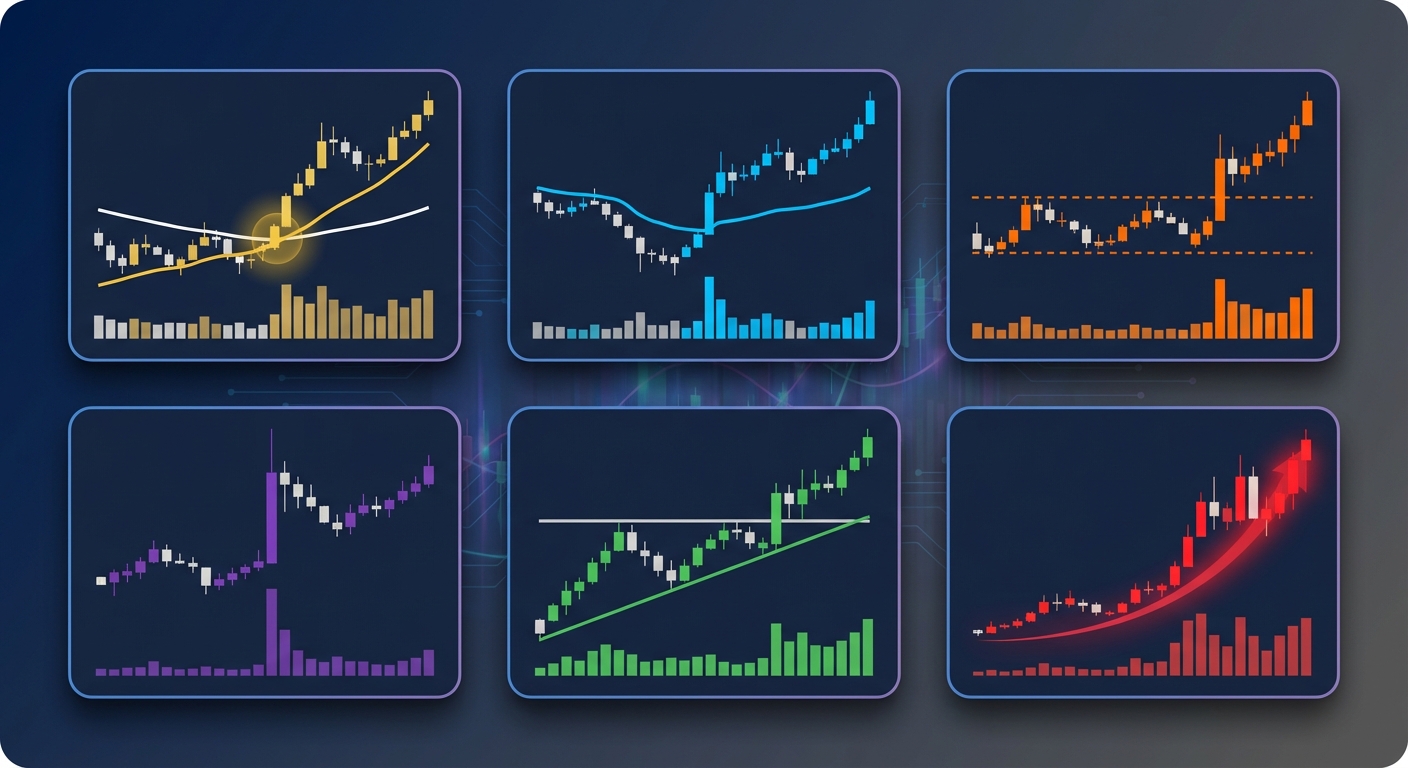
The golden cross is a bullish technical pattern that occurs when a shorter-term moving average (typically the 50-day) crosses above a longer-term moving average (usually the 200-day). This crossover signals a potential shift from bearish to bullish momentum and has historically preceded significant upward price movements in stocks, ETFs, and indices.
For active traders, manually scanning thousands of stocks for golden cross formations is inefficient and nearly impossible in real-time. A golden cross scanner automates this process by continuously monitoring the market and alerting you the moment a stock meets the criteria. This automation is critical because timing matters; by the time you manually discover a golden cross setup, institutional traders may have already positioned themselves.
Modern scanners go beyond simple detection. They provide context about why the setup matters, historical performance data showing how similar patterns have performed in the past, and multi-timeframe analysis to confirm the signal's strength. For day traders, this means catching intraday golden cross formations on 5-minute or 15-minute charts. For swing traders, it means identifying daily or weekly crossovers that could lead to multi-day or multi-week trends.
The challenge isn't finding a scanner; it's finding one that delivers quality signals without alert fatigue, provides transparent backtesting data, and fits seamlessly into your trading workflow. That's where the desktop versus mobile decision becomes critical.
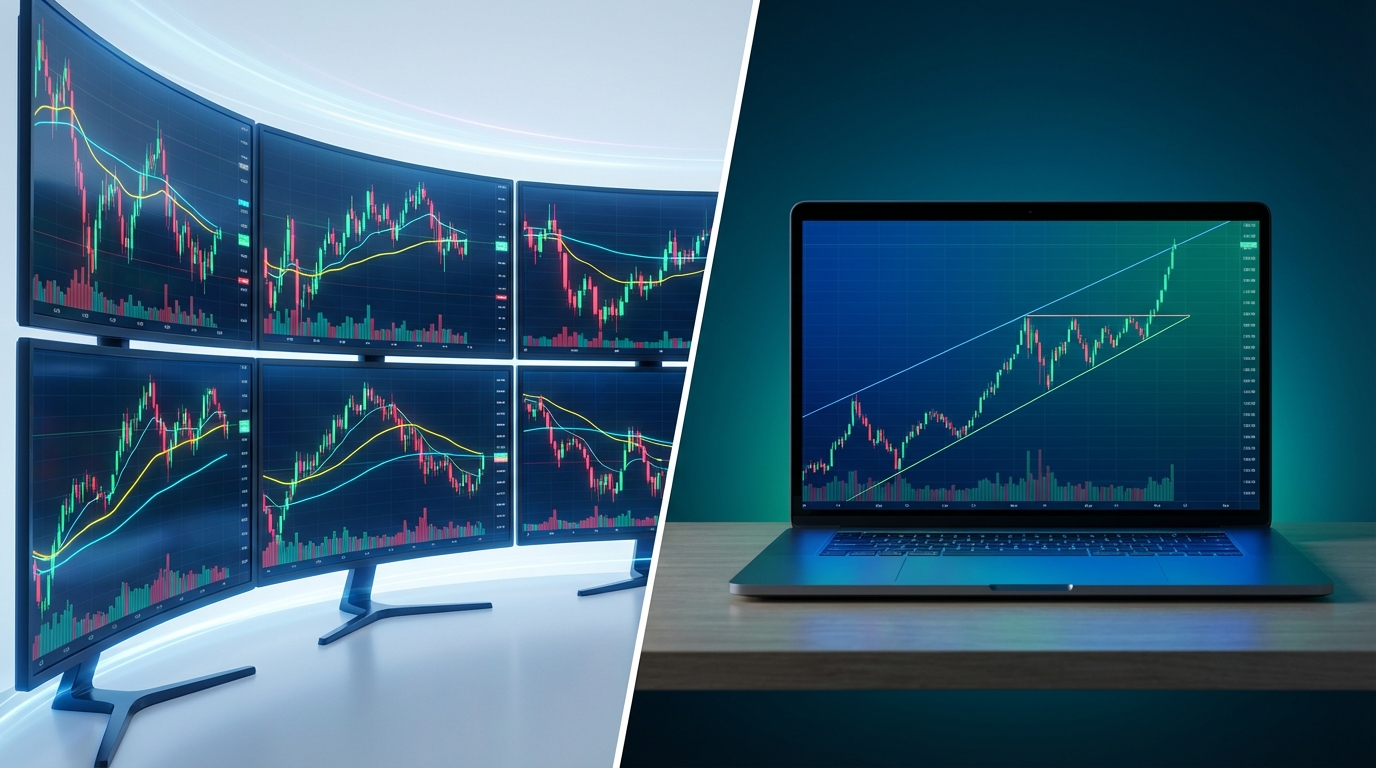
Desktop Trading Platforms: Power and Complexity
Desktop-focused trading platforms have dominated the market for decades, offering powerful scanning engines and deep customization options. Platforms like Trade Ideas, TC2000, and TradingView provide professional-grade tools that can scan thousands of stocks per second and execute complex multi-condition filters.
These platforms excel at customization. If you want to scan for a golden cross combined with RVOL above 2.0, price above VWAP, and volume exceeding 1 million shares, desktop platforms can handle it. Many offer proprietary scripting languages (like TradingView's Pine Script) that let you build custom indicators and automated strategies from scratch.
The trade-off? Complexity and accessibility. Desktop platforms typically require a learning curve that can take weeks or months to master. You need to understand technical analysis deeply enough to know which filters to combine, and in many cases, you need coding skills to build the exact scanner you want. Additionally, you're tied to your desk. If you're in a meeting, commuting, or away from your computer, you're relying on email or SMS alerts that often lack the context needed to make quick decisions.
Pricing for desktop platforms ranges from $25 to over $200 per month, with the most powerful scanning features often locked behind premium tiers. For professional traders who spend 6-8 hours per day at their desks, this investment makes sense. But for part-time traders or those who value mobility, the cost-benefit equation shifts.
Desktop Platform Features: What You Get
Desktop platforms deliver several advantages that appeal to serious technical traders:
Real-time scanning speed: Desktop software can process market data at institutional-grade speeds, scanning thousands of stocks across multiple timeframes simultaneously.
Advanced alert systems: Set complex multi-condition alerts with customizable notification methods (desktop pop-ups, email, SMS, audio alerts).
Backtesting capabilities: Many desktop platforms include backtesting engines where you can test your golden cross scanner strategy against historical data, though you often need to build the backtest yourself.
Brokerage integration: Some platforms integrate directly with your broker, allowing you to execute trades without switching applications.
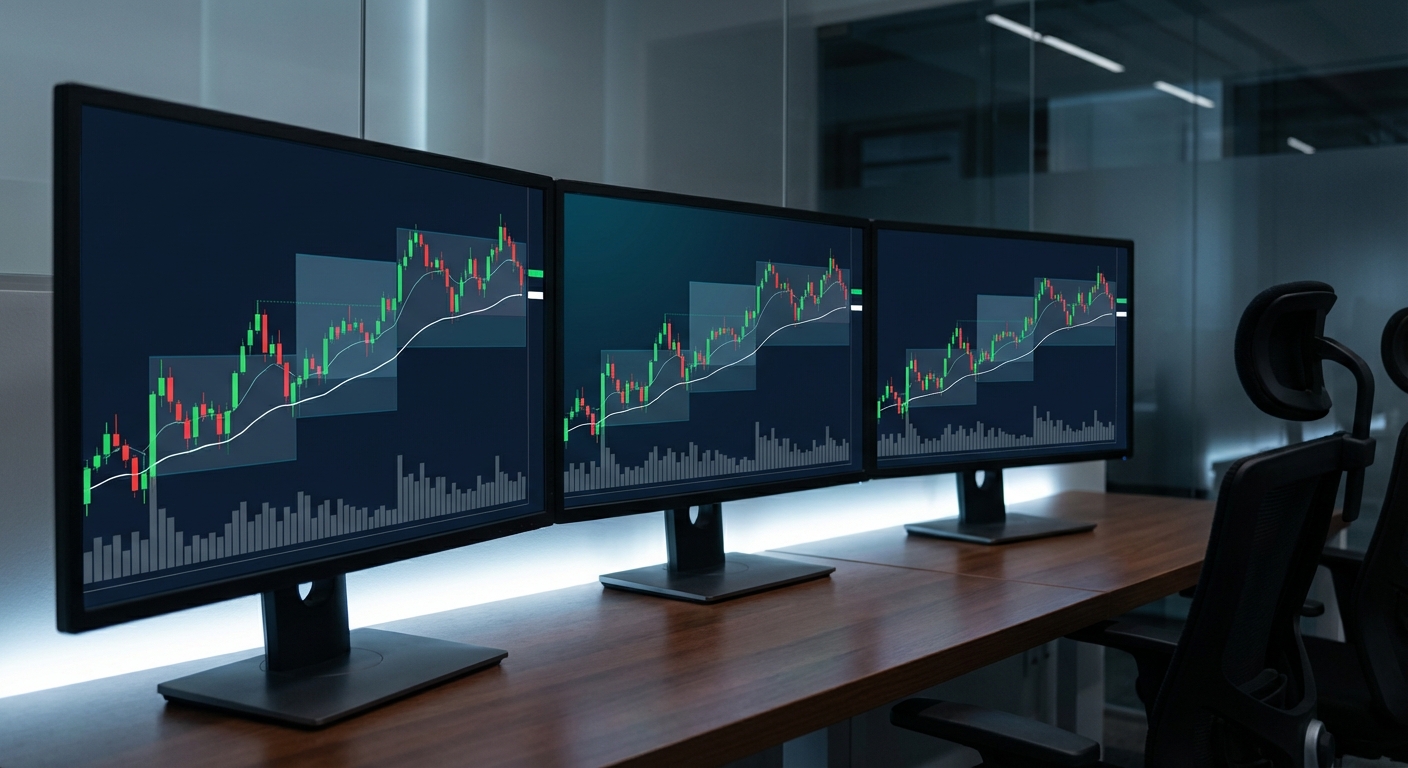
Multi-monitor support: Spread your charts, scanners, watchlists, and news feeds across multiple screens for maximum information density.
Workspace customization: Save multiple workspace layouts optimized for different trading strategies or market conditions.
For traders who have the time to learn these systems and the discipline to stay at their desks during market hours, desktop platforms offer unmatched power. The question is whether that power is necessary for your specific trading style, or if it's overkill that creates more complexity than value.
Mobile-First Trading Platforms: Accessibility Meets Intelligence
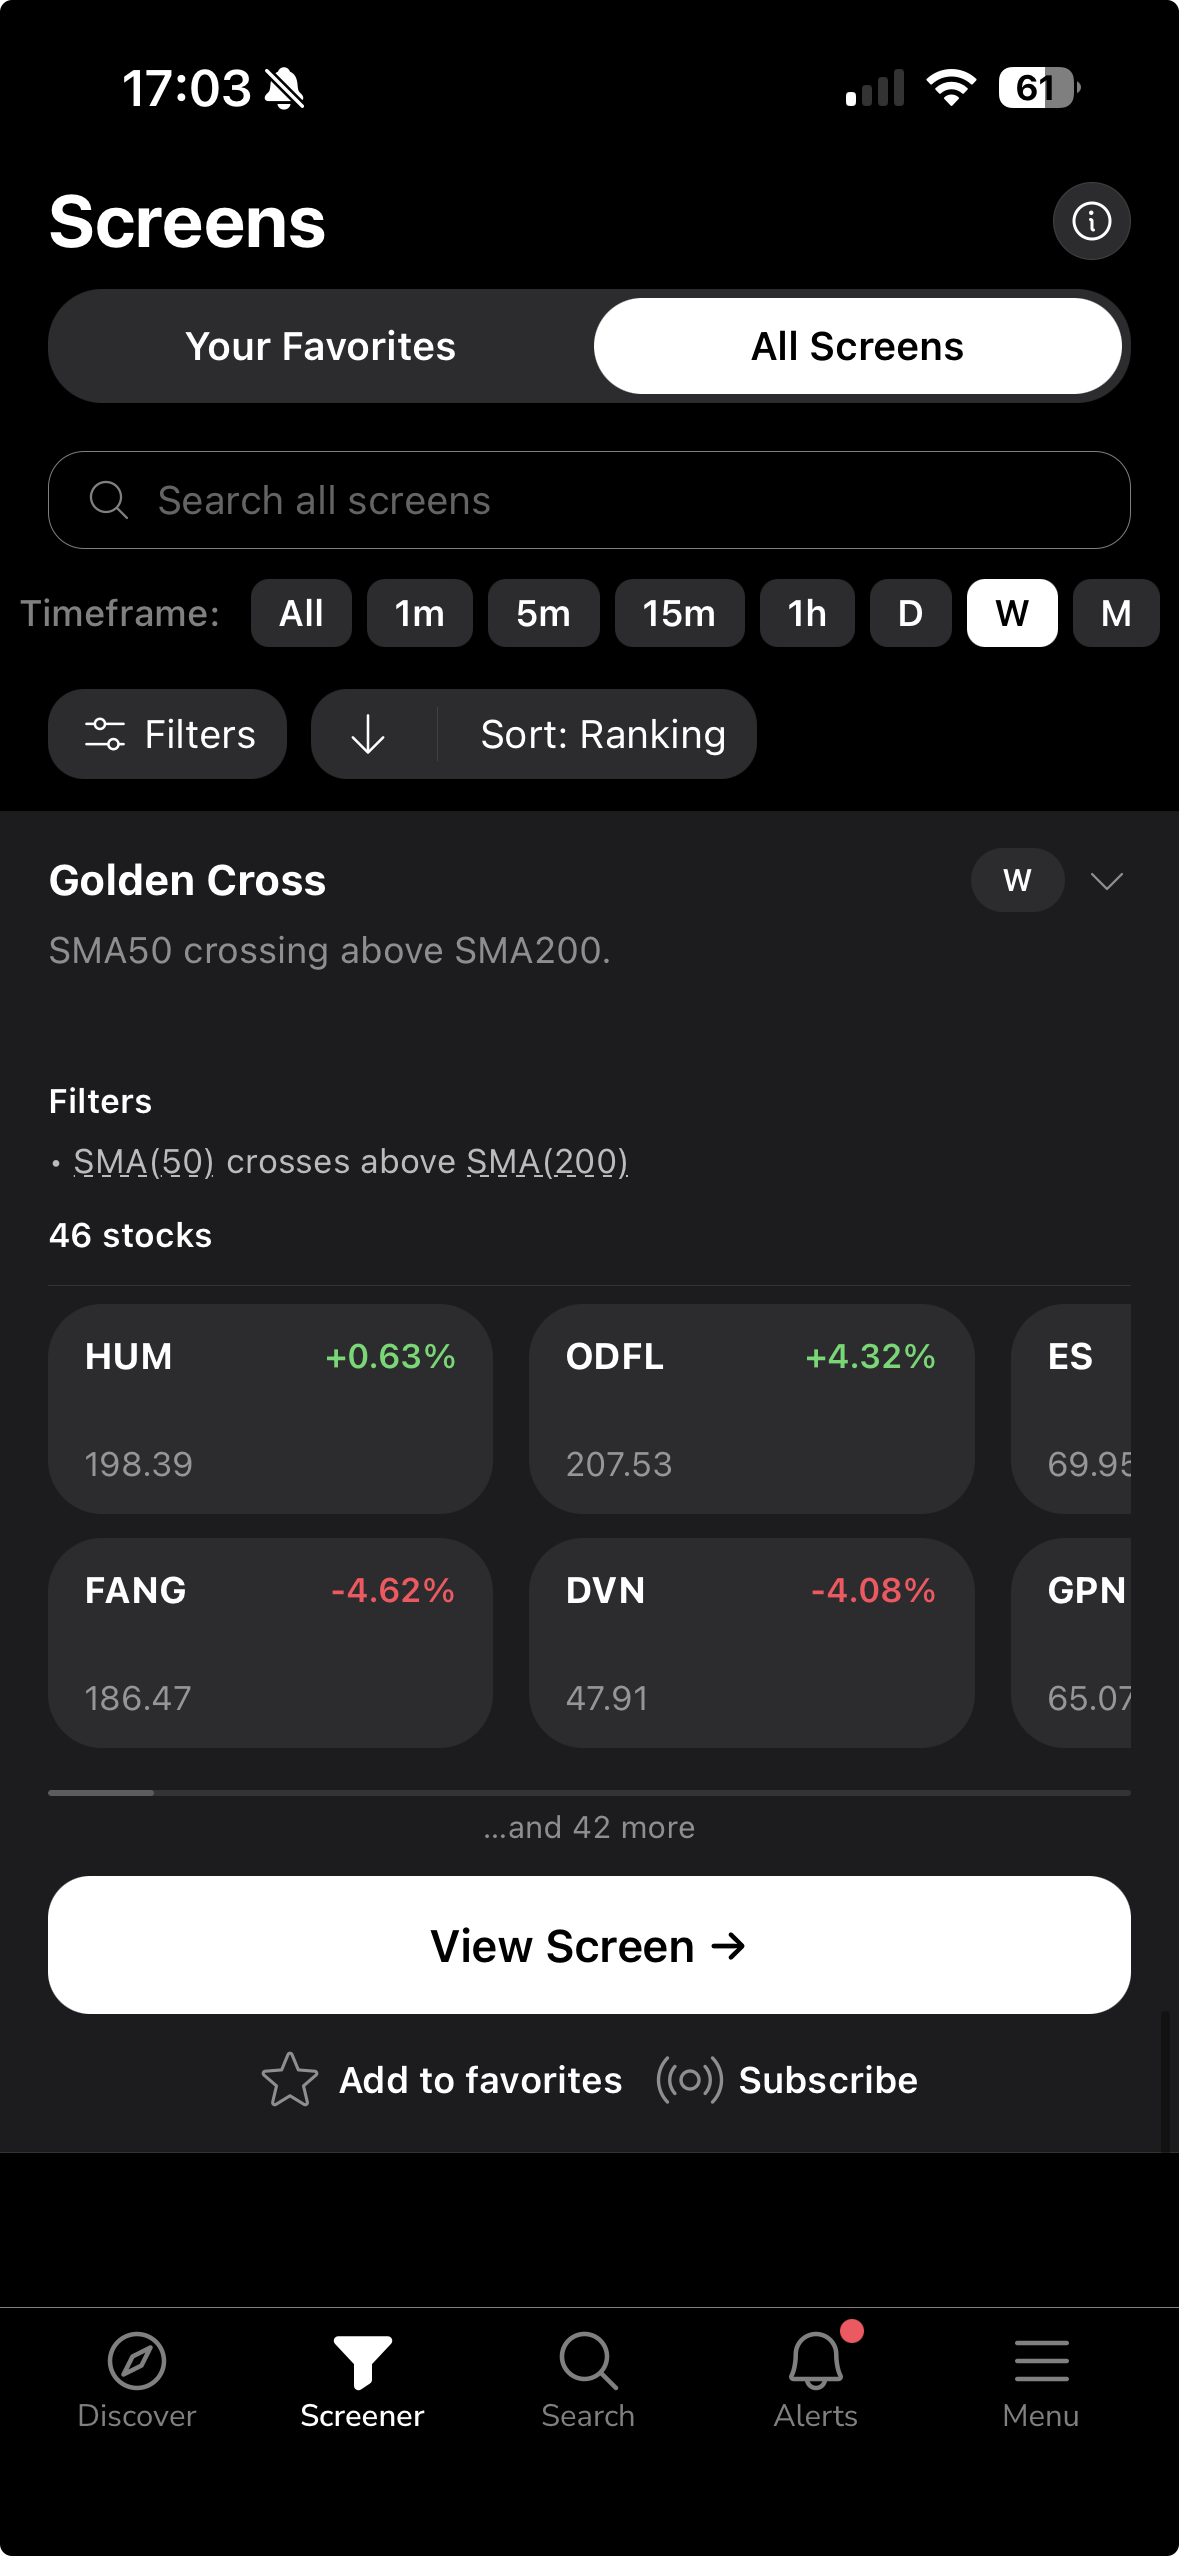
The rise of mobile-first trading platforms represents a fundamental shift in how traders discover and act on opportunities. Rather than forcing you to sit at a desk refreshing scanners, these platforms bring golden cross scanner functionality directly to your phone with real-time push notifications and curated, pre-built screens.
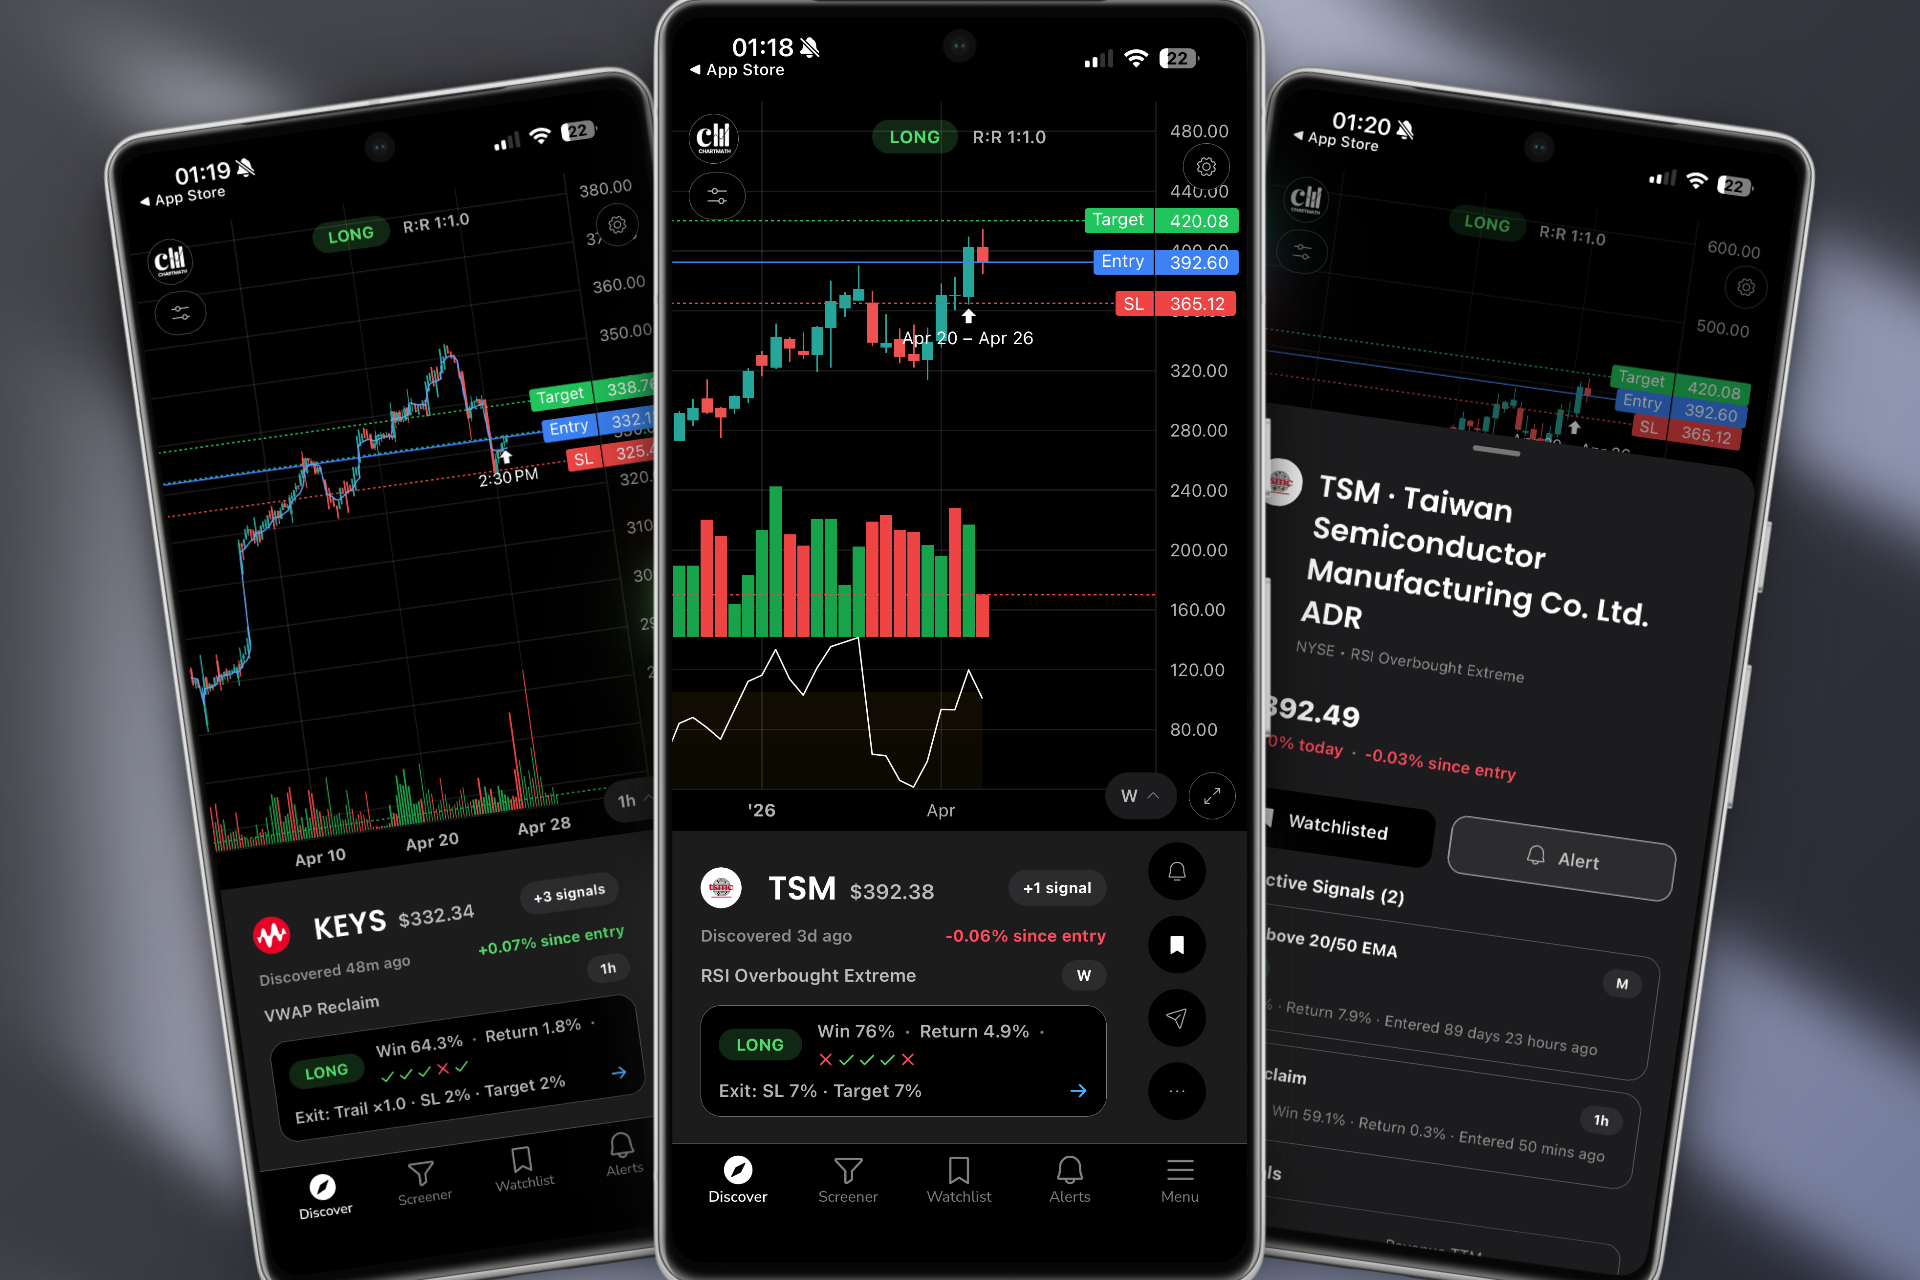
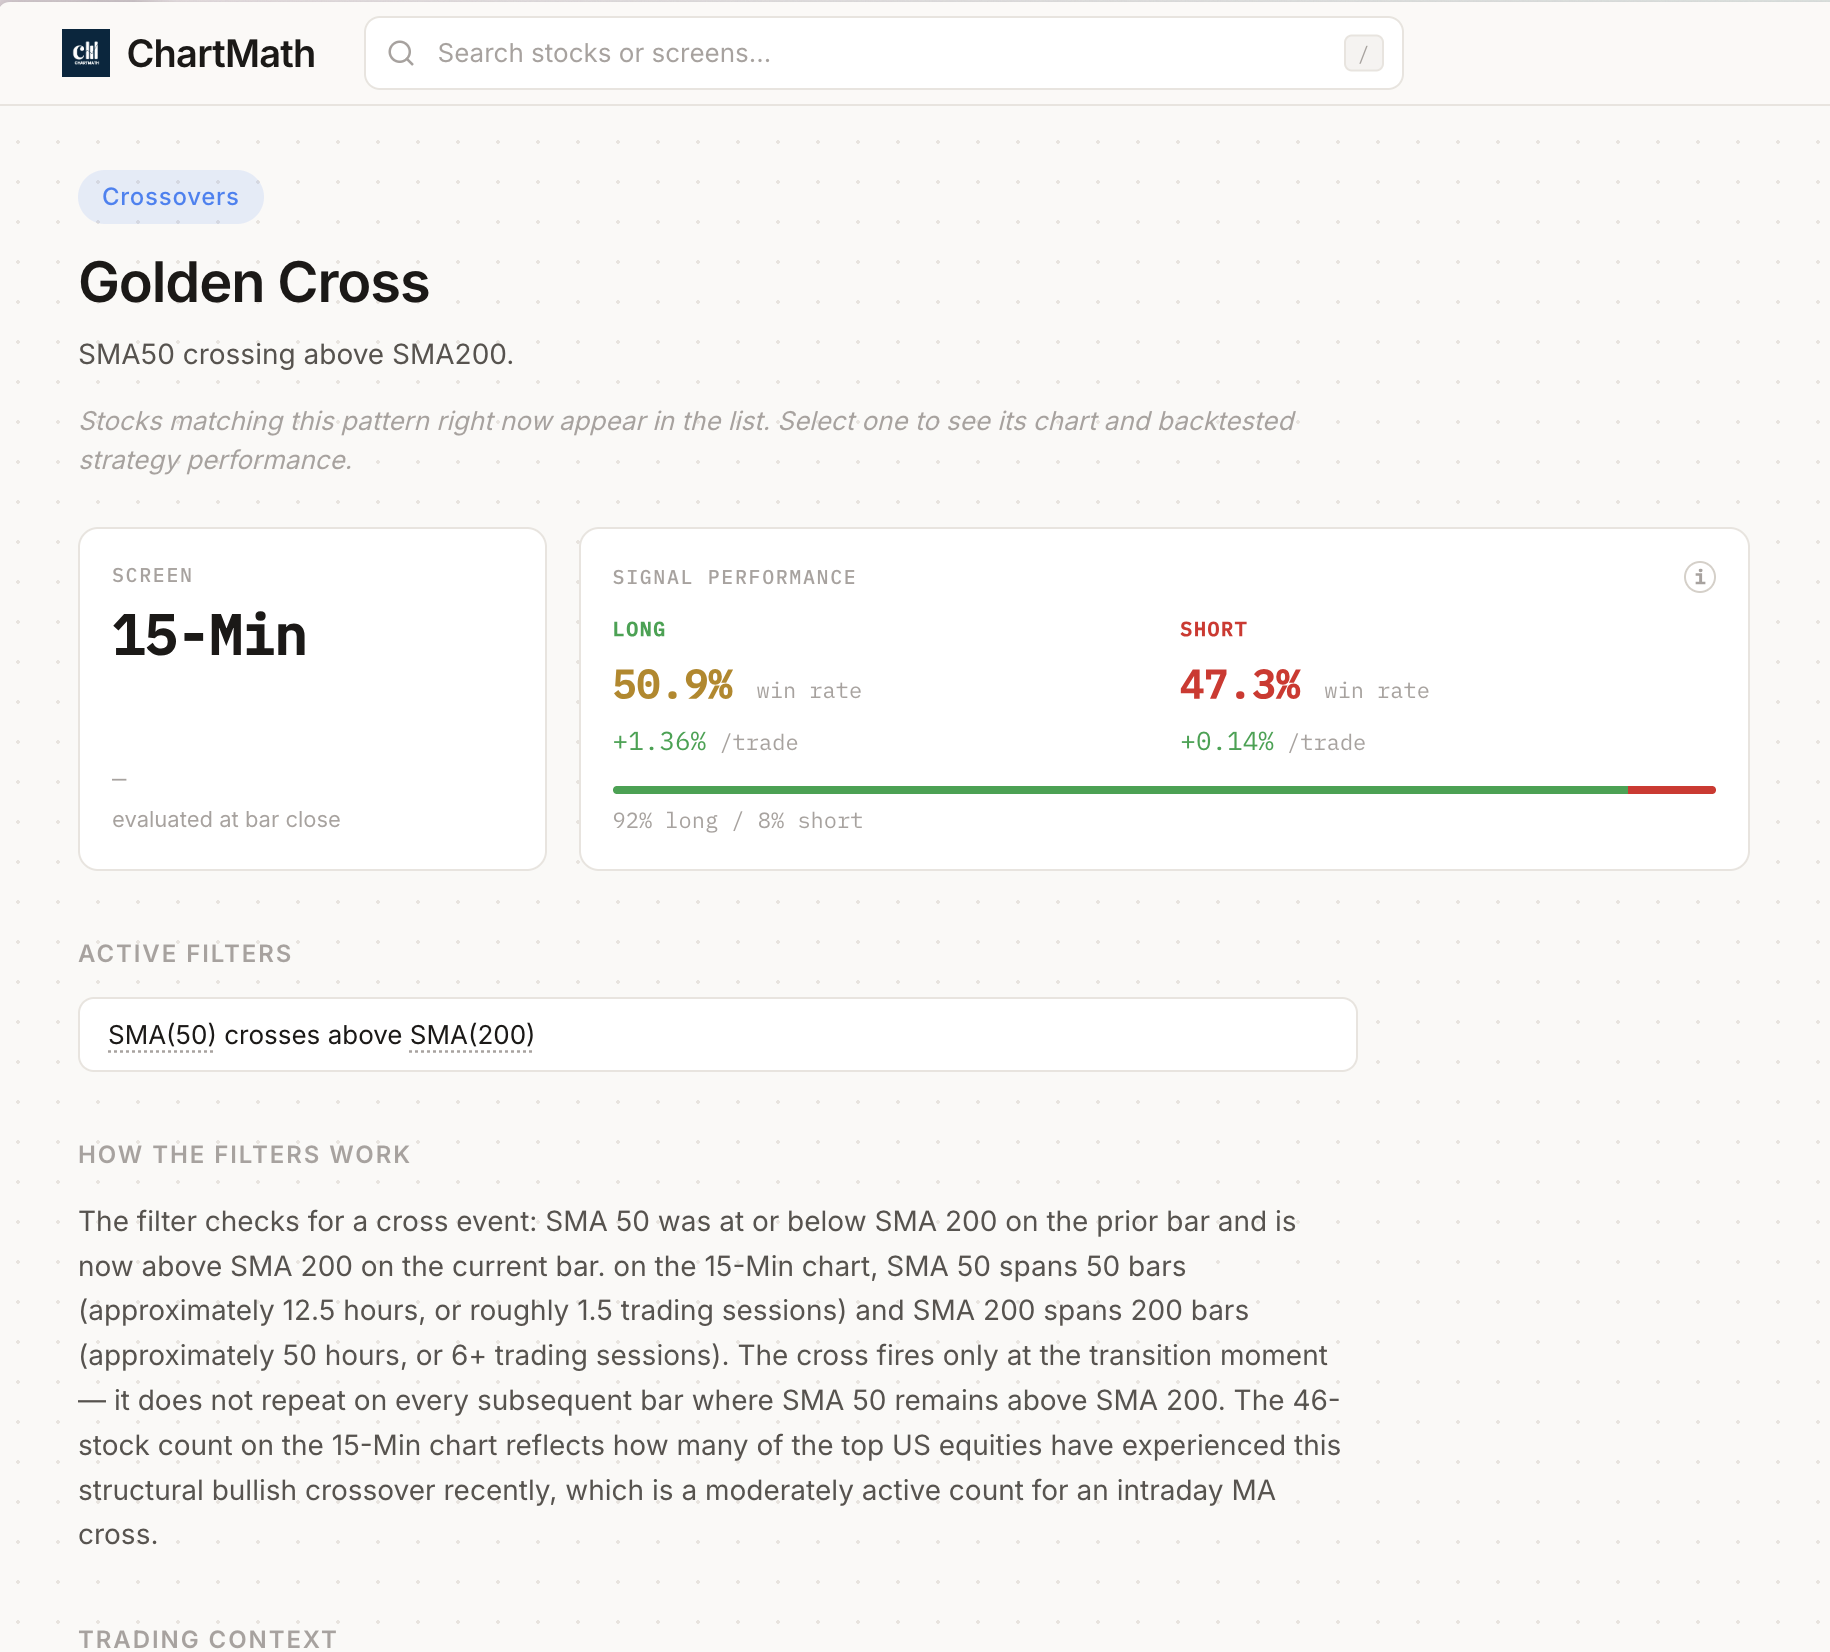
Platforms like ChartMath exemplify this approach. Instead of requiring you to learn Pine Script or build custom scans from scratch, mobile-first platforms provide 200+ pre-built technical screens that include golden cross patterns, VWAP reclaims, opening range breakouts, RVOL spikes, and momentum indicators. Each screen comes with transparent backtesting data showing historical win rates, average returns, and sample sizes, so you know exactly what edge you're trading.
The user experience is fundamentally different. Rather than staring at endless lists of ticker symbols, mobile-first platforms often use swipe-based discovery interfaces (similar to TikTok or Instagram) that rank setups by quality and freshness. You swipe through the highest-probability opportunities, see plain-English explanations of why each setup triggered, and add stocks to your watchlist with a single tap.
This approach solves three critical pain points that desktop platforms struggle with:
- Missing trades while away from your desk: Push notifications deliver golden cross alerts instantly, whether you're in a meeting, at the gym, or commuting.
- Alert fatigue: Instead of receiving 50 alerts per day with no context, mobile platforms filter for quality and provide explanations of why each setup matters.
- Time efficiency: Swing traders with only 30 minutes per day to analyze the market can quickly swipe through curated setups instead of manually building and running scans.
Mobile-first doesn't mean mobile-only. These platforms are designed to complement your existing charting software. You discover the setup on your phone, then execute the trade on your preferred platform (whether that's TradingView, Thinkorswim, or your broker's app). This workflow integration is explored in detail in our guide on how to integrate trading alerts with your charting platform.
Mobile Platform Features: Trading From Anywhere
Mobile-first platforms prioritize different features than their desktop counterparts:
- Real-time scanning without being desk-bound: The scanning engine runs in the cloud, continuously monitoring the market and pushing alerts to your phone the moment setups form.
- Alert quality and context: Each notification includes not just the ticker and pattern name, but a plain-English explanation of why the setup triggered and what the historical edge has been.
- Backtesting transparency: See actual performance metrics (win rate, average return per trade, maximum drawdown) for every screen, not just theoretical backtests you have to build yourself.
- Free tiers: Many mobile platforms offer free versions with limited screens or delayed data, letting you test the platform before committing to a subscription.
- Integration with existing tools: Mobile platforms don't try to replace your charting software; they enhance it by delivering curated opportunities you can then analyze on your preferred platform.
- Time efficiency: Designed for traders who have limited time to scan the market, with interfaces optimized for quick decision-making.
The mobile-first approach isn't about dumbing down trading; it's about democratizing access to institutional-grade scanning without requiring a computer science degree or eight hours per day at a desk. For traders who want to catch breakout trading opportunities in real-time while maintaining flexibility in their schedule, this model makes sense.
Head-to-Head Comparison: Desktop vs Mobile Golden Cross Scanner Platforms
Let's break down the key differences across the factors that matter most to active traders:
Scanning Speed and Real-Time Capabilities: Both desktop and mobile platforms can deliver real-time scanning in 2026. Desktop platforms process data locally on your machine, while mobile platforms run scanning engines in the cloud and push results to your device. In practice, the speed difference is negligible for most traders. What matters more is accessibility; desktop scans only help you if you're at your desk when they trigger.
Alert Systems: Desktop platforms typically deliver alerts via desktop notifications, email, or SMS. Mobile platforms use push notifications that appear instantly on your lock screen with rich context. The mobile advantage here is significant; you can act on a golden cross alert within seconds, even if you're nowhere near a computer. Desktop alerts often arrive as plain text without charts or context, requiring you to return to your desk to evaluate the setup.
User Experience: Desktop platforms prioritize information density and customization. You can see dozens of data points simultaneously across multiple monitors. Mobile platforms prioritize simplicity and speed, showing you the most important information first with the ability to drill down for details. Desktop is better for deep analysis; mobile is better for quick discovery and decision-making. For many traders, the ideal workflow combines both: discover on mobile, analyze on desktop.
Pricing Models: Desktop platforms typically range from $25 to $200+ per month, with the most powerful features in higher tiers. Mobile-first platforms often offer free tiers with limited functionality and premium tiers from $20 to $60 per month. The total cost of ownership matters; if you need a desktop platform plus a TradingView subscription to build custom alerts, you could be paying $150+ per month. Mobile platforms with pre-built screens eliminate the need for multiple subscriptions.
Accessibility: This is where mobile platforms have a decisive advantage. Desktop platforms require you to be at your computer during market hours. If you have a day job, family commitments, or simply don't want to be desk-bound for 6.5 hours per day, desktop-only solutions create a fundamental constraint. Mobile platforms let you monitor the market from anywhere, making them ideal for part-time traders and busy professionals.
Learning Curve: Desktop platforms often require weeks or months to master, especially if you're building custom scans or learning scripting languages. Mobile platforms with pre-built screens can be productive within minutes. If you're a technical trading beginner, the mobile approach lets you learn what works before investing time in learning how to build it. Our guide to using stock screeners for day trading covers this learning curve in detail.
Backtesting: Desktop platforms give you the tools to backtest your own strategies, but you have to build the backtest, interpret the results, and validate the data yourself. Mobile platforms like ChartMath provide pre-built backtesting data for every screen, showing you exactly how the golden cross scanner strategy has performed historically across different exit strategies and timeframes. This transparency saves hundreds of hours and helps you avoid strategies that look good in theory but fail in practice.
Best Use Cases: Desktop platforms excel for full-time professional traders who need maximum customization, trade from a dedicated workspace, and have the technical skills to build complex multi-condition scans. Mobile platforms excel for part-time traders, swing traders with limited daily screen time, technical beginners learning proven setups, and anyone who values the ability to monitor the market while maintaining a flexible schedule.
Which Platform Type Is Right for Your Trading Style?
The right choice depends on your specific trading style, time availability, technical skill level, and budget:
Day Traders: If you're executing scalps and momentum plays throughout the trading session, you need real-time alerts and multi-timeframe analysis. Desktop platforms offer the information density and speed needed for rapid decision-making if you're at your desk. But if you're a part-time day trader who can't watch screens all day, a mobile-first platform with push notifications ensures you don't miss high-probability setups. Many successful day traders use both: mobile for discovery and alerts, desktop for execution and detailed analysis.
Swing Traders: If you're holding positions for multiple days and have limited time to analyze charts (typically 30 minutes per day), mobile-first platforms are often the better choice. You can review end-of-day golden cross scanner results during your commute, add setups to your watchlist, and receive alerts when your favorite stocks trigger new patterns. The pre-built screens save time compared to manually building scans every evening. Our swing trading guide for busy professionals shows how to build this workflow.
Technical Beginners: If you're learning technical analysis and don't yet know which indicators work best together, mobile platforms with pre-built, backtested screens provide a massive advantage. You can see which setups have the highest win rates and learn why they work through plain-English explanations, rather than spending months learning Pine Script only to discover your custom scan doesn't have an edge. Desktop platforms are powerful, but they assume you already know what you're looking for.
Professional Traders: If trading is your full-time job and you have the budget for premium tools, desktop platforms offer the customization and advanced features that justify the higher cost. You can build proprietary scans that give you an edge other traders don't have, integrate directly with your broker for one-click execution, and leverage multiple monitors for maximum efficiency. The learning curve is an investment that pays off over time.
Part-Time Traders: If you have a day job or other commitments that prevent you from watching screens all day, mobile-first platforms are essential. Push notifications ensure you don't miss golden cross setups while you're in meetings or focused on other work. The ability to quickly review curated setups during breaks or lunch makes trading viable even with limited time. Desktop platforms are less practical if you can't be at your desk during market hours.
The decision framework is simple: How much time do you have, where do you spend that time, and what's your technical skill level? If you're desk-bound with advanced skills and a large budget, desktop wins. If you're mobile, time-constrained, or learning, mobile-first platforms deliver better results with less friction.
Beyond the Golden Cross: What Else Should Your Scanner Detect?
While the golden cross scanner is a valuable tool, relying on a single pattern limits your trading opportunities. The best platforms scan for multiple complementary setups that work across different market conditions and timeframes.
VWAP (Volume-Weighted Average Price): VWAP reclaims and rejections are critical intraday setups for day traders. When a stock crosses above VWAP with increasing volume, it often signals institutional buying and can lead to sustained moves. Platforms that scan for both golden cross patterns and VWAP setups give you more opportunities throughout the day. Our comparison of VWAP vs RVOL vs ORB indicators explains how these setups complement each other.
ORB (Opening Range Breakout): The first 5, 15, or 30 minutes of the trading session often establish a range. When price breaks above or below this range with volume, it can signal the direction for the rest of the day. Combining ORB scans with golden cross patterns helps you catch both intraday momentum and longer-term trend changes.
RVOL (Relative Volume): Volume spikes indicate institutional interest and can precede significant price moves. Scanning for stocks with RVOL above 2.0 or 3.0 helps you find stocks that are "in play" before they make major moves. When a golden cross occurs on a stock with elevated RVOL, the setup becomes even more compelling.
Breakout Patterns: Ascending triangles, bull flags, cup-and-handle patterns, and other chart formations often precede explosive moves. Platforms that scan for these patterns in addition to moving average crossovers give you a more complete picture of market opportunities.
Momentum Indicators: RSI divergences, MACD crossovers, and momentum oscillators help confirm the strength of a golden cross signal. A golden cross combined with bullish RSI divergence is a higher-probability setup than a golden cross alone.
ChartMath's approach of providing 200+ pre-built screens across all these categories means you're not limited to a single pattern. You can discover golden cross setups in the morning, VWAP reclaims during the lunch session, and end-of-day breakouts for swing positions, all from a single platform. This comprehensive approach is detailed in our momentum trading software buyer's guide.
The value of multi-pattern scanning is simple: more high-probability setups mean more trading opportunities. Markets don't always cooperate with your favorite pattern. Having a platform that scans for dozens of proven setups ensures you always have trades to evaluate, regardless of market conditions.
Making the Switch: How to Transition Between Platform Types
You don't have to choose one platform type exclusively. Many successful traders use mobile platforms as companions to desktop charting, creating a workflow that combines the strengths of both approaches.
Here's how to integrate mobile and desktop platforms effectively:
Use mobile for discovery, desktop for execution: Let your mobile golden cross scanner alert you to new setups throughout the day. When an alert triggers, open your desktop charting platform to analyze the setup in detail, check multiple timeframes, and execute the trade with your preferred broker integration.
Test platforms with free tiers: Most mobile-first platforms offer free versions with limited screens or delayed data. Test the platform for a week or two to see if the alerts are high-quality and the interface fits your workflow before committing to a paid subscription. This reduces the risk of paying for a tool you won't use.
Export watchlists between platforms: Build your watchlist on your mobile platform based on curated setups, then export the ticker list to your desktop platform for detailed analysis. This saves time compared to manually scanning for setups on desktop.
Build an efficient multi-platform workflow: Define clear roles for each tool in your stack. For example: mobile platform for real-time alerts and discovery, TradingView for charting and technical analysis, broker platform for execution. This division of labor prevents overlap and maximizes efficiency. Our guide on building an efficient trading workflow provides a detailed framework.
Start with mobile, add desktop as needed: If you're new to technical trading, start with a mobile platform that provides pre-built, backtested screens. Learn which setups work for your style and risk tolerance. Once you've developed a consistent edge, consider adding a desktop platform for more advanced analysis and customization. This progressive approach prevents overwhelm and keeps costs low while you're learning.
The key insight is that mobile and desktop platforms serve different purposes. Mobile excels at discovery and accessibility; desktop excels at analysis and execution. Using both creates a complete trading system that works whether you're at your desk or on the go.
The Future of Golden Cross Scanner Technology in 2026 and Beyond
The trading technology landscape is evolving rapidly, and several trends are reshaping how traders discover and act on golden cross patterns and other technical setups:
AI-Powered Pattern Recognition: Machine learning algorithms are getting better at identifying complex patterns that human traders might miss. However, the best platforms balance AI capabilities with transparency, showing you why the AI flagged a setup rather than just presenting a black-box score. Traders want to understand the edge, not just trust an algorithm blindly.
Mobile-First Platform Growth: As more traders demand flexibility and work-life balance, mobile-first platforms are gaining market share. The days of being chained to a desk for 6.5 hours per day are ending for many traders. Platforms that deliver institutional-grade scanning to your phone are becoming the norm, not the exception.
Transparency in Backtesting: Traders are demanding more transparency about how strategies have performed historically. Platforms that show actual win rates, average returns, sample sizes, and maximum drawdowns for every screen are gaining trust. The era of "trust me, this works" is over; traders want data.
Integration of Fundamental and Technical Screening: The best platforms are starting to combine technical patterns like the golden cross with fundamental filters (earnings growth, revenue trends, institutional ownership). This hybrid approach helps traders find stocks with both technical momentum and fundamental strength.
The Shift from Coding-Required to Curated Screens: While advanced traders will always want the ability to build custom scans, the majority of traders benefit more from pre-built, backtested screens created by experienced technical analysts. This democratization of trading technology means you don't need to be a programmer to access institutional-grade tools.
The future of golden cross scanner technology is clear: more accessible, more transparent, and more mobile. Platforms that embrace these trends will thrive; those that cling to desktop-only, coding-required models will struggle to compete.
If you're ready to experience the next generation of technical trading tools, ChartMath delivers 200+ pre-built screens with transparent backtesting data, real-time push alerts, and a mobile-first interface designed for traders who refuse to miss opportunities while away from their desks. Whether you're scanning for golden cross patterns, VWAP reclaims, opening range breakouts, or momentum plays, you'll discover high-probability setups ranked by quality and freshness.
Stop refreshing desktop scanners and missing trades while you're in meetings. Watch a demo to see how mobile-first scanning works, or download the app and start discovering setups in minutes. For traders who prefer web-based access, the web-based screener delivers the same curated screens and backtested performance data from any browser.
The golden cross scanner you choose determines whether you catch the setup or watch it move without you. Choose a platform that fits your life, not one that forces you to change your life to fit the platform.

Ankush Jindal
LinkedInSee these setups live in ChartMath
200+ curated screens with backtest data. 14-day free trial.