How Traders Use Trade Discovery Tools to Find 10+ Setups Daily
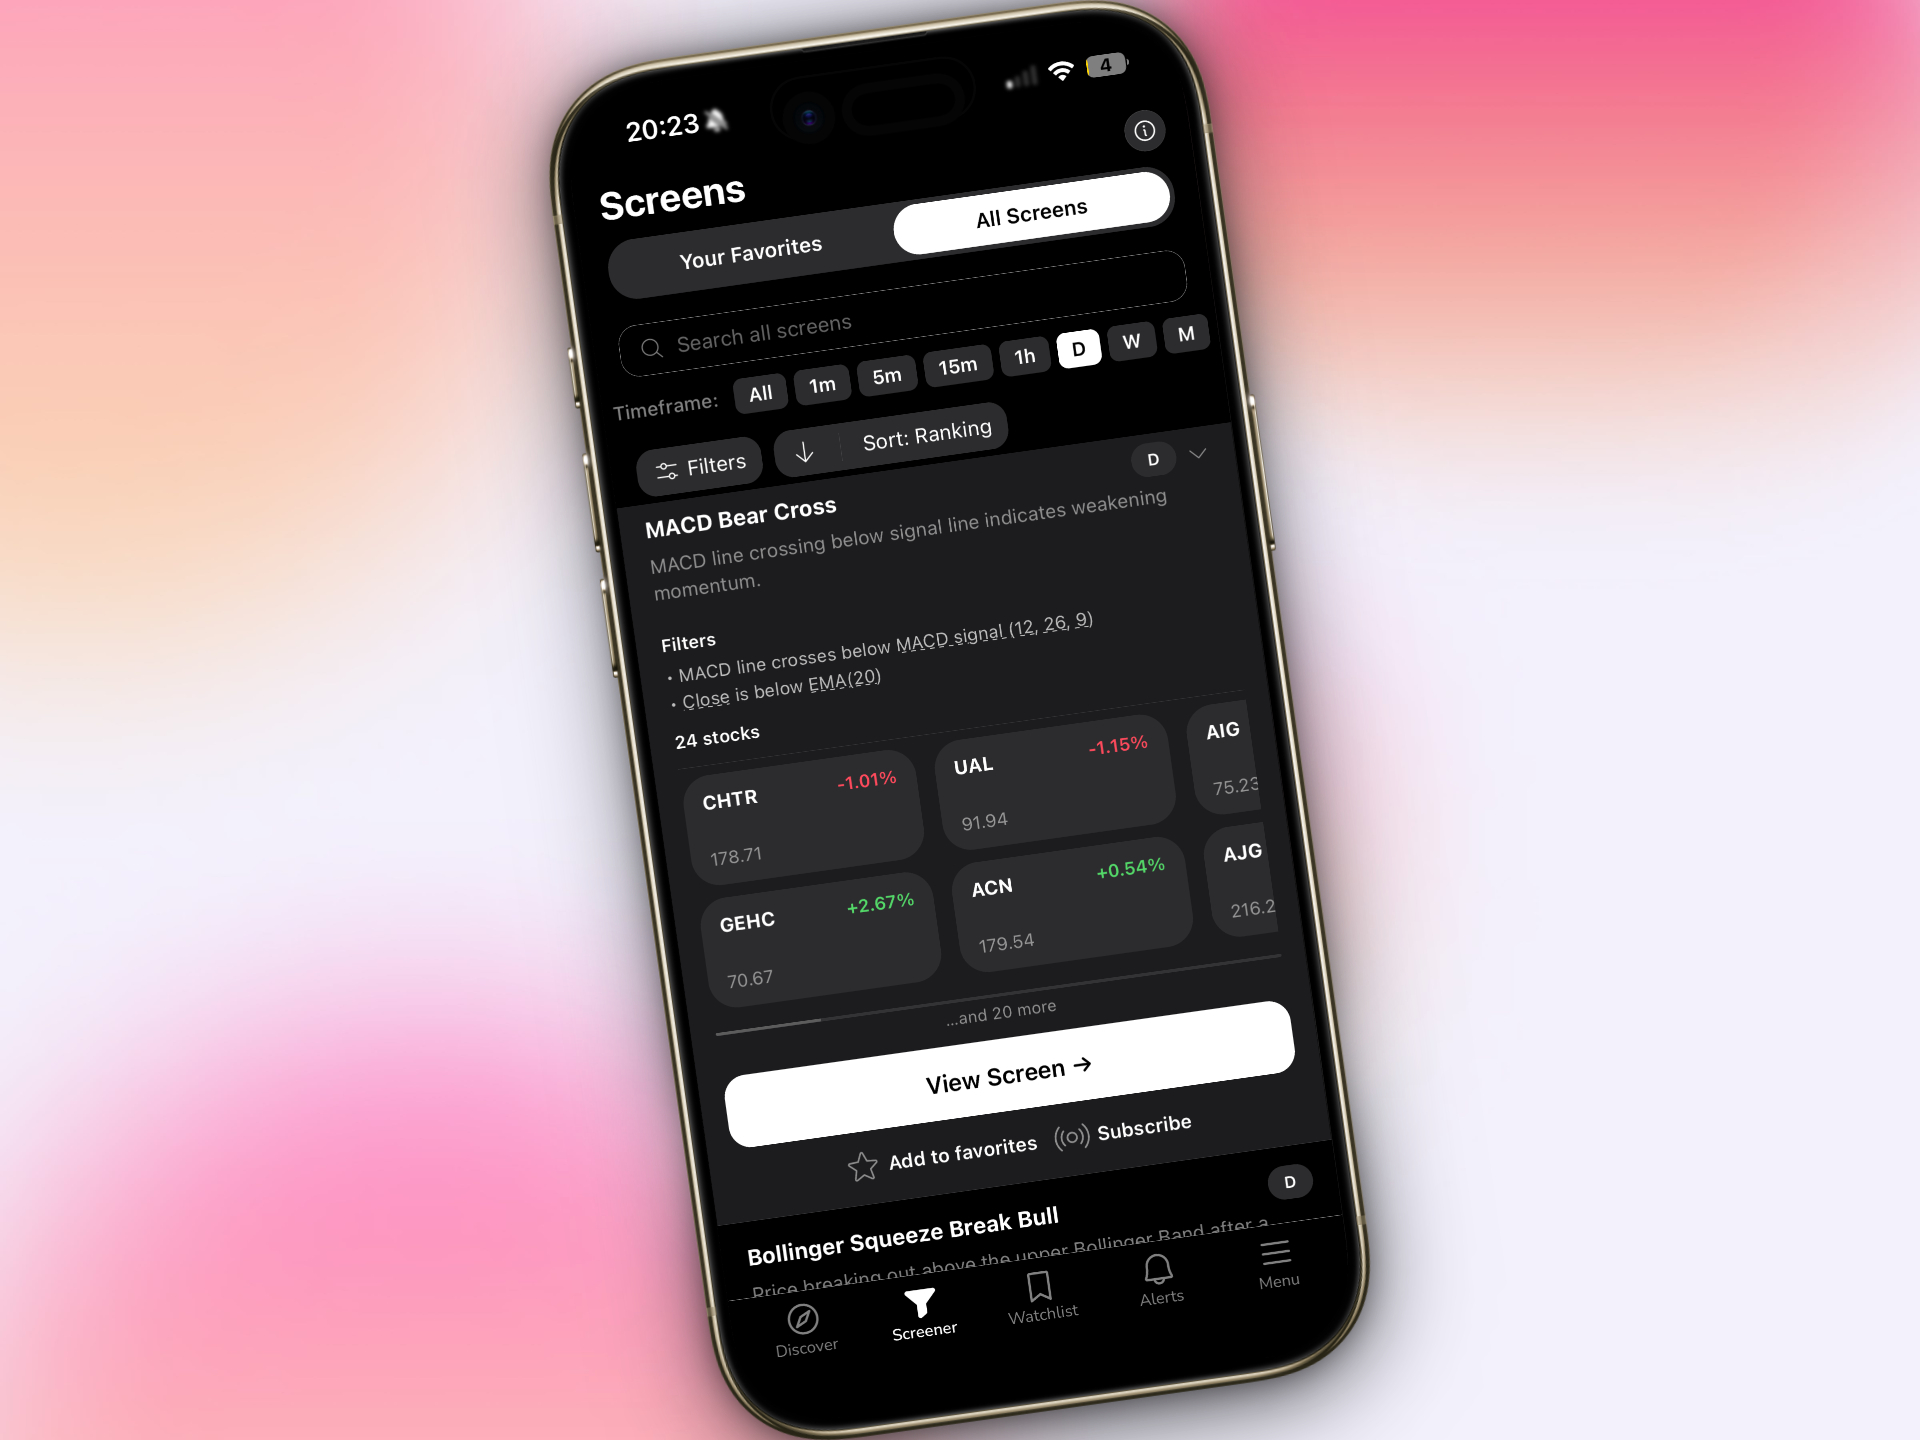
Table of Contents
You've refreshed your stock screener 47 times today. You've missed three perfect ORB setups because you were in a meeting. And you're pretty sure there's a VWAP reclaim happening right now on a stock you're not even watching.
Sound familiar? The problem isn't your trading skills. It's that manual scanning simply can't keep up with modern markets. While you're checking one timeframe on one stock, hundreds of high-probability setups are forming across the market.
That's where trade discovery platforms come in. Instead of hunting for stocks that meet basic criteria, these tools continuously scan for actual tradeable setups and alert you the moment they trigger. Think of it as the difference between searching for a needle in a haystack versus having someone hand you the needle.
In this case study, we'll show you exactly how three real traders use trade discovery tools to identify 10+ high-probability setups every single day. You'll see their actual workflows, their filtering strategies, and the specific results they've achieved. Whether you're a day trader, swing trader, or just starting out, you'll walk away with a blueprint you can implement immediately.
The Trade Discovery Challenge: Why Manual Scanning Fails Active Traders
Let's be honest about what manual scanning actually looks like in 2026. You've got Finviz open in one tab, TradingView in another, maybe a third screener running on your phone. You're refreshing each one every few minutes, hoping to catch something before it moves.
The math just doesn't work. There are over 5,000 actively traded stocks in the US market. Each one trades across multiple timeframes (1-minute, 5-minute, 15-minute, hourly, daily, weekly). That's potentially 30,000+ chart combinations you'd need to monitor for technical setups.
Even if you narrow your focus to 100 stocks, you're still looking at 600 different chart timeframes. And technical setups don't wait for you to check in. An ORB breaks in 30 seconds. A VWAP reclaim happens while you're grabbing coffee. A momentum spike triggers while you're analyzing a different stock.
This creates three massive problems for active traders:
- Alert fatigue: Generic price alerts flood your phone with notifications that lack context. You get 50 alerts per day, but which ones actually represent quality setups?
- Missed opportunities: By the time you manually discover a setup, the best entry is gone. You're chasing instead of entering at optimal levels.
- Time waste: You spend 3-4 hours per day just scanning and refreshing screeners, time that could be spent analyzing trades or actually trading.
The gap isn't between finding a stock and making money. It's between finding a stock and finding a tradeable setup with a proven edge. That's what trade discovery solves.
Case Study 1: Day Trader Finding 12-15 Intraday Setups with Real-Time Trade Discovery
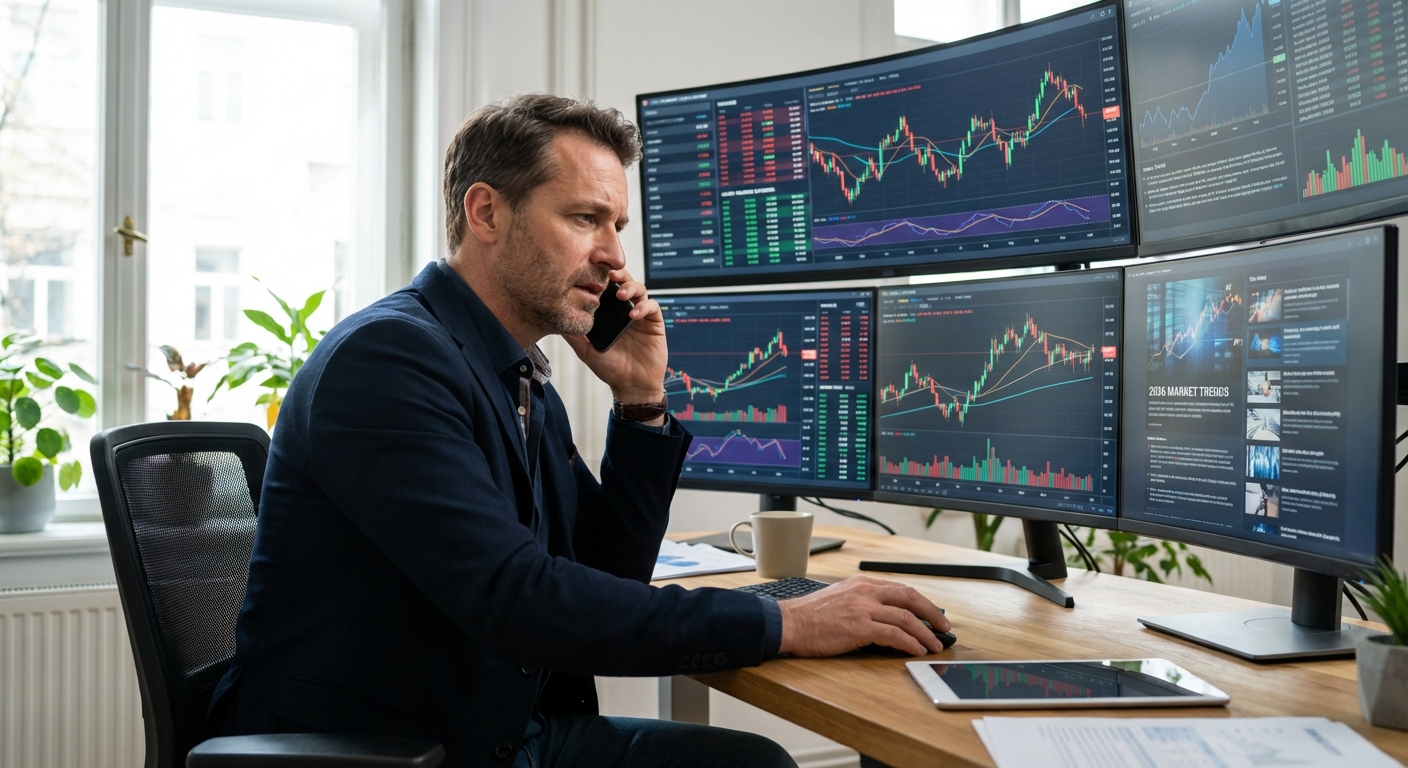
Meet Marcus Chen, a full-time day trader based in Austin, Texas. Marcus specializes in momentum trading and Opening Range Breakout (ORB) plays on stocks with high relative volume. Before discovering trade discovery platforms, his morning routine was brutal.
"I'd wake up at 6:30 AM Pacific and immediately start scanning," Marcus explains. "I had six different screeners open. Finviz for premarket gappers, TradingView for chart patterns, another scanner for RVOL spikes. I was constantly switching between tabs, refreshing, checking alerts. By 9:30 AM market open, I was already exhausted."
The bigger problem? Marcus was missing 60% of his best setups. While he was analyzing one stock, three others were breaking out. While he was checking his 5-minute charts, a perfect 15-minute setup was forming on a stock not even on his watchlist.
The Discovery Workflow: How Marcus Filters Through Hundreds of Signals
Marcus now uses ChartMath's trade discovery platform to monitor 200+ technical screens simultaneously. Here's his exact workflow:
Morning Routine (6:30-9:30 AM): Marcus starts with the premarket scanner to identify stocks with unusual volume and gap patterns. He's specifically looking for stocks with 3x+ relative volume and gaps above key resistance levels. The platform automatically ranks these by quality based on historical backtest data.
"I used to manually check 40-50 gappers every morning," Marcus says. "Now the platform shows me the top 10-12 based on which gap patterns have actually worked historically. It's not just showing me stocks that gapped up. It's showing me stocks with gap patterns that have a 60%+ win rate when traded with specific entry and exit rules."
Intraday Monitoring (9:30 AM-4:00 PM): Once the market opens, Marcus relies on push alerts for his core setups: ORB breaks, VWAP reclaims, and RVOL spikes on his watchlist stocks. But here's the key: he's also discovering new opportunities throughout the day through the swipe-based discovery feed.
"The feed is ranked by freshness and quality," Marcus explains. "So if a stock I'm not watching just triggered a 5-minute ORB break with 5x RVOL, it shows up at the top of my feed. I swipe through maybe 20-30 setups during the trading day, and I'm taking 12-15 of them."
Quality Filtering: Marcus has one non-negotiable rule: he only trades setups with 55%+ historical win rates shown in the backtest data. Every signal in ChartMath displays the win rate, average return, and sample size for that specific pattern.
"I'm not guessing anymore," Marcus says. "If the platform shows me a bull flag setup with a 62% win rate and 4.2% average return over 200 historical trades, I know the edge. If it shows me a setup with a 48% win rate, I skip it. That filtering alone has improved my consistency dramatically."
Results: Marcus now identifies 12-15 quality intraday setups daily, up from 5-6 with manual scanning. More importantly, his entry timing has improved by 40% because he's getting alerted the moment setups trigger, not 5-10 minutes later when he happens to check that stock.
Case Study 2: Swing Trader Discovering End-of-Day Setups in 30 Minutes
Sarah Rodriguez has a different challenge. She's a marketing director at a tech company in Denver, which means she can't watch the market during trading hours. She's a swing trader who holds positions for 3-10 days, focusing on breakout trading opportunities on daily and weekly timeframes.
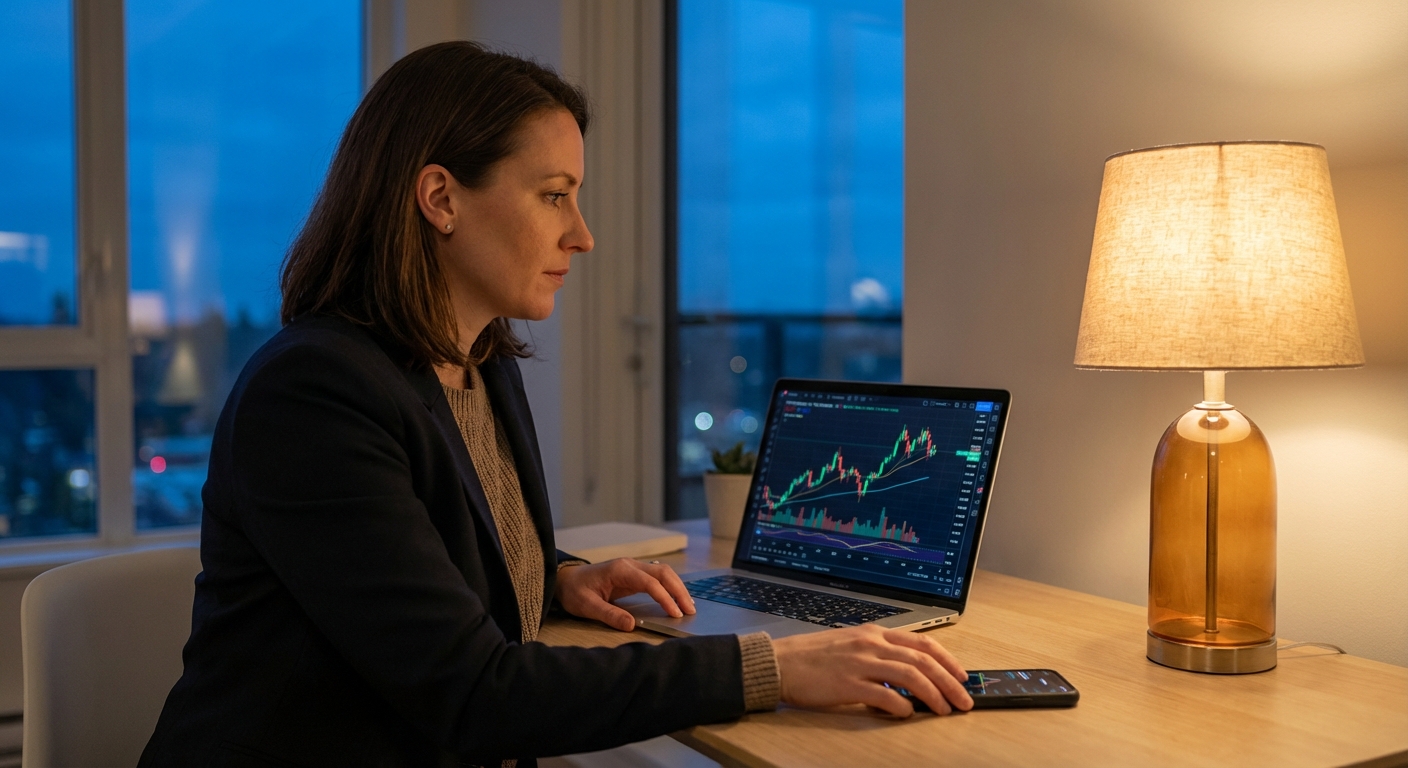
Sarah's constraint is time. She has exactly 30 minutes each evening after her kids go to bed to find next-day trading opportunities. Before using trade discovery tools, those 30 minutes were never enough.
"I'd spend two hours every night manually scanning charts," Sarah recalls. "I'd go through my watchlist of 50 stocks, check for breakout patterns, look at volume, try to identify support and resistance levels. By the time I finished, it was 11 PM and I'd found maybe 2-3 potential trades. I was burning out."
Sarah's Evening Trade Discovery Routine
Sarah's workflow is now streamlined to exactly 30 minutes using ChartMath's end-of-day scanning:
6:00 PM - Review Daily Breakout Screens (10 minutes): Sarah opens the app and navigates to her saved screens: ascending triangles, bull flags, golden cross setups, and chart patterns on daily timeframes. The platform has already scanned the entire market and identified stocks where these patterns formed today.
"The platform shows me 15-20 stocks that formed breakout patterns today," Sarah explains. "Each one has a chart preview, the specific pattern that triggered, and the backtest performance. I can immediately see which patterns have the best historical win rates."
6:10 PM - Check Backtest Data (10 minutes): This is where Sarah's approach differs from day traders. She's looking for setups with multi-day holding periods that match her swing trading style. She filters for patterns with 5-10 day average hold times and 8%+ average returns.
"I'm not interested in scalps or day trades," Sarah says. "I need setups that work over several days because I can't babysit positions during market hours. The backtest data shows me not just win rate, but average hold time and average return. That's critical for swing traders."
6:20 PM - Build Watchlist and Set Alerts (10 minutes): Sarah selects her top 5-7 setups and adds them to her watchlist. She sets alerts for entry triggers, typically a breakout above resistance with volume confirmation.
"I'll get an alert the next day if the stock breaks out above the pattern resistance," Sarah explains. "Then I can place my order during my lunch break. I'm not missing entries because I'm in meetings. The platform is watching for me."
Results: Sarah now identifies 8-10 quality swing setups per week, compared to 2-3 with manual scanning. She's reduced her evening research time from 2 hours to 30 minutes, and she's finding 3x more opportunities. Her win rate has also improved because she's only trading patterns with proven historical performance.
Case Study 3: Technical Trading Beginner Learning Through Trade Discovery
Jake Thompson represents a different type of trader: the beginner. He's six months into learning technical analysis and still figuring out which setups actually work. His biggest challenge isn't finding stocks. It's understanding why certain setups work and others don't.
"I'd follow trading Twitter and see people posting about ORB breaks or VWAP reclaims," Jake says. "But I didn't really understand what I was looking for or why those patterns mattered. I'd set up alerts on TradingView, but when they triggered, I didn't know if it was actually a good trade or just noise."
Jake's Educational Trade Discovery Approach
Jake uses ChartMath's trade discovery platform as both a screening tool and an educational resource. Here's how:
Focus on 3-4 Proven Setups: Instead of trying to learn every pattern at once, Jake focuses on four core setups: ORB breaks, VWAP reclaims, bull flags, and ascending triangles. These are among the most reliable technical setups with strong historical performance.
"The platform has 200+ screens, but I only follow four of them," Jake explains. "I want to master these patterns before moving on to more complex setups. Each time one triggers, I get a notification with a plain-English explanation of what happened and why it matters."
Plain-English Explanations: This is what sets trade discovery apart from generic alerts. When Jake gets a notification, it doesn't just say "AAPL crossed above VWAP." It says: "AAPL reclaimed VWAP on increasing volume after a morning pullback. This pattern has a 58% win rate with an average 2.1% return when entered within 5 minutes of the reclaim."
"That context is everything," Jake says. "I'm learning why the setup works, not just that it triggered. Over time, I'm starting to recognize these patterns on my own before the alerts even fire."
Backtest Data as Education: Before taking any trade, Jake reviews the backtest performance. He looks at the win rate, average return, sample size, and maximum drawdown. This helps him understand the realistic expectations for each setup.
"I used to think every trade should be a winner," Jake admits. "But when I see that a 58% win rate is actually really good, and that even the best setups have losing streaks, it changes my mindset. I'm more patient and less emotional when trades don't work out."
Results: Jake now takes 6-8 quality trades per week, and his win rate is steadily improving. More importantly, his pattern recognition skills are developing rapidly because he's seeing real-time examples of setups with historical context. He's not just following alerts blindly. He's learning to think like a technical trader.
Common Trade Discovery Workflows Across All Three Traders
Despite their different trading styles and experience levels, Marcus, Sarah, and Jake share several common approaches to trade discovery:
Quality Over Quantity: All three traders use backtest data to filter for high-probability setups. They're not taking every alert that fires. They're selective, focusing on patterns with 55%+ win rates and positive expected value.
Multi-Timeframe Analysis: Marcus monitors 5-minute and 15-minute charts for intraday trading. Sarah focuses on daily and weekly timeframes for swing trades. Jake uses 15-minute and hourly charts as a beginner. The platform supports all timeframes, allowing each trader to customize their discovery feed.
Push Alerts Eliminate Constant Monitoring: None of them are refreshing screeners anymore. They set up their preferred screens and watchlists, then let the platform push alerts when setups trigger. This frees up mental bandwidth and reduces screen time.
Custom Watchlists for Recurring Setups: All three maintain watchlists of stocks that frequently produce their favorite setups. Marcus watches high-volume momentum stocks. Sarah tracks growth stocks with strong fundamentals. Jake follows liquid large-caps while he's learning. When setups form on watchlist stocks, they get priority alerts.
Mobile-First Approach: Marcus checks his discovery feed between trades on his phone. Sarah reviews setups on her phone during her evening routine. Jake gets alerts on his phone while he's at his day job. The mobile-first design means they're never tied to a desktop to discover opportunities.
The 5 Key Features That Enable 10+ Daily Trade Discovery
Based on these case studies, five specific features make high-volume trade discovery possible:
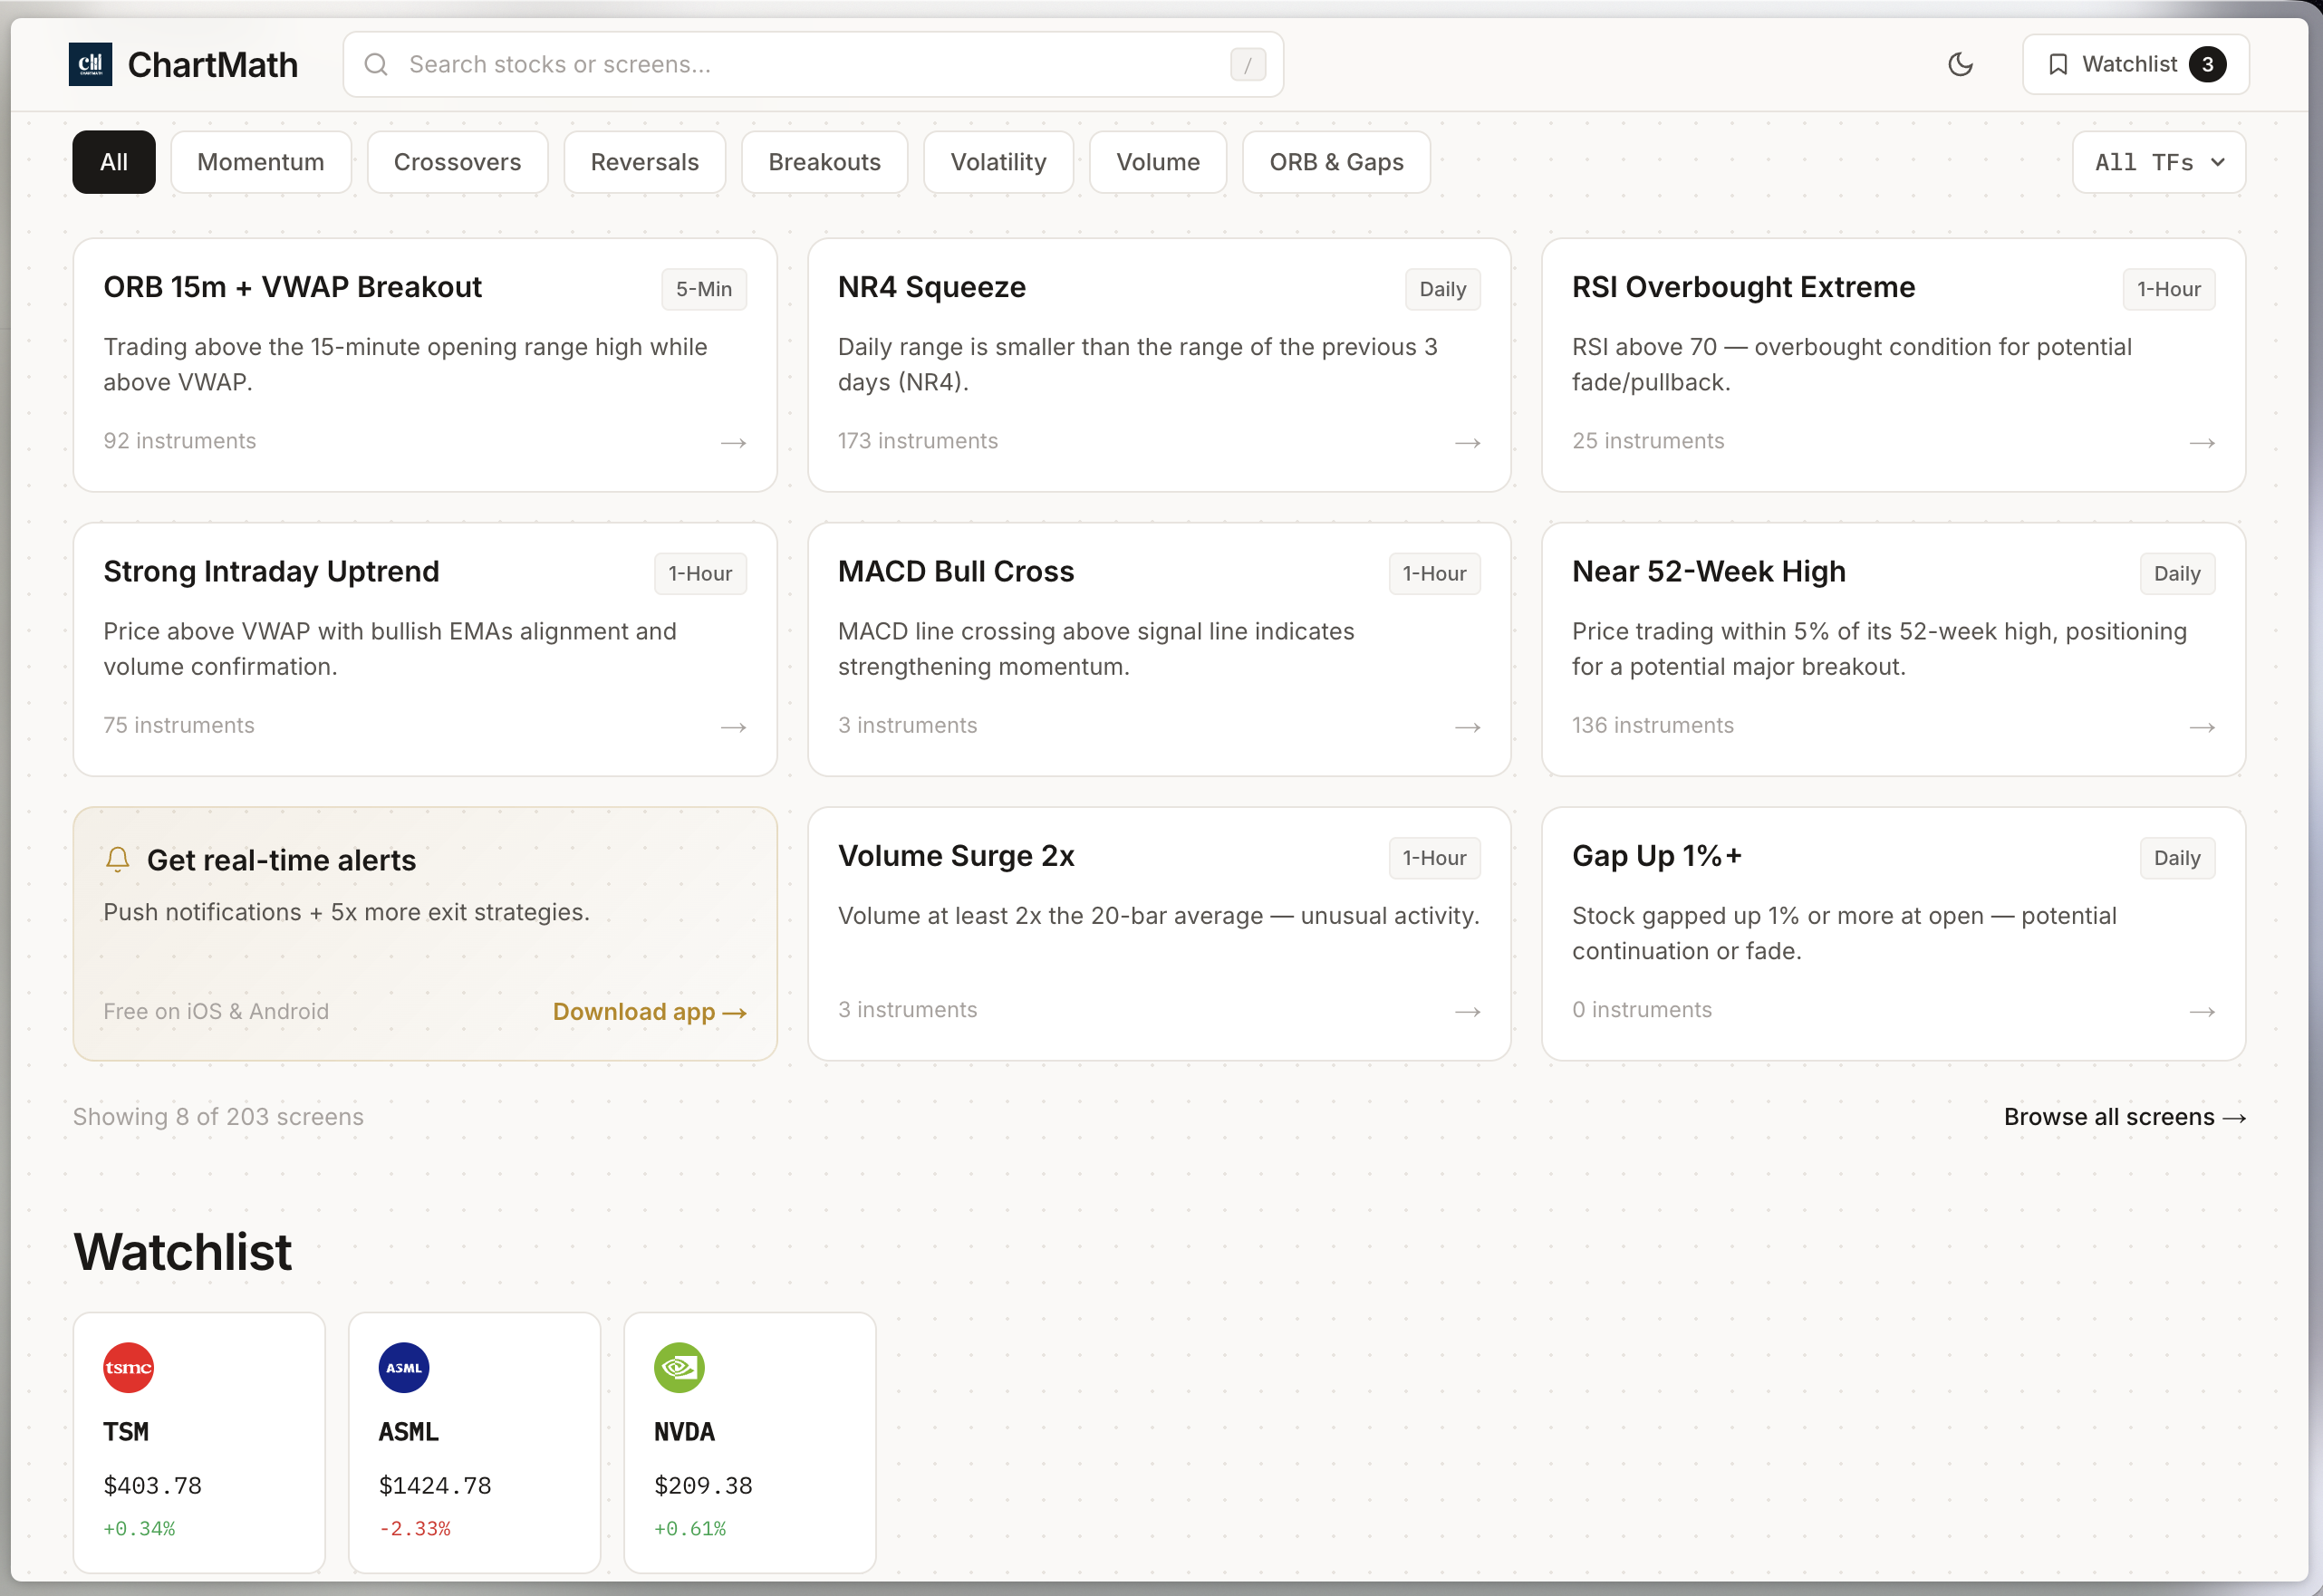
1. Real-Time Scanning Across 200+ Technical Screens: The platform continuously monitors the market for ORB breaks, VWAP reclaims, RVOL spikes, breakout patterns, momentum indicators, and dozens of other technical setups. You're not limited to watching 10-20 stocks manually. You're scanning the entire market simultaneously.
2. Backtest Data for Every Setup: Each signal displays historical performance: win rate, average return, sample size, and maximum drawdown. This transforms alerts from noise into actionable intelligence. You know the edge before you take the trade.
3. Quality Ranking System: Not all setups are created equal. The discovery feed ranks signals by quality (based on backtest performance) and freshness (how recently they triggered). The best opportunities surface first, so you're not wading through mediocre setups to find the gems.
4. Multi-Timeframe Coverage: Whether you trade 1-minute scalps or monthly position trades, the platform scans across all timeframes: 1m, 5m, 15m, 1h, daily, weekly, and monthly. You can customize your feed to show only the timeframes relevant to your trading style.
5. Right-Time Alerts with Context: Generic price alerts tell you what happened. Trade discovery alerts tell you what happened, why it matters, and what the historical performance of that pattern is. That context is the difference between an alert you ignore and an alert you act on.
These features work together to solve the core problem: you can't manually monitor enough stocks and timeframes to find 10+ quality setups daily. But a platform that scans continuously, filters by quality, and alerts you with context can.
How to Build Your Own Trade Discovery Workflow in 2026
Ready to implement your own trade discovery system? Here's a step-by-step framework based on what Marcus, Sarah, and Jake have proven works:
Step 1: Define Your Trading Style and Preferred Timeframes
Are you a day trader, swing trader, or position trader? Do you prefer 5-minute momentum plays or daily breakout patterns? Your trading style determines which screens and timeframes you'll focus on. Don't try to trade everything. Specialize first, then expand.
Step 2: Select 5-10 Proven Technical Setups to Focus On
Start with high-probability patterns that have strong historical performance. For day traders: ORB breaks, VWAP reclaims, RVOL spikes, and momentum breakouts. For swing traders: ascending triangles, bull flags, golden crosses, and daily breakout patterns. Master these before adding more complex setups.
Step 3: Set Up Real-Time Screens and Alerts for Those Patterns
Configure your trade discovery platform to scan for your chosen setups. Set up push alerts so you're notified the moment they trigger. Customize alert preferences based on your availability. If you can't trade during market hours, focus on end-of-day alerts for next-day opportunities.
Step 4: Use Backtest Data to Filter for 55%+ Win Rate Setups
Not every alert deserves your attention. Filter your discovery feed to show only setups with proven historical performance. A 55% win rate with positive average returns is a good baseline. As you gain experience, you can refine these filters based on your own trading results.
Step 5: Build Watchlists and Customize Alert Preferences
Create watchlists of stocks that frequently produce your favorite setups. Set priority alerts for watchlist stocks so you never miss opportunities on your core holdings. Customize alert timing based on your schedule. If you're in meetings from 10-11 AM, batch alerts for review afterward.
Step 6: Review and Refine Based on Your Actual Trading Results
Track which setups are working best for you personally. Your results might differ from historical backtests based on your entry timing, exit strategy, and risk management. Double down on what's working. Eliminate or adjust what's not. Your trade discovery workflow should evolve as you develop as a trader.
For a deeper dive into optimizing your entire trading process, check out our guide on building an efficient trading workflow.
Trade Discovery vs Traditional Stock Screeners: What's the Difference?
If you're used to traditional stock screeners, trade discovery might sound similar. But there are critical differences:
Stock Screeners Filter Stocks by Criteria. You set parameters like "price above $10, volume above 1M shares, RSI above 70" and the screener shows you stocks that match. You still need to manually analyze each stock to find actual tradeable setups.
Trade Discovery Finds Tradeable Setups. Instead of showing you stocks that meet basic criteria, trade discovery platforms identify specific technical patterns that have triggered. You're not getting a list of stocks with high volume. You're getting a list of ORB breaks, VWAP reclaims, and breakout patterns that are happening right now.
Traditional Screeners Require Manual Refresh. You run a scan, review the results, then run it again 10 minutes later to see if anything changed. You're constantly refreshing, hoping to catch new opportunities.
Trade Discovery Pushes Real-Time Alerts. The platform scans continuously and alerts you the moment setups trigger. You're not refreshing. You're being notified in real-time, often within seconds of a pattern forming.
Screeners Show What Stocks Meet Filters. They answer the question: "Which stocks have these characteristics right now?" But they don't tell you if those characteristics actually lead to profitable trades.
Trade Discovery Shows Why Setups Work with Backtest Data. Every signal includes historical performance data: win rate, average return, sample size. You're not guessing if a setup is worth trading. You're seeing the actual historical edge.
The shift from DIY screening to curated, validated setup discovery is similar to the shift from building your own website to using a platform like Shopify. You could build everything from scratch, but why would you when a specialized platform does it better, faster, and with proven results?
If you're still using traditional screeners and want to understand how to maximize them, our guide on using stock screeners for day trading can help bridge the gap.
Measuring Trade Discovery Success: Key Metrics from Our Case Studies
Let's quantify the results our three traders achieved with trade discovery platforms:
Marcus (Day Trader):
- Setups identified daily: 12-15 (up from 5-6 with manual scanning)
- Entry timing improvement: 40% faster entries on average
- Time spent scanning: Reduced from 3-4 hours to 30-45 minutes
- Win rate improvement: 8% increase by focusing on 55%+ backtest setups
Sarah (Swing Trader):
- Setups identified weekly: 8-10 (up from 2-3 with manual scanning)
- Research time: Reduced from 2 hours per evening to 30 minutes
- Opportunity increase: 3x more swing trade opportunities
- Missed entries: Eliminated by using next-day breakout alerts
Jake (Beginner):
- Quality trades weekly: 6-8 with improving win rate
- Pattern recognition: Significantly improved through plain-English explanations
- Learning curve: Accelerated by seeing real-time examples with historical context
- Emotional trading: Reduced by understanding realistic win rate expectations
Common Theme: All three traders found more opportunities with less screen time and better quality filtering. They're not working harder. They're working smarter by letting technology handle the continuous scanning while they focus on analysis and execution.
The key insight? Trade discovery doesn't just save time. It fundamentally changes what's possible. You can't manually find 12-15 quality setups daily. You can't scan the entire market for end-of-day breakout patterns in 30 minutes. You can't learn technical analysis by trial and error without burning through your account. But with the right trade discovery platform, all three become achievable.
Start Your Own Trade Discovery Journey Today
Marcus, Sarah, and Jake all started exactly where you are right now. They were frustrated with manual scanning, missing opportunities, and spending too much time staring at screeners. The difference is they made a decision to let technology handle the heavy lifting.
Trade discovery isn't about replacing your trading skills. It's about amplifying them. You still make the final decision on every trade. You still manage risk and execute your strategy. But now you're making those decisions with better information, more opportunities, and proven historical data backing every setup.
ChartMath's trade discovery platform gives you everything Marcus, Sarah, and Jake use: 200+ technical screens scanning in real-time, backtest data for every setup, mobile-first alerts with context, and a swipe-based discovery feed that surfaces the highest-quality opportunities first.
Ready to find your next 10+ trade discovery setups? Watch a demo to see exactly how the platform works, or download the app and start discovering setups in the next 5 minutes. You can also access the web-based screener to explore the full range of technical screens available.
The market is moving right now. Setups are forming. The question is: will you discover them in time?
Ankush Jindal
Co-Founder, ChartMath
Ankush Jindal is the Co-Founder of ChartMath, a real-time trade discovery platform that monitors 200+ technical screens across the market to surface actionable setups for technical traders. He holds a B.Tech in Computer Science from IIT Mandi. Before ChartMath, he co-founded two successful technology ventures spanning hundreds of thousands of users. This experience building data-intensive, real-time systems directly shaped his approach to technical analysis tooling. At ChartMath, Ankush leads product vision, designing intuitive interfaces that translate complex price action into clear, backtested signals. His philosophy: trading decisions should be backed by data, not gut feeling.
LinkedInSee these setups live in ChartMath
200+ curated screens with backtest data. Free to use.