Intraday Trading: How to Execute 1-Minute to 15-Minute Plays
You've got your charting platform open, coffee in hand, and the market just rang the opening bell. Within seconds, dozens of stocks are making big moves. Some are breaking out of opening ranges, others are reclaiming VWAP with massive volume. But by the time you manually scan through your watchlist and pull up the charts, the best entries are already gone.
This is the reality of intraday trading—opportunities appear and disappear in minutes, sometimes seconds. Success depends not just on knowing what to look for, but on having systems in place to catch these setups as they happen across 1-minute, 5-minute, and 15-minute timeframes.
In this comprehensive guide, you'll learn the complete process for identifying and executing high-probability intraday trading setups. We'll walk through workspace configuration, setup identification, multi-timeframe analysis, risk management, timing strategies, workflow automation, and performance tracking. Whether you're trading ORB breaks at the open or VWAP reclaims during power hour, this step-by-step approach will help you catch more opportunities without being glued to your screen all day.
What Is Intraday Trading and Why Short Timeframes Matter
Intraday trading refers to buying and selling securities within the same trading day, with all positions closed before the market closes. Unlike swing traders who hold positions for days or weeks, intraday traders capitalize on short-term price movements that unfold over minutes or hours.
The timeframes that matter most for intraday trading are:
- 1-minute charts: Ultra-short-term view showing every price fluctuation. Best for scalping and precise entry timing on fast-moving stocks.
- 5-minute charts: The sweet spot for most day traders. Filters out some noise while still capturing intraday momentum moves.
- 15-minute charts: Provides broader context for intraday trends. Useful for identifying larger patterns and confirming signals from lower timeframes.
Why do these short timeframes offer unique opportunities? Because institutional order flow, retail momentum, and algorithmic trading create predictable patterns that repeat throughout the day. When a stock breaks above its opening range with strong volume, or reclaims VWAP after a pullback, these technical events often trigger additional buying that pushes prices higher in the short term.
The challenge is that these setups happen fast and across hundreds of stocks simultaneously. You can't manually monitor everything. That's why successful intraday trading in 2026 requires a combination of technical knowledge and automated screening tools that surface opportunities in real-time.
1. Set Up Your Intraday Trading Workspace
Before you can execute intraday trading strategies effectively, you need the right infrastructure. Your workspace should enable you to spot setups quickly, analyze them across multiple timeframes, and execute trades without hesitation.
Essential tools for intraday trading include:
- Charting platform: TradingView, Thinkorswim, or similar software with real-time data and drawing tools
- Stock screener: A system that continuously scans the market for technical setups as they form
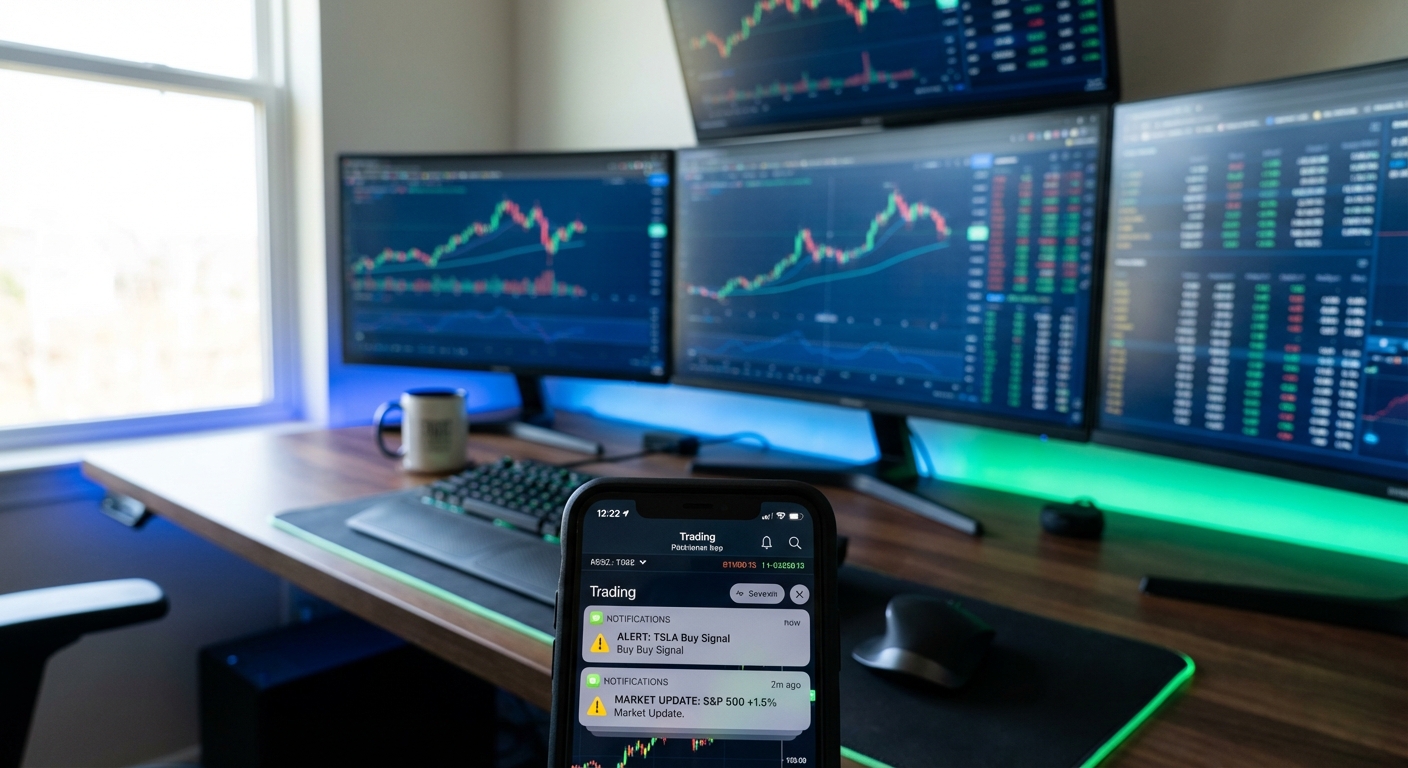
- Alert system: Real-time notifications when your criteria are met, delivered to your phone or desktop
- Broker platform: Fast execution with hotkeys for quick entries and exits
Many traders use a multi-monitor setup with different timeframes displayed simultaneously. However, the mobile-first approach has gained traction because it allows you to stay connected to opportunities even when you're away from your desk. The key is having a reliable stock screener that does the heavy lifting of monitoring hundreds of stocks across multiple technical criteria.
Premarket preparation is critical for intraday trading success. Before the market opens, you should:
- Review overnight news and earnings announcements
- Identify stocks with unusual premarket volume or price movement
- Build a focused watchlist of 10-20 stocks with potential setups
- Set alerts for key technical levels (previous day high/low, premarket high/low, VWAP)
- Define your risk parameters and position sizing for the day
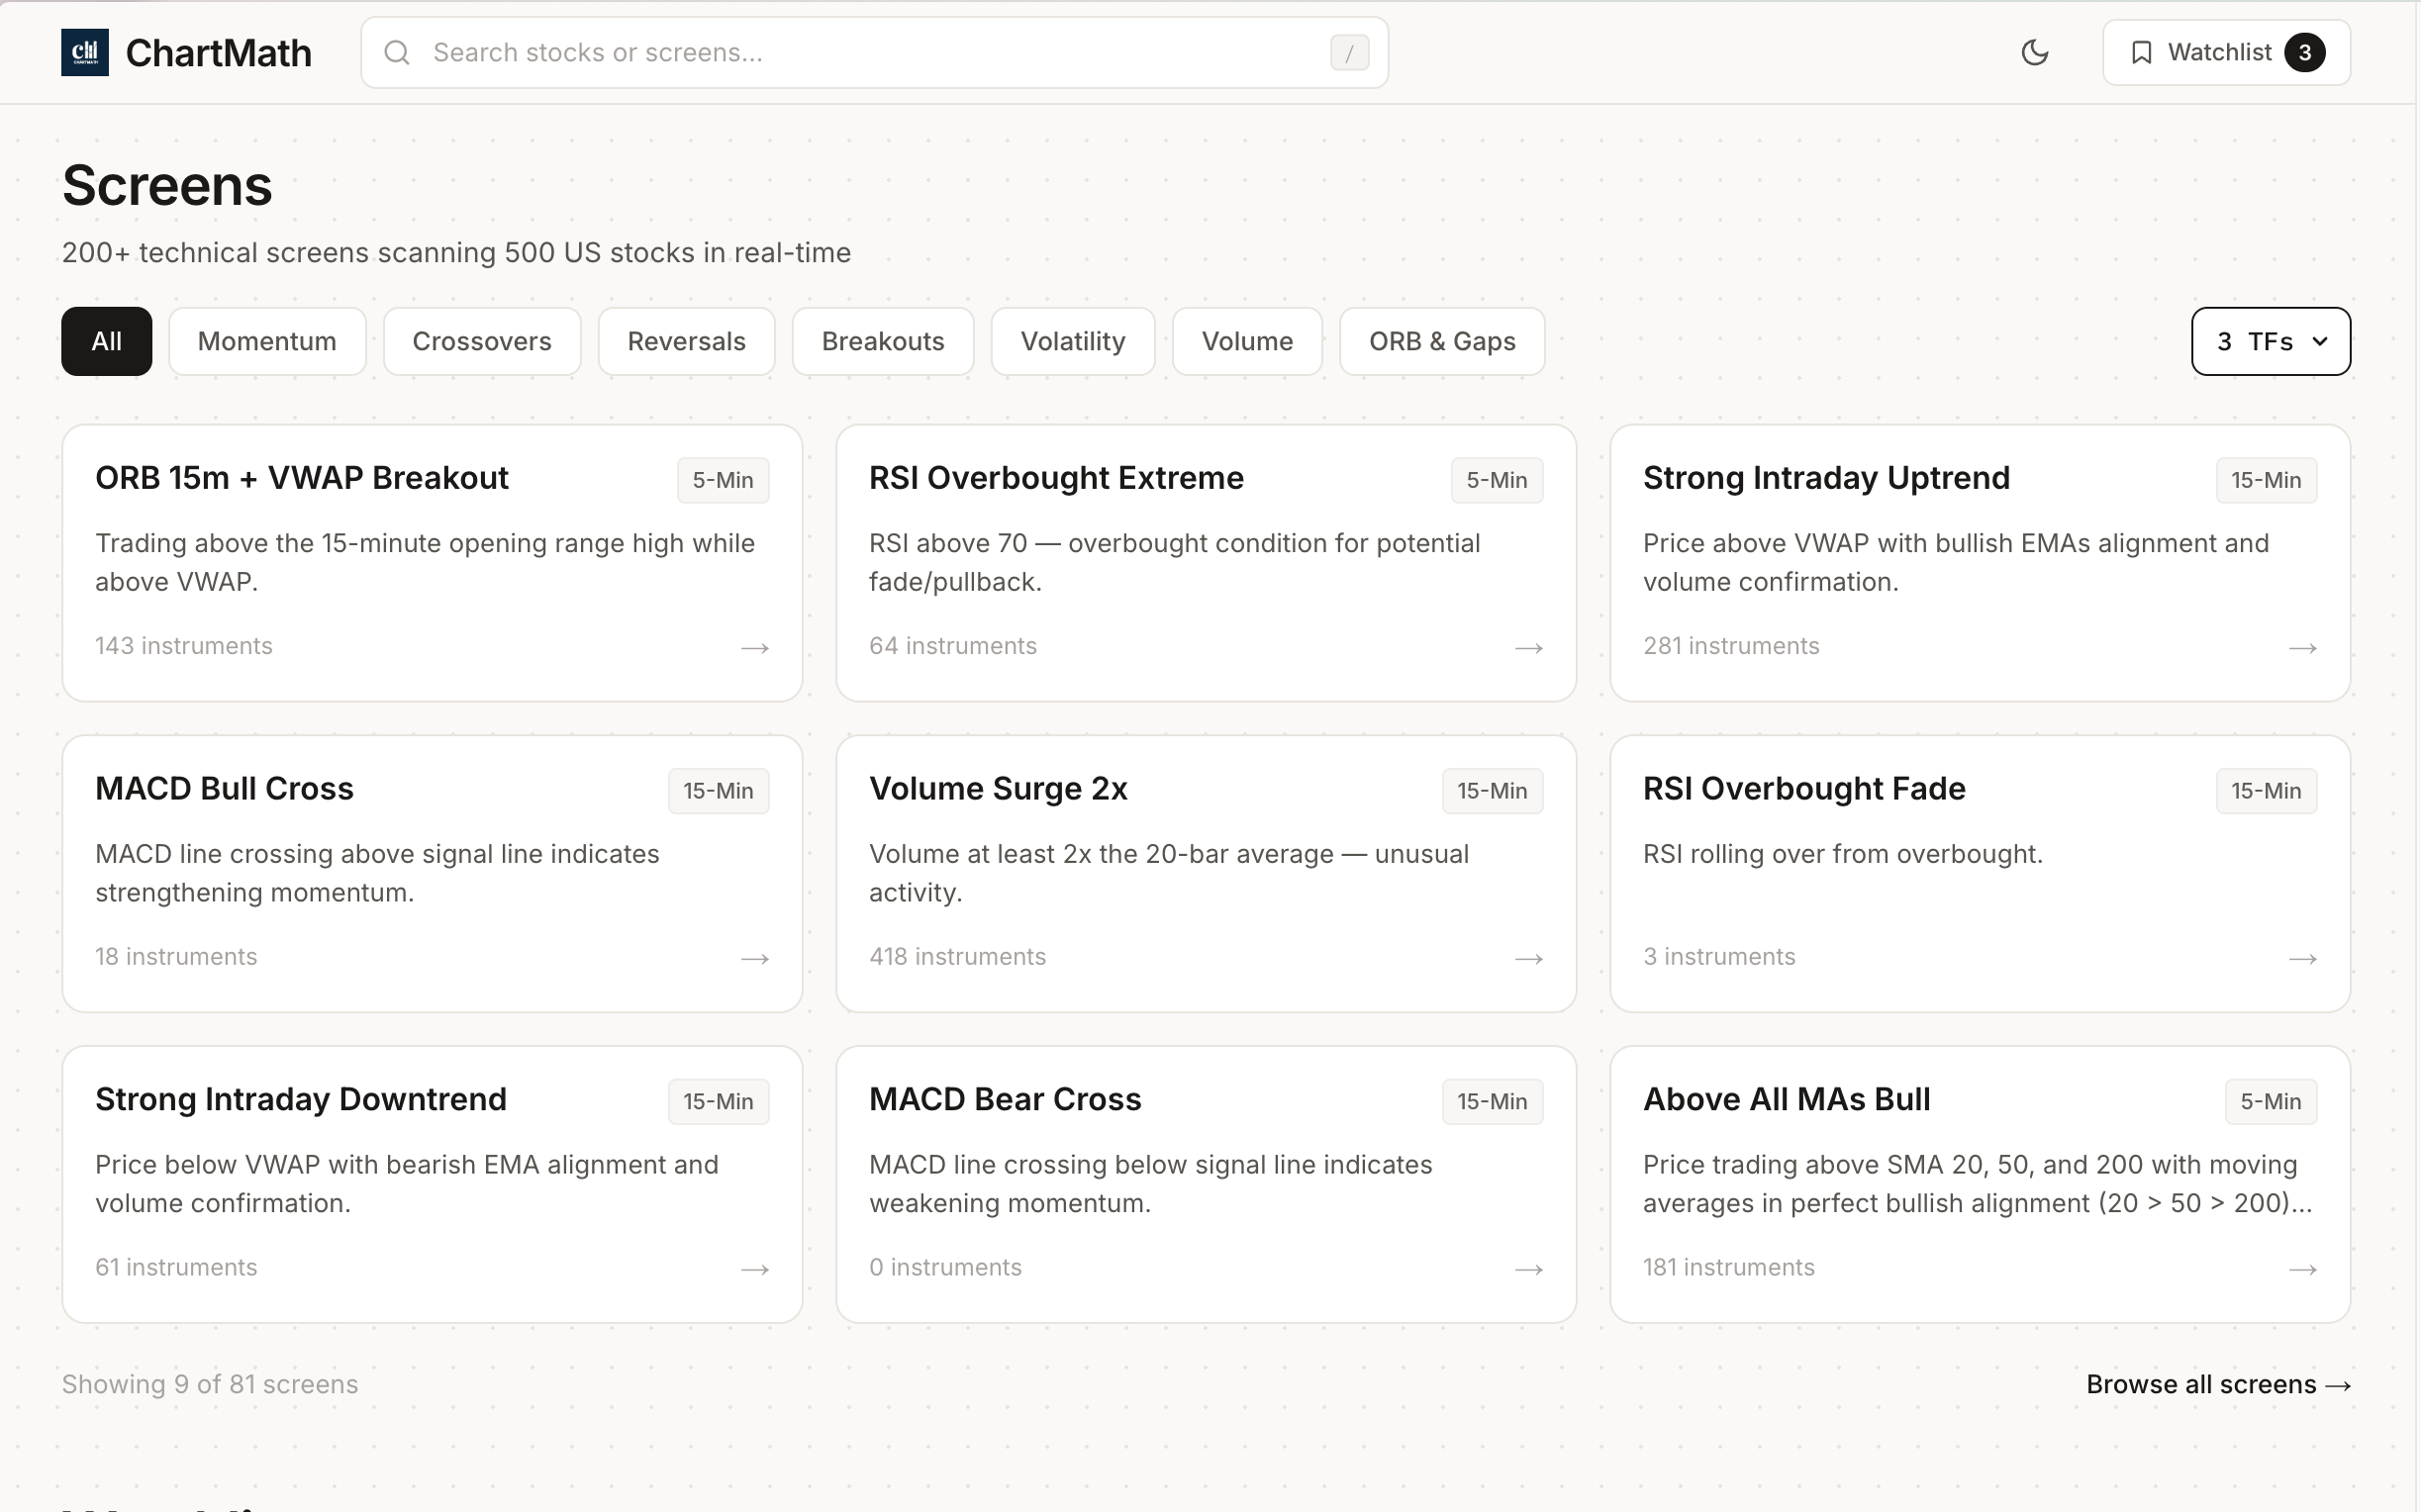
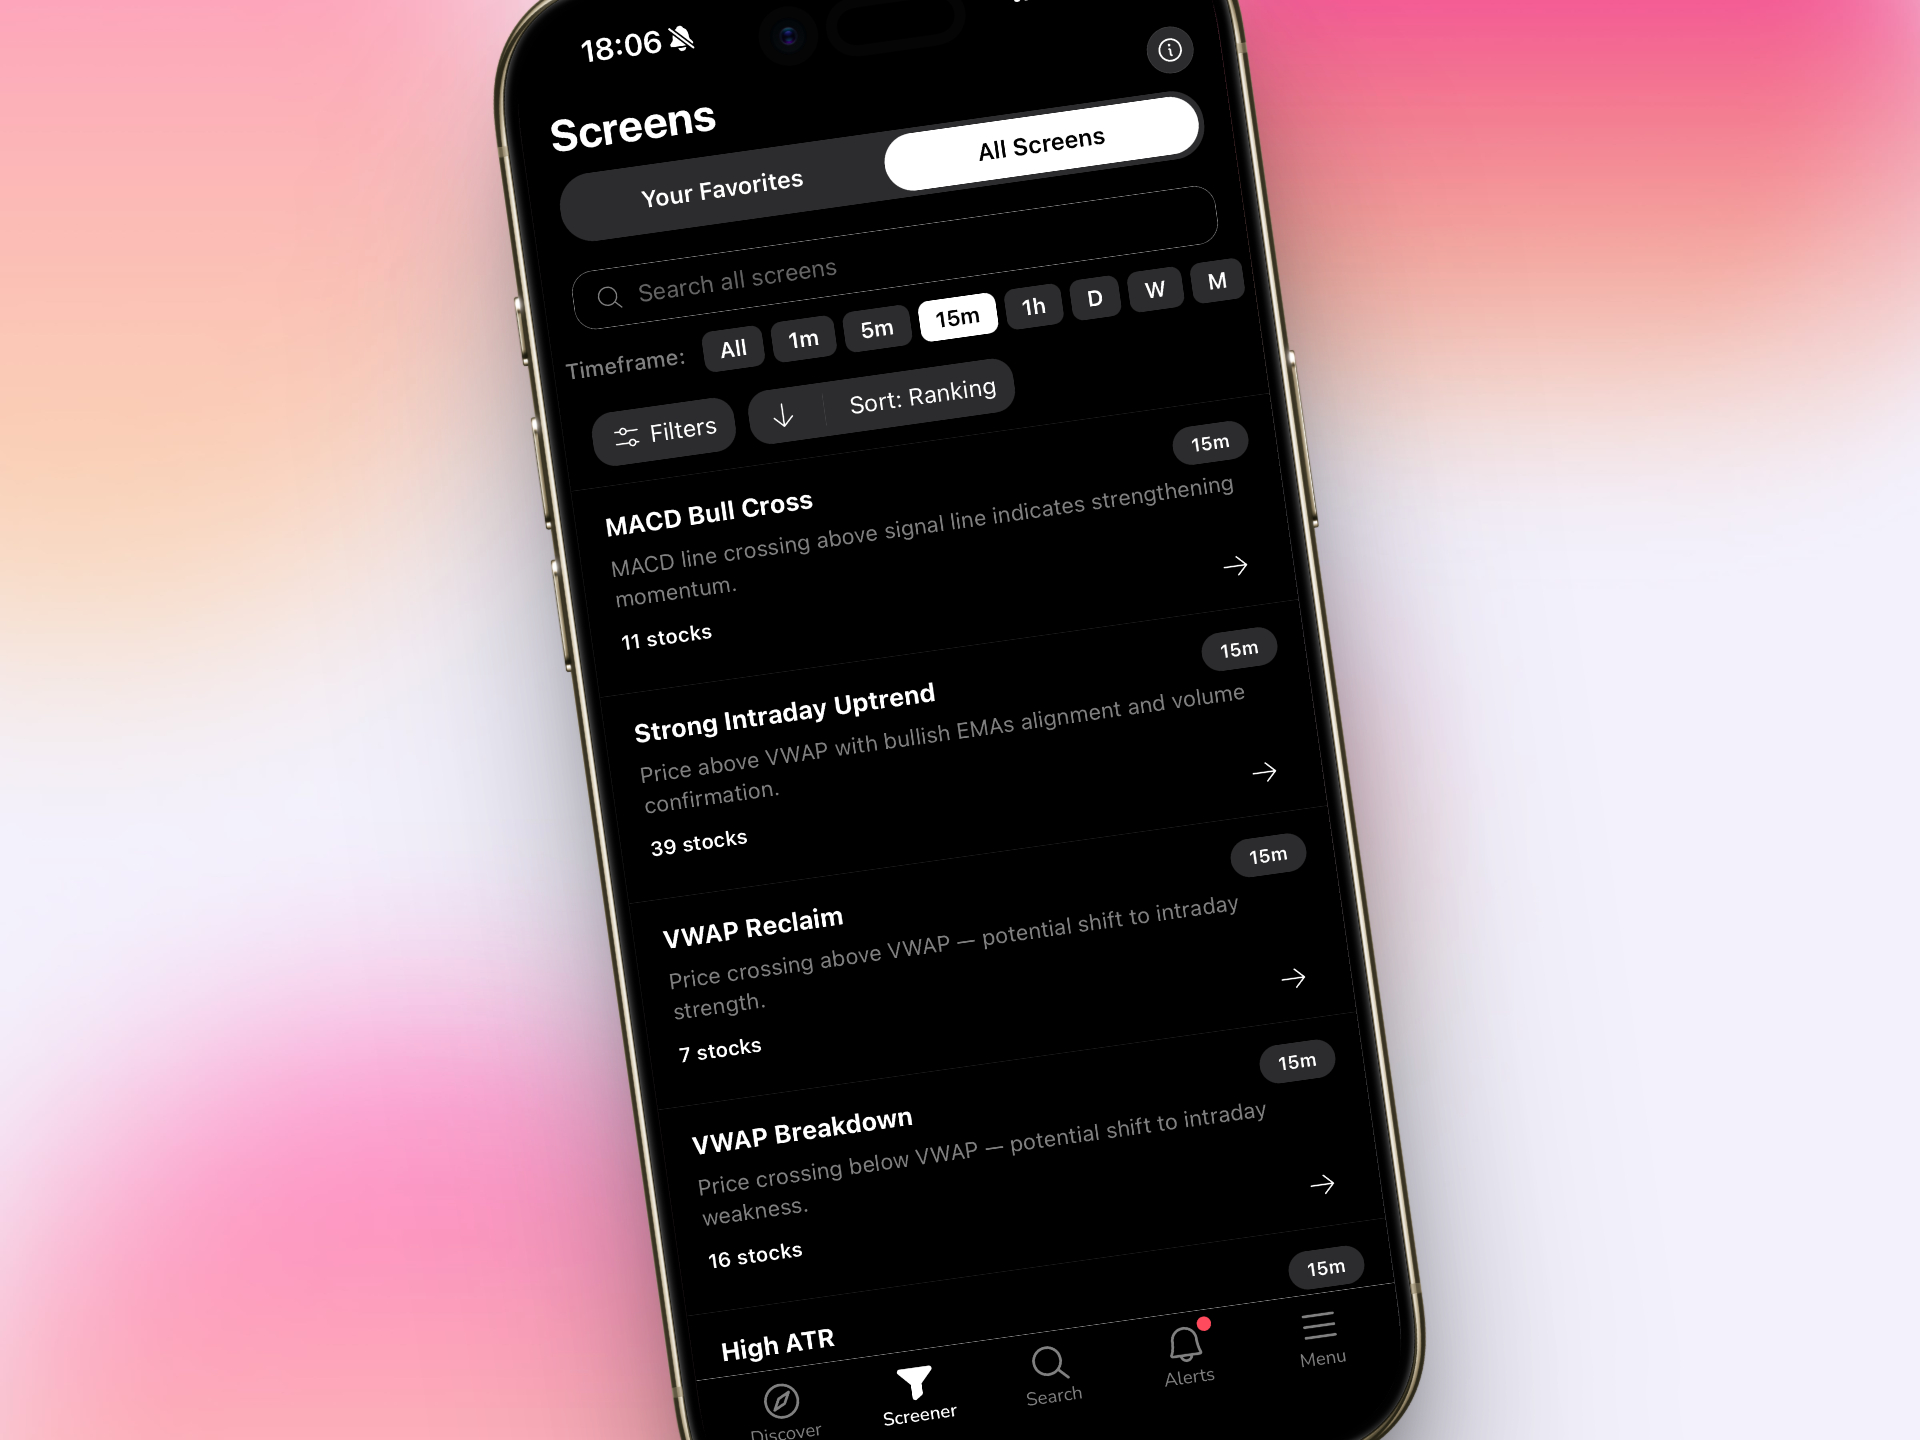
ChartMath complements your existing charting platform by continuously scanning 200+ technical screens and alerting you when setups form on your watchlist stocks. Instead of refreshing screeners manually throughout the day, you receive ranked alerts with plain-English explanations of why each signal triggered, along with backtested performance data to help you decide which setups are worth trading.
2. Identify High-Probability Intraday Trading Setups
Not all intraday price movements are worth trading. The goal is to focus on high-probability setups that have demonstrated edge through backtesting and align with your trading style. Here are the most reliable patterns for intraday trading across short timeframes.
Understanding ORB Breaks
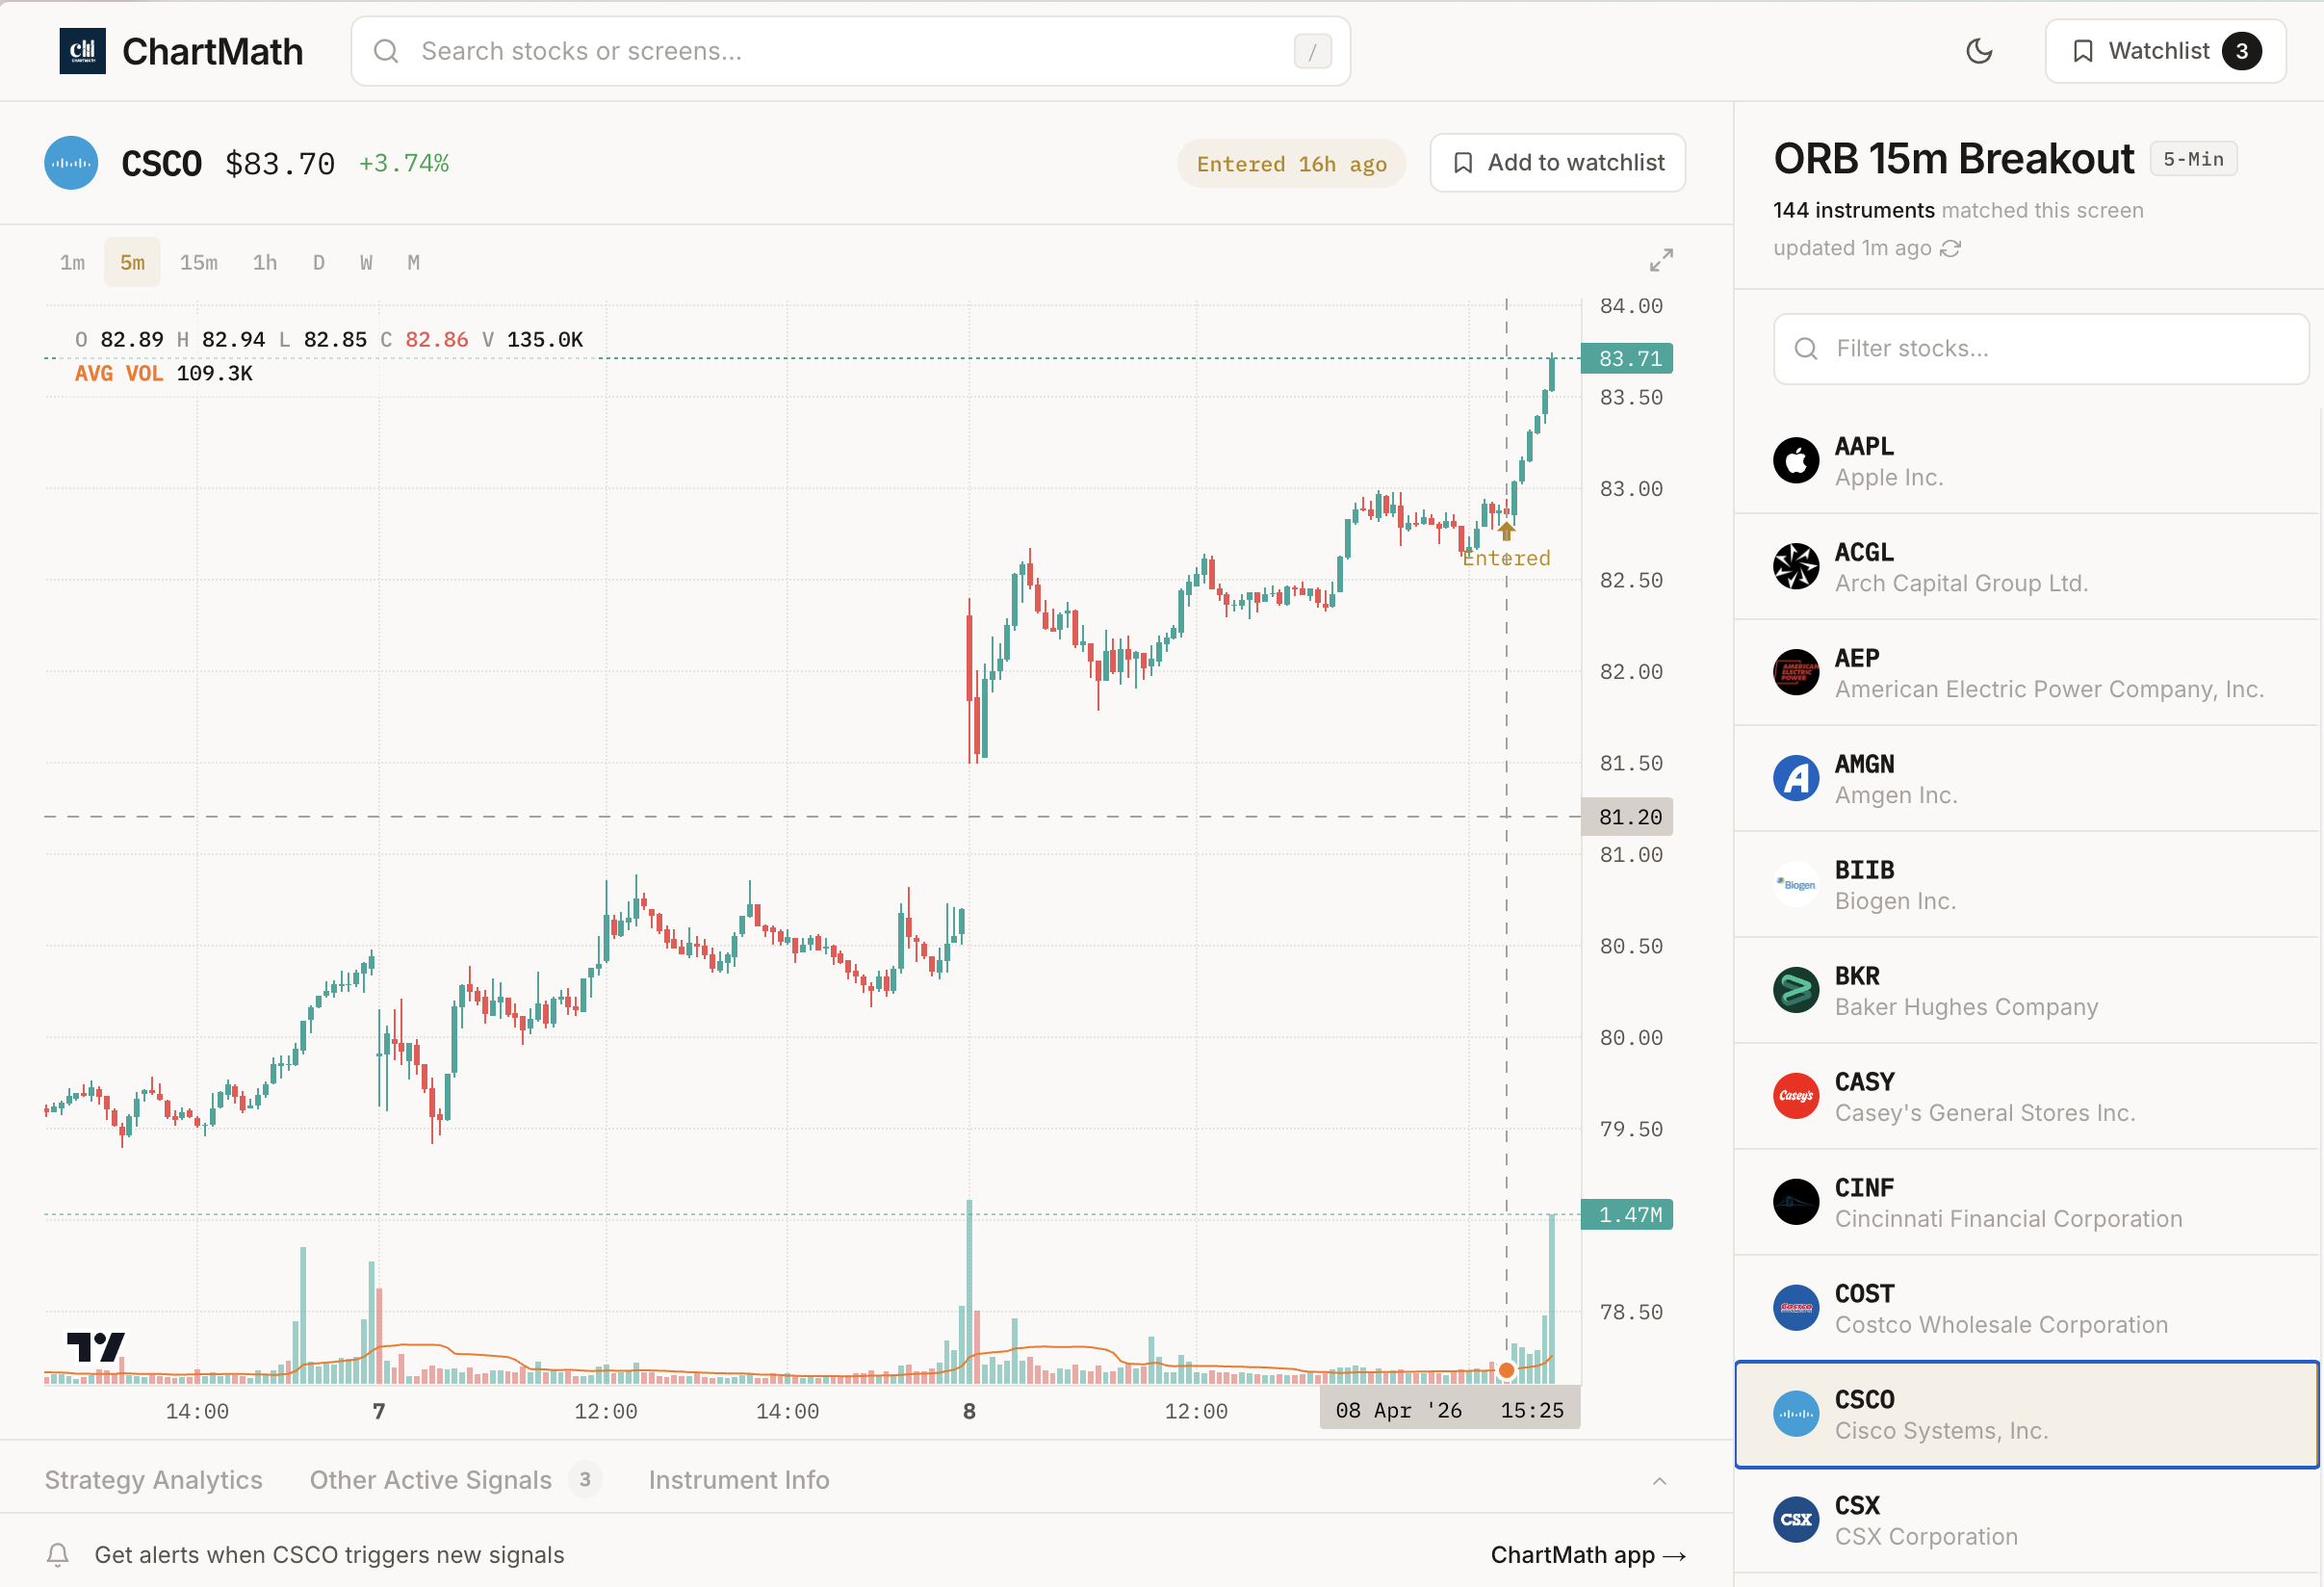
The Opening Range Breakout (ORB) is one of the most popular intraday trading strategies. The concept is simple: the first 5, 15, or 30 minutes of trading establishes a range. When price breaks above the high or below the low of that range with conviction, it often continues in that direction.
What makes a valid ORB setup:
- Clear range definition: The opening period should show consolidation, not wild swings
- Volume confirmation: The breakout candle should have above-average volume
- Decisive break: Price should close above/below the range, not just wick through it
- Continuation: The next 1-2 candles should confirm the direction
For ORB trades, typical profit targets are 1.5-2x the opening range height, with stops placed just inside the range. On a 5-minute chart, if the opening range is $1 wide, you might target $1.50-$2.00 in profit with a $0.30-$0.50 stop loss.
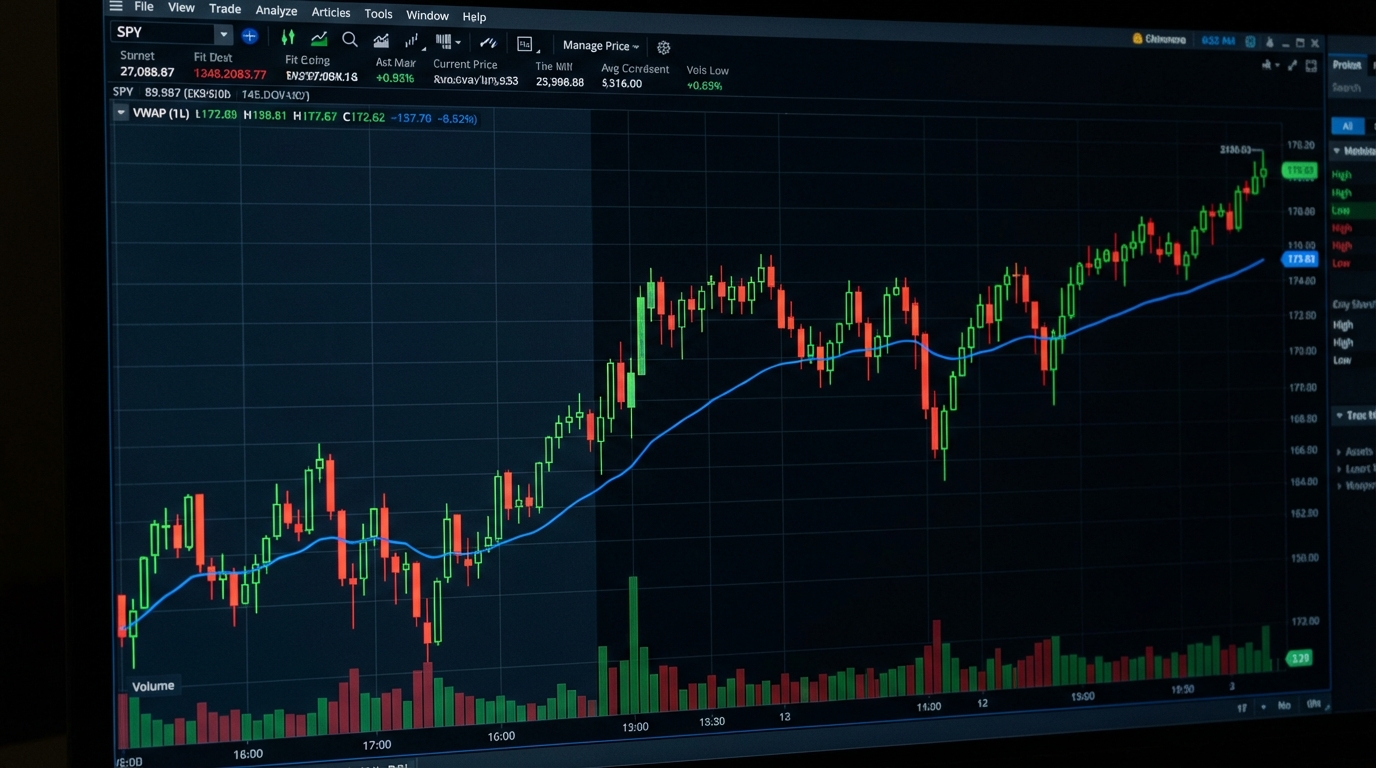
Spotting VWAP Reclaims in Real-Time
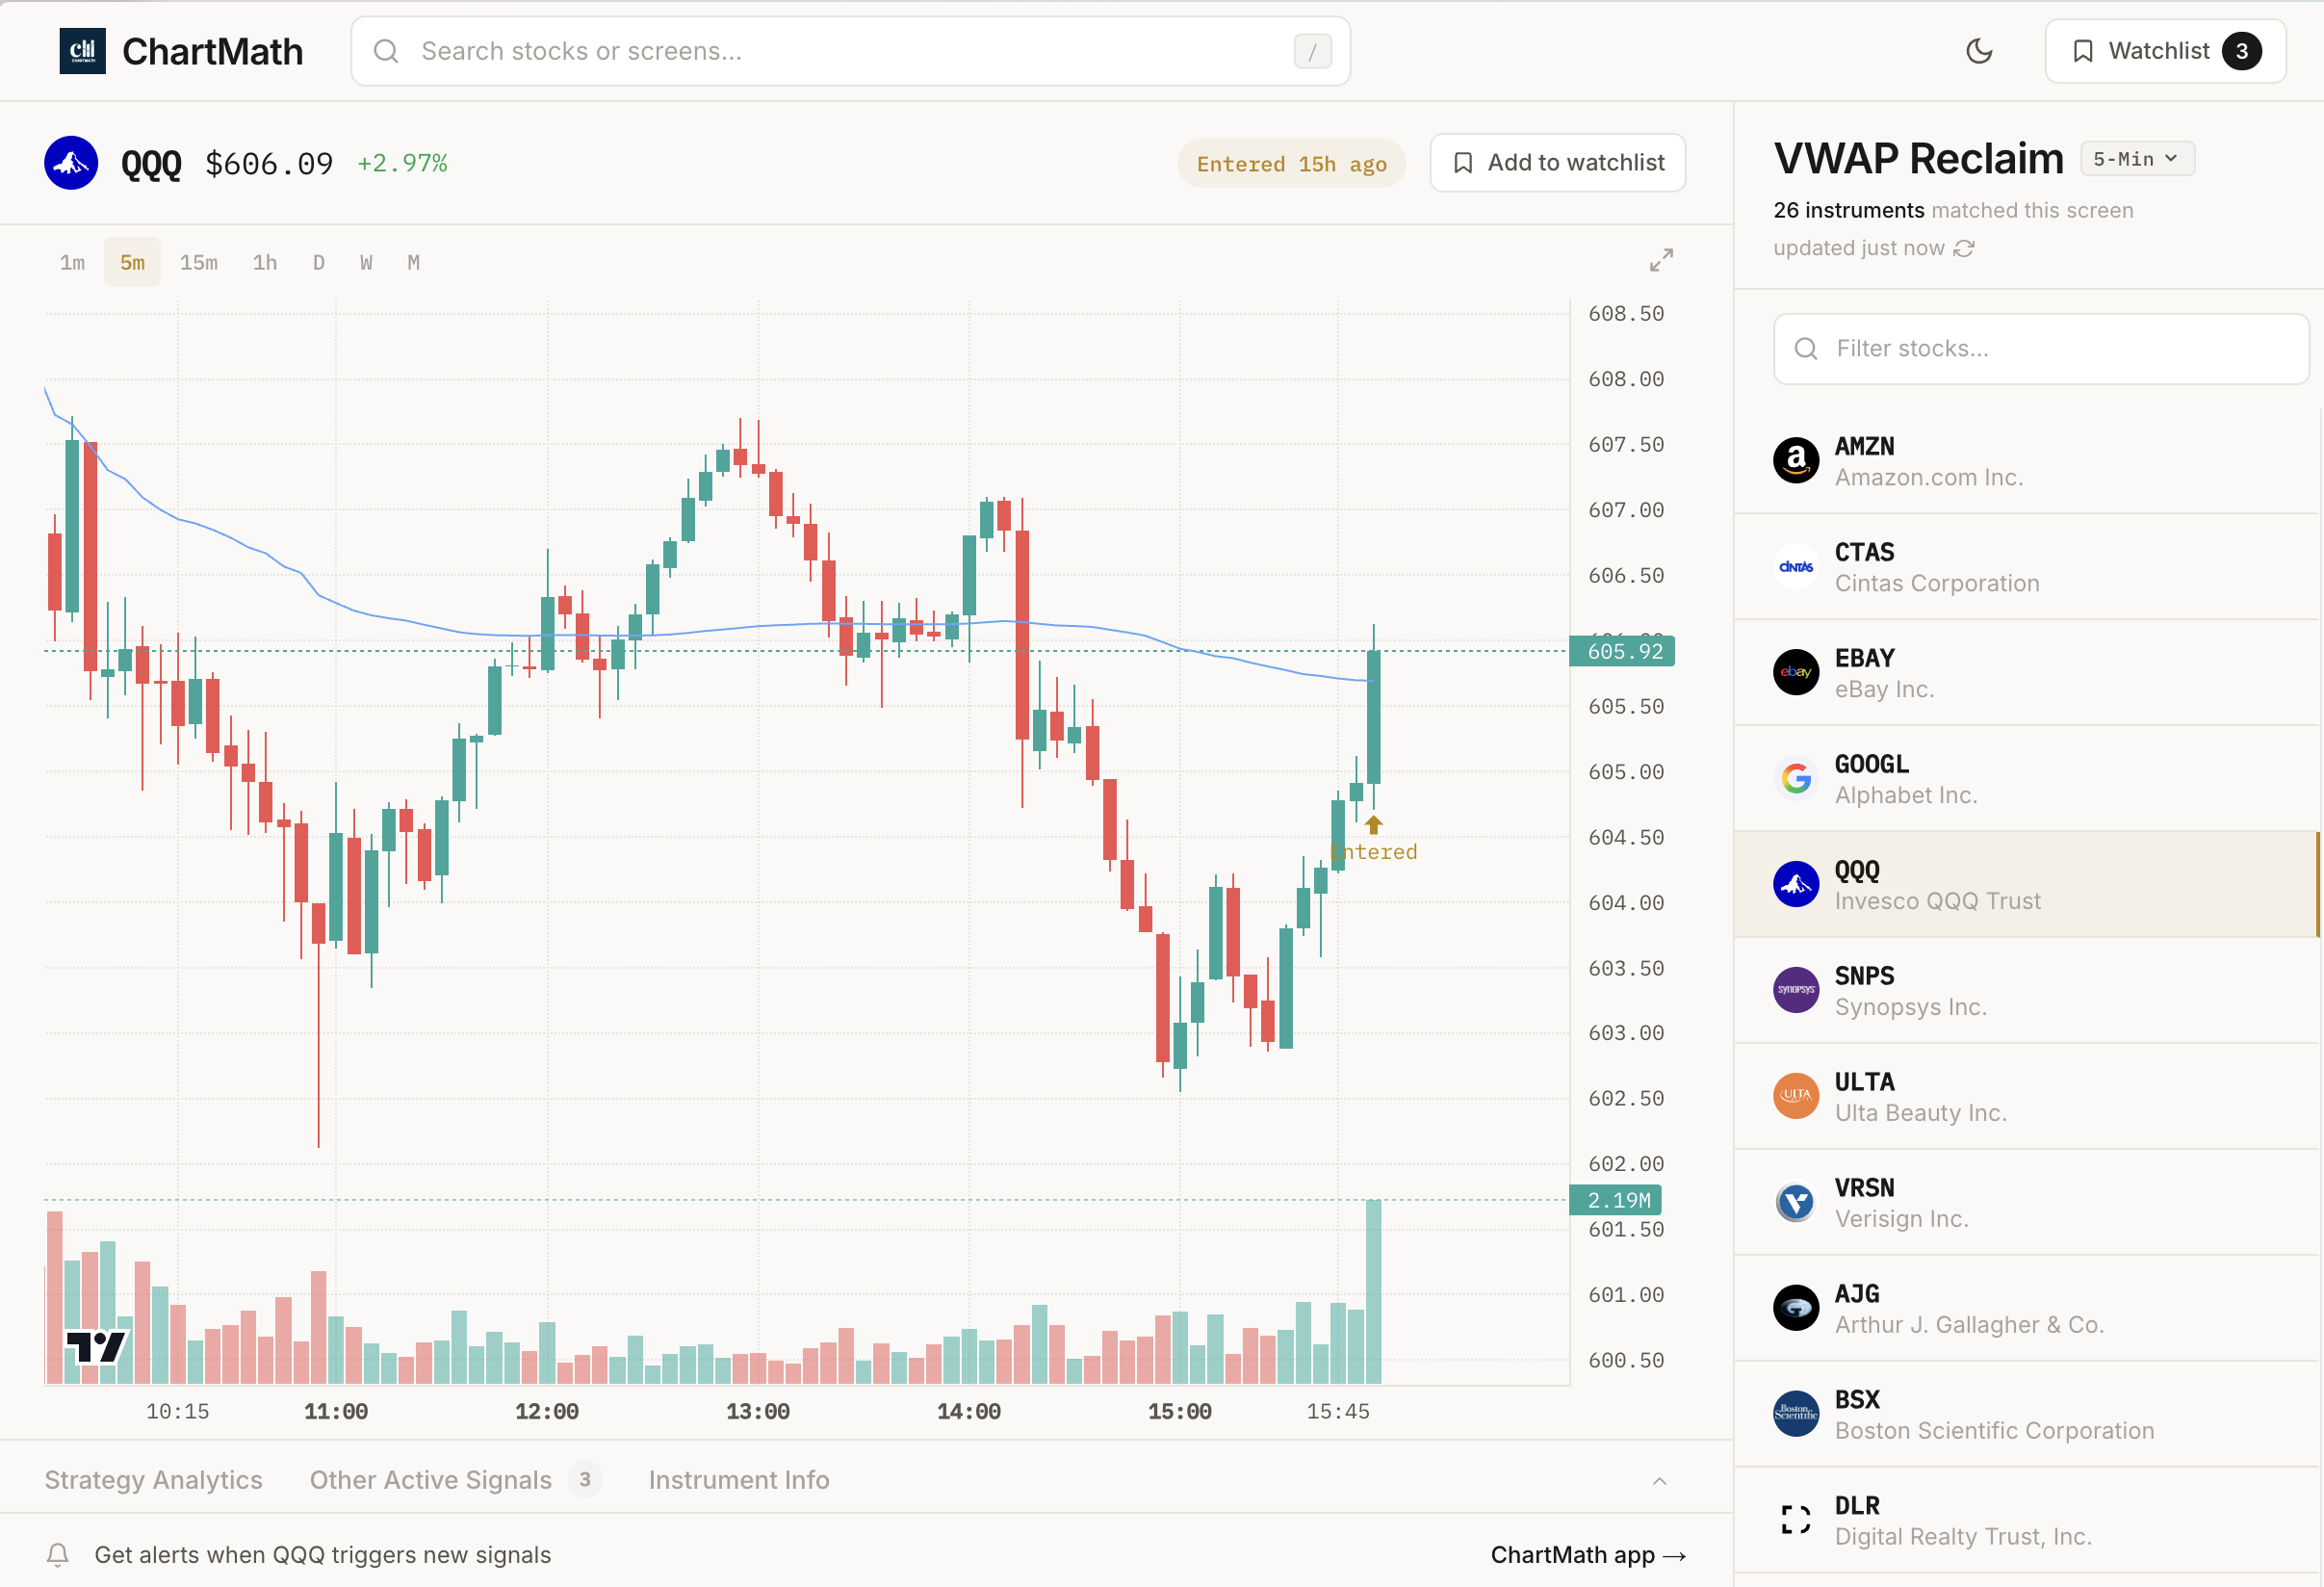
VWAP (Volume Weighted Average Price) acts as a dynamic support and resistance level that institutional traders watch closely. When a stock pulls back to VWAP and then reclaims it with strong volume, it often signals renewed buying interest.
Key elements of a VWAP reclaim setup:
- Initial move away from VWAP: Stock should have been trading above VWAP earlier in the session
- Pullback to VWAP: Price comes back down and tests VWAP as support
- Volume surge on reclaim: When price crosses back above VWAP, volume should increase
- Confirmation candle: The candle that reclaims VWAP should close strong, ideally near its high
The best times for VWAP plays are typically during the first hour of trading and the final hour (power hour), when volume and volatility are highest. Multiple timeframe analysis helps confirm the setup—if VWAP is being reclaimed on both the 5-minute and 15-minute charts simultaneously, the signal is stronger.
Beyond ORB and VWAP, other high-probability intraday trading setups include:
- RVOL spikes: Stocks showing 2x or 3x their average volume, indicating unusual interest
- Breakout patterns: Bull flags, ascending triangles, and consolidation breaks on 15-minute charts
- Momentum continuation: Stocks making new highs with increasing volume
The challenge is identifying these setups across hundreds of stocks in real-time. This is where automated screening becomes essential. Learn more about which technical indicators work best for different market conditions and trading styles.
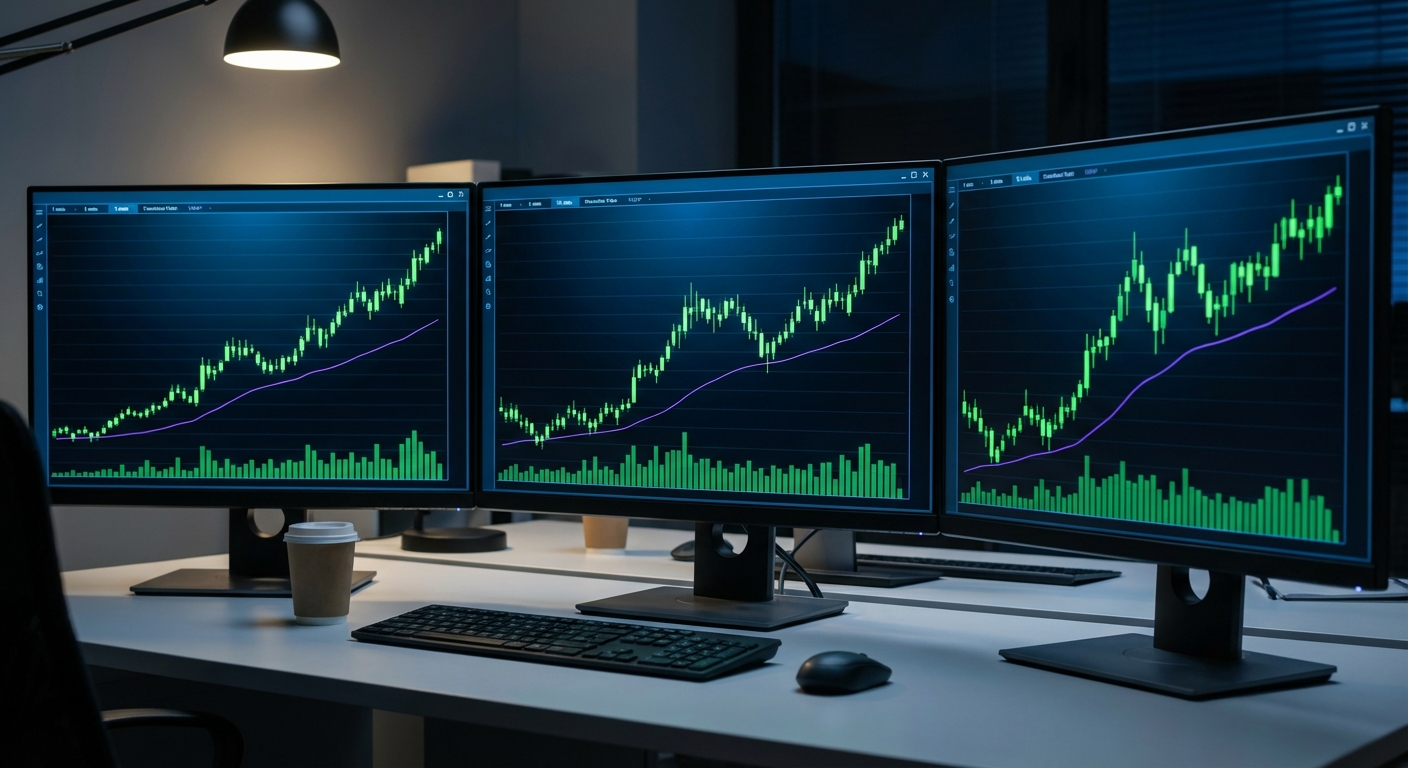
3. Execute Multi-Timeframe Analysis for Intraday Trading
One of the biggest mistakes new intraday traders make is focusing on a single timeframe. A setup that looks perfect on a 1-minute chart might be trading into resistance on the 15-minute chart. Multi-timeframe analysis gives you context and dramatically improves your win rate.
The top-down approach works like this:
- Daily chart: Identify the overall trend and key support/resistance levels. Is the stock in an uptrend, downtrend, or range?
- 15-minute chart: Look for the intraday trend and larger patterns. Is the stock making higher highs and higher lows today?
- 5-minute chart: Identify specific setup patterns (ORB, VWAP reclaim, breakout from consolidation)
- 1-minute chart: Fine-tune your entry timing. Wait for a strong candle close or volume confirmation before entering
Here's a practical example: You receive an alert that a stock just broke above its 15-minute opening range. Before entering, you check:
- Daily chart: Stock is above its 20-day moving average and not at a major resistance level ✓
- 15-minute chart: Clean breakout above opening range with volume ✓
- 5-minute chart: Multiple green candles confirming momentum ✓
- 1-minute chart: Wait for a pullback to the breakout level, then enter when price bounces with volume ✓
This alignment across timeframes significantly increases the probability of success. When all timeframes agree, you have conviction to size up your position. When they conflict, you either pass on the trade or reduce your size.
Common mistakes when switching between timeframes include:
- Entering on a lower timeframe signal that contradicts the higher timeframe trend
- Ignoring major support/resistance levels visible on daily charts
- Getting shaken out of good trades by noise on 1-minute charts when the 15-minute setup is still intact
- Overcomplicating analysis by looking at too many timeframes simultaneously
Keep it simple: use higher timeframes for direction and context, lower timeframes for entry timing. This approach is covered in detail in our guide on building an efficient trading workflow.
4. Manage Risk and Position Sizing
Even the best intraday trading setups fail sometimes. The difference between profitable traders and those who blow up their accounts comes down to risk management.
The foundational rule: never risk more than 1-2% of your account on a single trade. If you have a $50,000 account, that means your maximum loss on any trade should be $500-$1,000. This ensures that even a string of losses won't devastate your capital.
Here's how to calculate position size:
- Determine your account risk: $50,000 × 1% = $500 maximum loss
- Identify your stop-loss distance: Entry at $25.00, stop at $24.50 = $0.50 risk per share
- Calculate shares: $500 ÷ $0.50 = 1,000 shares
- Verify total position size: 1,000 shares × $25.00 = $25,000 position (50% of account)
For intraday trading on short timeframes, stops are typically tight—often 10-30 cents on lower-priced stocks or 0.5-1% on higher-priced stocks. This allows you to take larger positions while keeping dollar risk controlled.
Scaling in and out of positions is an advanced technique that can improve your risk-reward ratio. Instead of entering your full position at once, you might:
- Enter 50% of your planned position on the initial signal
- Add the remaining 50% if the setup confirms (price continues in your direction)
- Take partial profits at your first target (sell 50% of shares)
- Let the remaining position run with a trailing stop
When managing multiple concurrent positions, your total account risk should still stay within reasonable bounds. If you're trading three setups simultaneously, you might risk 0.75% on each rather than 2%, keeping total exposure at 2.25% of your account.
The most important rule: cut losses quickly on failed setups. If a stock breaks your stop level or the setup invalidates (for example, an ORB breaks back into the opening range), exit immediately. Don't hope it comes back. Intraday trading requires discipline to take small losses and let winners run.
5. Time Your Entries and Exits
In intraday trading, when you trade is almost as important as what you trade. Different times of day offer different opportunities and challenges.
Best times for intraday trading:
- 9:30-11:00 AM ET (Market Open): Highest volume and volatility. ORB setups, gap-and-go plays, and momentum breakouts are most common. This is prime time for active intraday trading.
- 3:00-4:00 PM ET (Power Hour): Volume picks up again as institutions adjust positions and day traders close out. VWAP reclaims and breakout continuations work well.
- 10:00-10:30 AM ET: Secondary opportunity window after the initial morning rush settles. Stocks that held their morning gains often make another leg higher.
Times to avoid:
- 11:00 AM - 2:00 PM ET (Midday Chop): Volume dries up, ranges contract, and price action becomes choppy and unpredictable. Many professional day traders step away during this period.
- First 5 minutes (9:30-9:35 AM): Extremely volatile with wide spreads. Wait for the initial frenzy to settle before entering positions.
Entry triggers should be specific and predefined. Don't enter just because a stock is "moving." Wait for:
- Breakout confirmation: Price closes above resistance on your chosen timeframe
- Volume surge: Current candle volume is 1.5-2x the recent average
- Price action confirmation: Strong candle close near the high (for long setups)
Exit strategies are equally important. Before entering any trade, know exactly where you'll exit. Common approaches include:
- Fixed profit targets: Based on the setup (e.g., 2x the opening range for ORB trades)
- Trailing stops: Move your stop up as price moves in your favor, locking in profits
- Time-based exits: Close all positions by 3:45 PM to avoid overnight risk
- Technical exits: Exit when price breaks below VWAP or a key moving average
Many successful intraday traders use a combination: take partial profits at a fixed target, then trail a stop on the remainder. This approach captures quick gains while allowing for larger wins when momentum continues.
6. Automate Your Intraday Trading Workflow
Here's the uncomfortable truth: manual scanning doesn't scale for intraday trading. By the time you've checked 20 stocks across three timeframes, dozens of setups have already formed and resolved on stocks you never looked at.
Professional intraday traders in 2026 rely on automation to level the playing field. This doesn't mean algorithmic trading or complex coding, it means using tools that continuously monitor the market and alert you when your specific criteria are met.
What to automate in your intraday trading workflow:
- Market scanning: Software that watches hundreds of stocks simultaneously for ORB breaks, VWAP reclaims, RVOL spikes, and breakout patterns
- Alert delivery: Real-time notifications sent to your phone when setups form, so you don't miss opportunities during meetings or away from your desk
- Setup validation: Backtested performance data that shows which setups have historically worked, helping you filter high-probability trades from noise
- Watchlist monitoring: Automatic tracking of your favorite stocks with alerts when they meet your technical criteria
ChartMath was built specifically to solve this problem for intraday traders. The platform scans 200+ technical screens in real-time across all timeframes, 1-minute, 5-minute, 15-minute, hourly, and daily. When a stock matches a proven setup like an ORB break or VWAP reclaim, you receive a mobile alert with:
- Plain-English explanation of what triggered the signal
- Backtested win rate and average return for that specific setup
- Chart snapshot showing the current price action
- Quality ranking so you can prioritize the best opportunities
The mobile-first approach means you stay connected to opportunities even when you're not at your trading desk. The TikTok-style swipe interface lets you quickly review setups, add them to watchlists, or dismiss them, all in seconds.
This automation doesn't replace your analysis or decision-making. Instead, it handles the tedious work of continuous monitoring, freeing you to focus on execution and risk management. You still make the final call on every trade, but now you're working from a curated feed of high-probability setups rather than manually hunting through charts.
Alert fatigue is a real problem with most scanning tools. You don't want 100 notifications per day for low-quality setups. ChartMath addresses this by ranking signals based on backtest performance and freshness, so the best opportunities rise to the top. You can also customize which screens you follow and set filters for minimum volume, price range, or other criteria.
For more on integrating alerts into your workflow, check out our guide on how to integrate trading alerts with your charting platform.
7. Track Performance and Refine Your Approach
The only way to improve at intraday trading is through systematic performance tracking and analysis. Every trade, win or lose, contains lessons that can refine your approach.
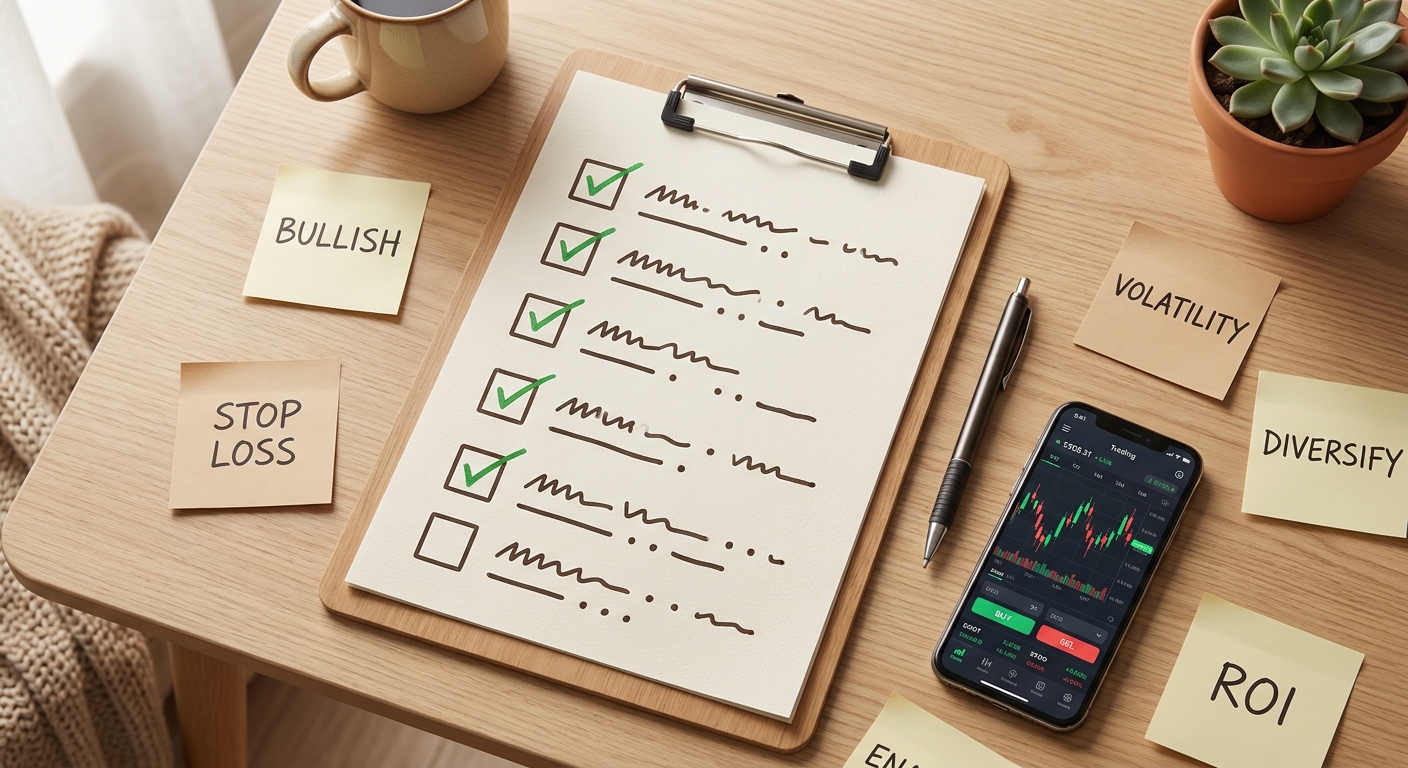
Keep a detailed trading journal that records:
- Date and time of trade
- Stock symbol and setup type (ORB, VWAP reclaim, breakout, etc.)
- Entry price, exit price, and position size
- Timeframe used for entry signal
- Reason for entry (what you saw in the setup)
- Reason for exit (target hit, stop hit, time-based, etc.)
- Profit/loss in dollars and percentage
- Screenshots of the chart at entry and exit
- Notes on what went right or wrong
Metrics that matter for intraday trading:
- Win rate: Percentage of trades that are profitable. For intraday trading, 50-60% is solid.
- Average return: Your average profit on winning trades vs. average loss on losing trades. You want winners to be larger than losers.
- Expectancy: The average amount you expect to make per trade. Calculated as: (Win Rate × Avg Win) - (Loss Rate × Avg Loss)
- Maximum drawdown: The largest peak-to-trough decline in your account. Helps you understand worst-case scenarios.
- Profit factor: Gross profits divided by gross losses. Above 1.5 is good, above 2.0 is excellent.
After 20-30 trades, patterns will emerge. You might discover that your ORB trades have a 65% win rate while your midday breakout trades only win 40% of the time. Or that your 15-minute setups perform better than your 5-minute setups. This data tells you where to focus your energy.
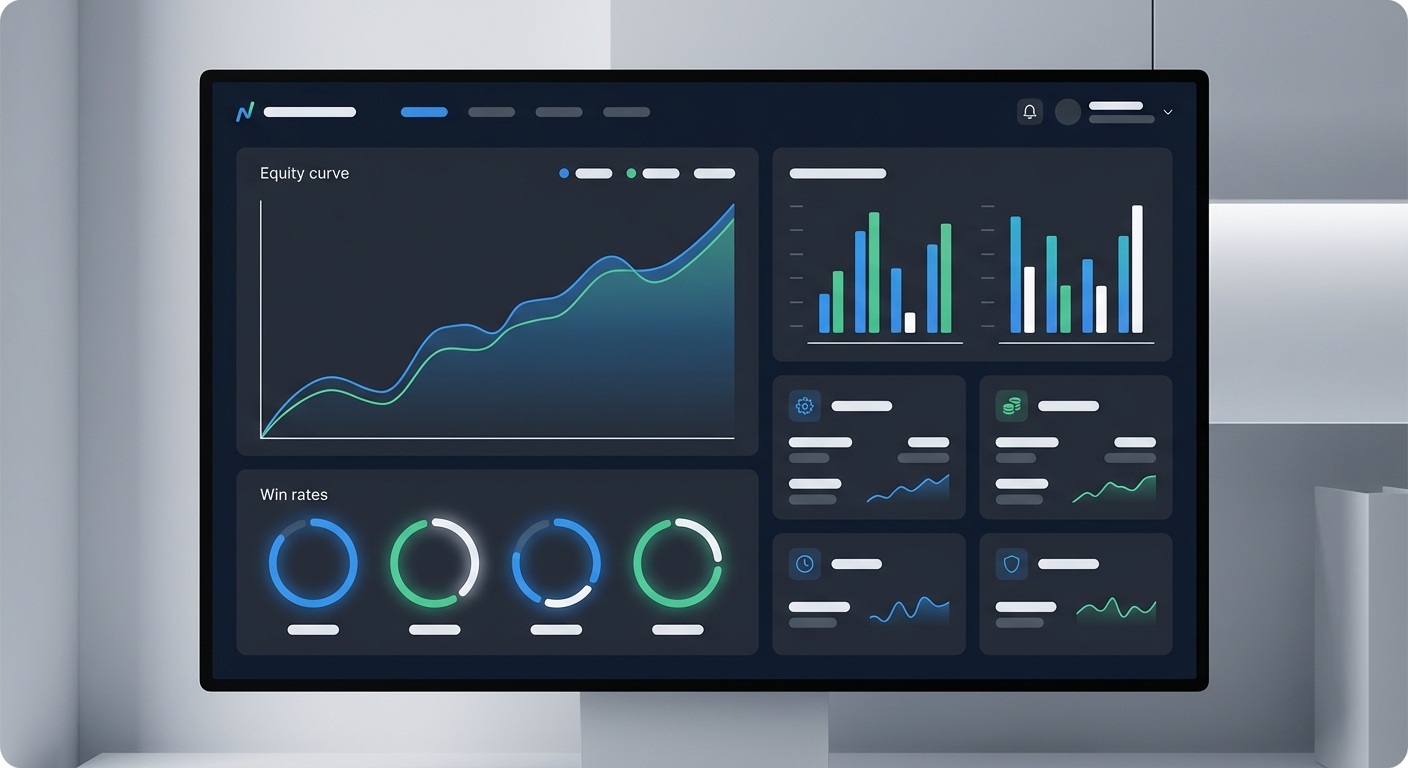
ChartMath provides backtested performance data for every screen, showing historical win rates, average returns, and sample sizes across different exit strategies. This allows you to compare your personal results against the historical baseline. If a setup has a 58% win rate historically but you're only winning 35% of the time with it, that's a signal to either improve your execution or stop trading that setup.
Continuous improvement comes from:
- Reviewing your journal weekly to identify patterns
- Focusing on your highest-performing setups and timeframes
- Eliminating or reducing exposure to setups that consistently lose money
- Refining your entry and exit timing based on what the data shows
- Adjusting position sizing based on setup quality and your confidence level
For a deeper dive into using data to improve your trading, read our complete guide on building winning backtesting strategies.
Common Intraday Trading Mistakes to Avoid
Even experienced traders fall into these traps. Awareness is the first step to avoiding them.
Overtrading and chasing every setup: Just because a stock is moving doesn't mean you should trade it. Stick to your predefined setups and criteria. Quality over quantity always wins in intraday trading.
Ignoring volume confirmation: A breakout without volume is a false breakout waiting to happen. Always check that volume supports the price move before entering.
Trading without a plan or predefined exits: Hope is not a strategy. Know your profit target and stop loss before you enter. Deciding in the moment leads to emotional decisions and losses.
Letting winners turn into losers: If a trade moves in your favor and hits your profit target, take at least partial profits. Don't watch a $500 winner turn into a $200 loser because you got greedy.
Revenge trading after losses: Taking a loss triggers emotional responses. The urge to "make it back" on the next trade leads to impulsive decisions and larger losses. Step away, review what happened, and only re-enter when you have a valid setup.
Missing setups due to manual monitoring limitations: This is perhaps the most common and costly mistake. You can't watch everything at once. The best intraday trading opportunities often happen on stocks you weren't monitoring. Automated screening solves this problem by ensuring you never miss a setup that meets your criteria.
The traders who succeed at intraday trading are those who treat it as a business: systematic, disciplined, data-driven, and continuously improving. They don't rely on luck or gut feelings. They have processes, they track results, and they adapt based on evidence.
Start Executing Better Intraday Trading Setups Today
Successful intraday trading comes down to a repeatable process: proper workspace setup, identifying high-probability setups like ORB breaks and VWAP reclaims, analyzing multiple timeframes for confirmation, managing risk with disciplined position sizing, timing entries and exits strategically, automating your workflow to catch opportunities in real-time, and tracking performance to continuously refine your approach.
The difference between traders who consistently profit and those who struggle isn't talent or luck, it's having systems in place that surface opportunities as they happen and provide the data needed to make informed decisions quickly.
Manual scanning and chart-watching can't keep pace with modern markets. By the time you've checked your watchlist, the best intraday trading setups have already moved. You need automation that works for you, monitoring hundreds of stocks across multiple timeframes and alerting you only when high-probability setups form.
ChartMath was built specifically for this challenge. The platform continuously scans 200+ technical screens for intraday trading setups including ORB breaks, VWAP reclaims, RVOL spikes, and momentum breakouts across 1-minute, 5-minute, and 15-minute timeframes. Every alert includes backtested performance data showing historical win rates and average returns, so you can focus on setups with proven edge. The mobile-first interface delivers ranked signals directly to your phone, keeping you connected to opportunities even when you're away from your desk.
Ready to stop missing intraday trading opportunities? Watch a demo to see how ChartMath scans the market in real-time and surfaces high-probability setups with backtested data. Or download the app and start discovering better intraday trading setups today. Your next winning trade might be forming right now, make sure you don't miss it.

Ankush Jindal
LinkedInSee these setups live in ChartMath
200+ curated screens with backtest data. 14-day free trial.