Premarket Trading: 7 Strategies to Find High-Probability Setups

Table of Contents
You've set your alarm for 5:30 AM, grabbed your coffee, and opened your trading platform—only to watch a stock you've been tracking gap up 12% before you even had a chance to react. Sound familiar? Premarket trading is where the real edge lives, but most traders miss it because they don't know what to look for or how to scan for high-probability setups before the opening bell.
The truth is, premarket price action often telegraphs the day's momentum. Institutional traders position themselves early, volume spikes reveal genuine interest, and technical patterns form before retail traders flood the market at 9:30 AM. If you're not monitoring premarket activity, you're essentially trading with one eye closed.
This guide will teach you seven proven premarket trading strategies to identify high-probability setups using RVOL, gap scanners, momentum signals, and backtest data. You'll learn how to validate setups, set up intelligent alerts, and time your entries—so you never miss another early-morning breakout, even when you're away from your screens.
What Is Premarket Trading and Why It Matters
Premarket trading refers to the buying and selling of stocks before the regular market session opens at 9:30 AM Eastern Time. Most brokers allow premarket trading between 4:00 AM and 9:30 AM ET, though liquidity is typically highest after 7:00 AM when institutional traders become more active.
Why does premarket activity matter? Because it reveals where smart money is positioning before the crowd arrives. When a stock shows strong volume and directional movement in premarket hours, it often continues that momentum into the regular session. Earnings announcements, FDA approvals, analyst upgrades, and breaking news all hit during premarket hours, creating opportunities for traders who know how to scan for them.
Here's what makes premarket trading different from regular hours:
- Lower liquidity: Fewer participants mean wider spreads and potentially more volatility
- Institutional positioning: Large funds and professional traders establish positions before retail traders wake up
- Catalyst-driven moves: Most significant news breaks before the market opens, creating immediate price reactions
- Predictive value: Strong premarket momentum often carries into the first 30-60 minutes of regular trading
The biggest misconception about premarket trading is that it's too risky or unpredictable. While it's true that lower volume can create wider spreads, the real risk is not having a systematic approach to identify which premarket movers have genuine edge versus which are low-float pump-and-dumps destined to fade.
That's where technical indicators, scanners, and backtest data become essential. Let's dive into the specific strategies that separate profitable premarket traders from those who chase every gap-up blindly.
1. Scan for High RVOL Premarket Movers
Relative Volume (RVOL) is one of the most powerful filters for premarket trading. RVOL compares current volume to the average volume at the same time of day, giving you a normalized measure of unusual activity. A stock trading at 3x its normal premarket volume is telling you something important is happening.
Here's how to use RVOL effectively in your premarket scanning:
Set meaningful RVOL thresholds. Not all volume spikes are created equal. A 2x RVOL might indicate moderate interest, but 5x or higher typically signals a significant catalyst. Start with a minimum threshold of 2.5x RVOL and adjust based on your trading style. Day traders looking for explosive moves might require 5x+, while swing traders might accept 2-3x for more gradual momentum builds.
Combine RVOL with price filters. A penny stock with 10x RVOL might just be a pump scheme, while a $20+ stock with 4x RVOL and a legitimate news catalyst is worth investigating. Filter for stocks above $5 (preferably $10+) to avoid low-quality setups with wide spreads and manipulation risk.
Check the catalyst. High RVOL without a clear reason is a red flag. Look for earnings reports, FDA announcements, analyst upgrades, merger news, or sector-wide momentum. Tools like stock screeners for day trading can help you quickly identify the catalyst behind volume spikes.
Real-world example: A biotech stock announces positive Phase 3 trial results at 7:00 AM. Within 15 minutes, RVOL hits 8x with the stock gapping up 18%. Traders who had RVOL alerts configured caught this move before it ran another 12% in the first hour of regular trading. Those who waited until 9:30 AM paid significantly higher prices or missed the move entirely.
The key is automation. Manually refreshing scanners every few minutes is inefficient and causes you to miss time-sensitive opportunities. Platforms like ChartMath continuously scan for RVOL spikes across thousands of stocks and send push alerts the moment setups form, so you can act quickly even if you're not glued to your screen.
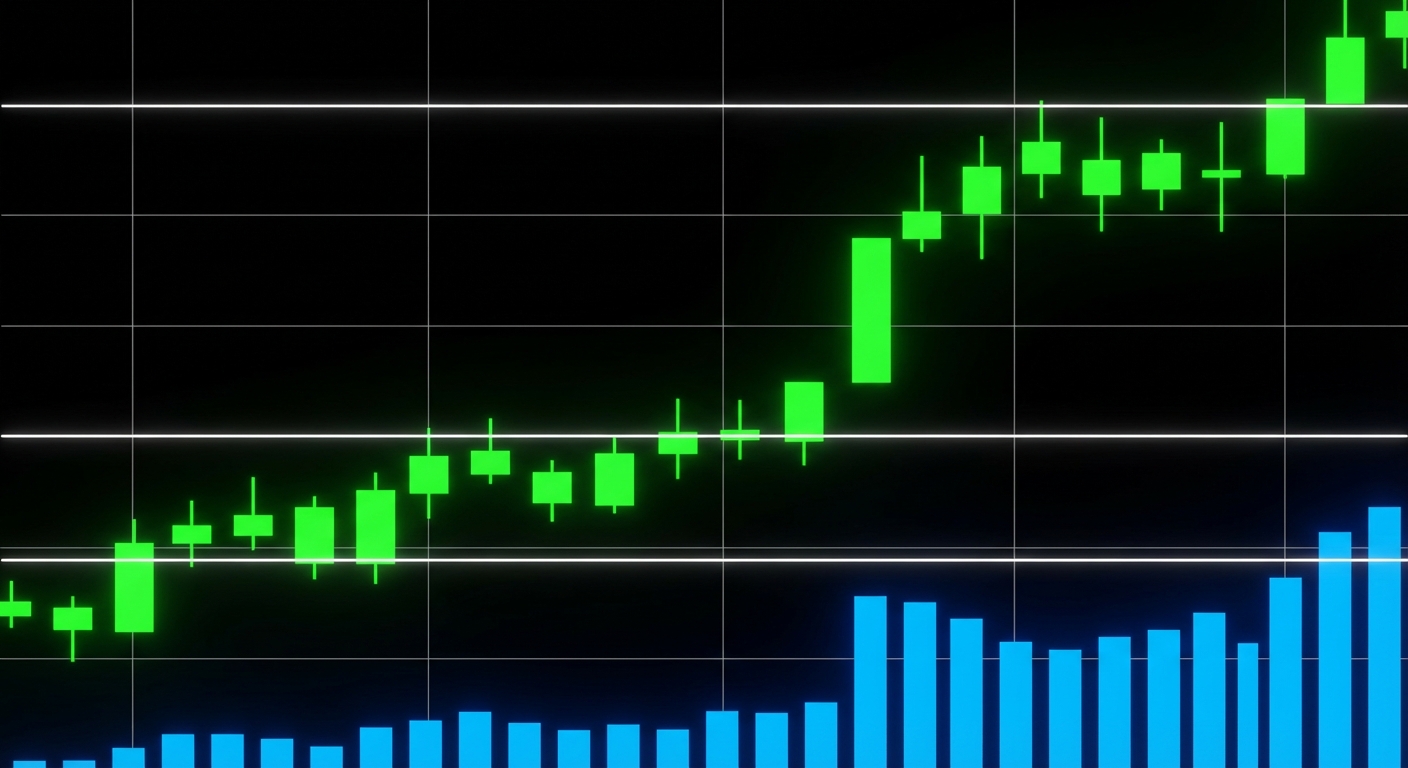
2. Identify Gap-and-Go Setups with Premarket Scanners
A gap-up occurs when a stock opens significantly higher than its previous close, creating a visible "gap" on the chart. Gap-and-go setups are among the most reliable premarket trading patterns because they combine momentum, catalyst, and technical confirmation.
Not all gaps are profitable. Here's how to distinguish high-probability gap-and-go setups from "gap-and-crap" patterns that fade immediately:
Measure the gap percentage. Small gaps (1-3%) often fill quickly and lack conviction. Look for gaps of 5%+ on stocks with clear catalysts. The larger the gap, the more significant the news or sentiment shift driving it. However, extremely large gaps (20%+) can be overextended and prone to profit-taking.
Validate with support and resistance. The best gap-ups occur when the stock gaps above a key resistance level, turning that level into new support. If a stock gaps up but is still below major resistance, it may struggle to maintain momentum. Use previous day's high, weekly pivots, or round numbers as reference points.
Confirm with premarket volume. A gap-up on thin volume is suspect. You want to see sustained buying pressure with volume at least 2-3x normal premarket levels. This indicates genuine interest rather than a few large orders creating artificial price movement.
Watch for consolidation patterns. The strongest gap-and-go setups consolidate in a tight range during premarket hours, then break out in the first 15-30 minutes of regular trading. This consolidation allows early buyers to establish positions and creates a launching pad for the next leg higher.
Setting up your gap scanner requires specific criteria. Most platforms allow you to filter for:
- Gap percentage (e.g., 5% or higher)
- Price range (e.g., $10-$500 to avoid penny stocks and ultra-high-priced names)
- Minimum premarket volume (e.g., 50,000+ shares)
- Market cap filters to focus on liquid, tradable stocks
The challenge with traditional scanners is they require constant manual refreshing. By the time you check your scanner, the setup may have already moved. This is why integrating trading alerts with your workflow is critical for premarket success.
3. Use Technical Indicators to Validate Premarket Setups
Volume and gap size tell you what is happening, but technical indicators tell you whether it's sustainable. Applying the right indicators to premarket charts helps you filter out false signals and focus on setups with genuine edge.
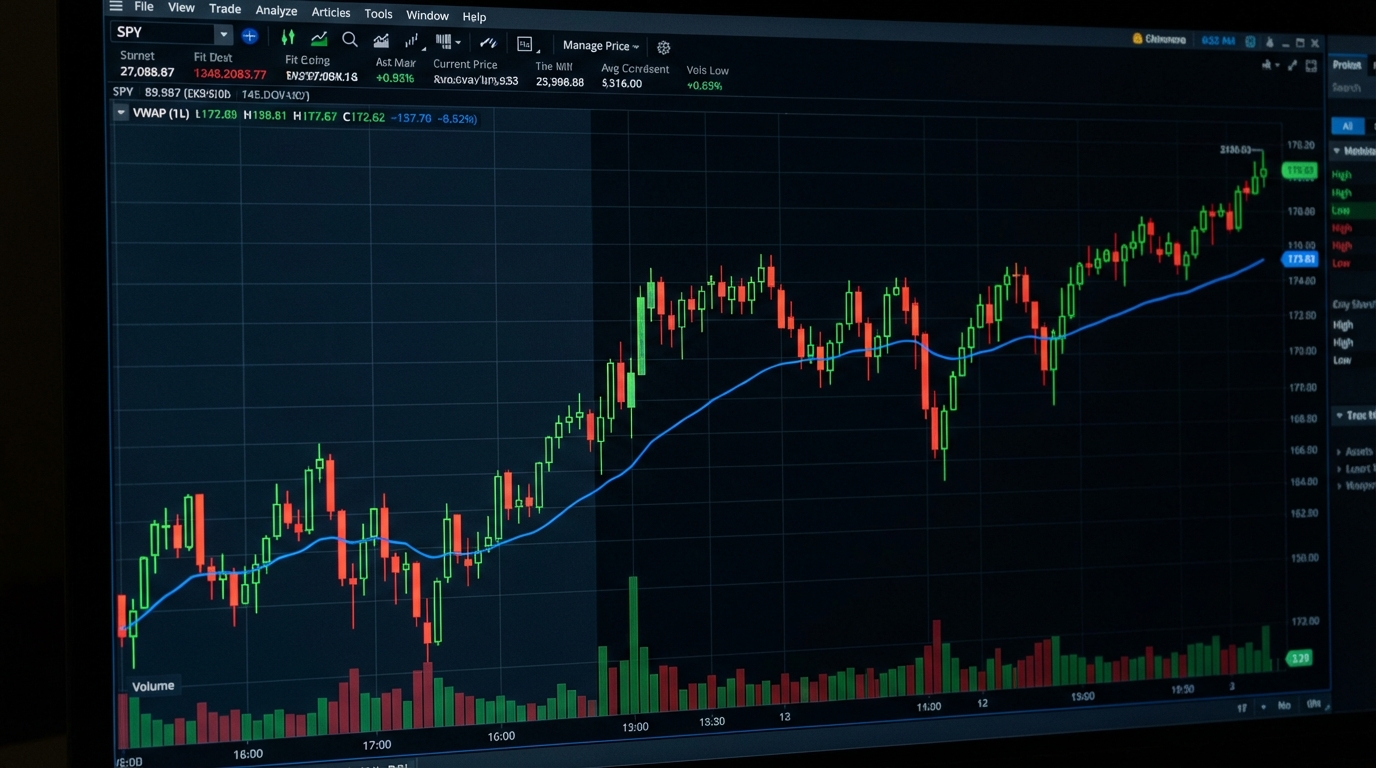
VWAP (Volume-Weighted Average Price) is essential for premarket analysis. VWAP represents the average price weighted by volume, giving you a dynamic support/resistance level. Stocks trading above premarket VWAP show buying pressure and institutional accumulation. Stocks below VWAP are under distribution pressure. Many professional traders use VWAP as their primary entry and exit reference point. Learn more about VWAP trading strategies to master this indicator.
Support and resistance from the previous session remain relevant in premarket hours. If a stock gaps up to exactly the previous day's high and stalls, that's a warning sign. If it gaps through resistance and holds above it, that's bullish confirmation. Mark key levels on your charts before the premarket session begins.
Moving averages on shorter timeframes help identify momentum shifts. The 9-period and 21-period exponential moving averages (EMAs) on 5-minute and 15-minute charts can signal trend direction. When price is above both EMAs and they're sloping upward, momentum is strong. Crossovers can signal entry or exit points.
RSI and momentum oscillators reveal overbought or oversold conditions. An RSI above 70 in premarket suggests the move may be overextended and due for a pullback. RSI below 30 indicates potential reversal opportunity. However, in strong trending moves, RSI can remain overbought for extended periods, so use it in conjunction with price action and volume.
How to Validate Premarket Trading Setups
Technical indicators are only part of the equation. Proper validation requires a multi-factor approach:
Check for news catalysts. Use financial news terminals, broker research, or aggregator sites to confirm why the stock is moving. Earnings beats, FDA approvals, analyst upgrades, and acquisition rumors are legitimate catalysts. Social media hype without substance is not.
Verify float size and short interest. Low-float stocks (under 20 million shares) can move explosively on relatively small volume, but they're also prone to manipulation and sharp reversals. High short interest (15%+) can fuel short squeezes, adding rocket fuel to premarket moves. Know what you're trading.
Review historical price action. How has this stock behaved at current price levels in the past? Is it breaking out to new highs, or is it simply returning to a level it's rejected multiple times before? Context matters.
Use multiple timeframes. Don't just look at the 5-minute chart. Check the daily and weekly charts to understand the bigger picture. A premarket gap-up that's still below the 200-day moving average faces different dynamics than one breaking out to all-time highs.
For traders who want to understand which technical setups actually work, exploring proven technical setups with historical performance data is invaluable.
4. Set Up Real-Time Premarket Alerts
Here's the problem with manual scanning: you can't watch every stock, every minute, especially during early morning hours when you might be commuting, exercising, or getting ready for the day. Real-time premarket alerts solve this by monitoring the market for you and notifying you the instant high-probability setups form.
Effective alert systems should trigger based on specific, actionable criteria:
- RVOL spike alerts: Notify when a stock hits 3x, 5x, or 10x relative volume
- Gap threshold alerts: Trigger when stocks gap up or down by your specified percentage
- Price breakout alerts: Alert when price breaks above premarket high or key resistance levels
- Technical pattern alerts: Notify when specific patterns form (bull flags, ascending triangles, etc.)
The challenge is alert fatigue. If your system sends 50 notifications before 9:00 AM, you'll start ignoring them. Quality over quantity is essential. This means:
- Setting appropriate thresholds that filter out noise
- Prioritizing alerts by quality score or backtest performance
- Customizing alerts to match your trading style and timeframes
- Using plain-English explanations so you understand why each alert triggered
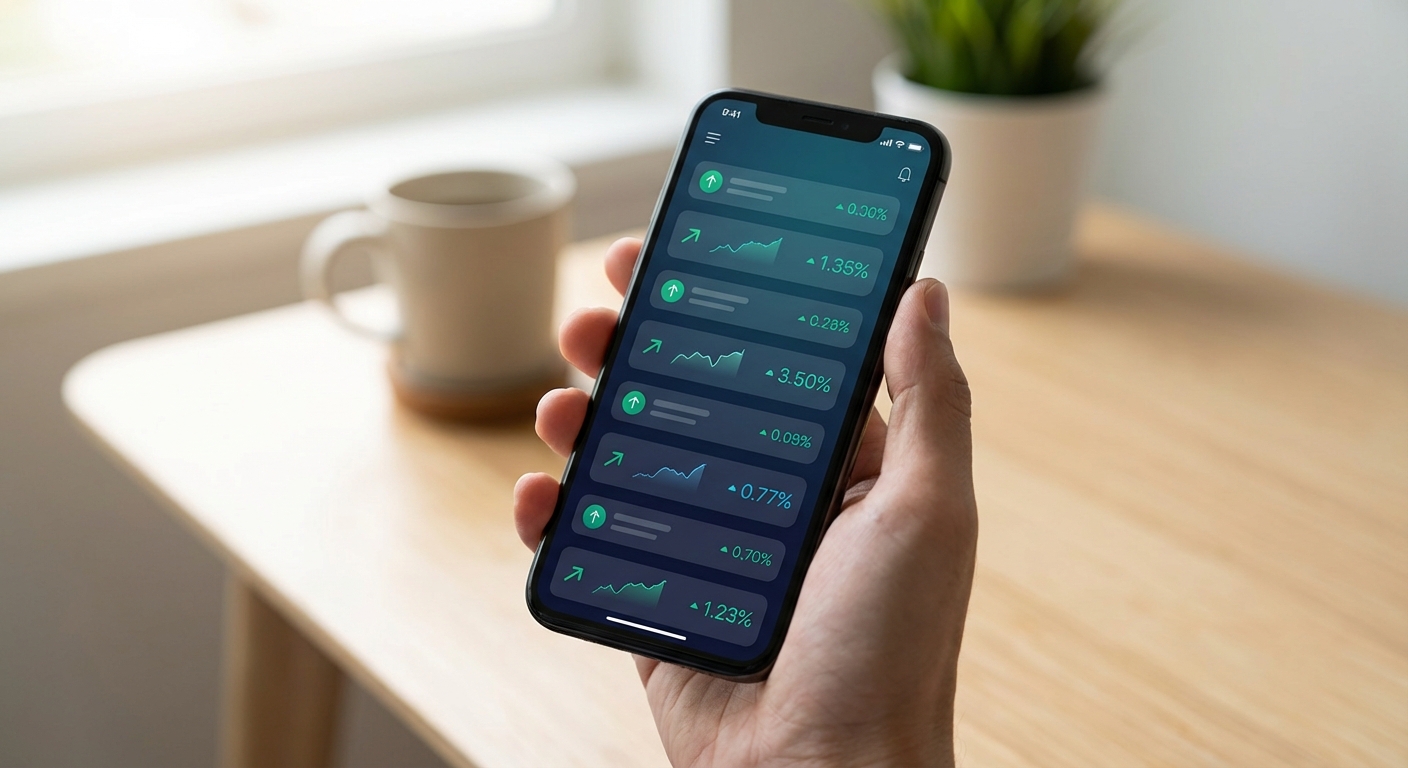
Mobile-first alert systems are particularly valuable for premarket trading because you're often away from your desktop. Push notifications to your phone allow you to review setups, check charts, and place orders from anywhere. ChartMath's mobile app delivers exactly this: curated premarket setups with backtest data, ranked by quality, in a swipeable interface designed for quick decision-making.
The difference between a good alert system and a great one is context. Instead of just saying "XYZ is up 8%," a quality alert explains: "XYZ gapped up 8.2% on earnings beat, RVOL 6.4x, holding above VWAP, historical win rate 67% for this setup." That context helps you make informed decisions quickly.
5. Backtest Your Premarket Trading Strategies
Hope is not a strategy. If you're trading premarket setups without knowing their historical performance, you're gambling. Backtesting reveals which patterns actually work, what their win rates are, and what kind of returns you can expect.

Backtesting premarket strategies differs from regular-hours backtesting in several ways:
Data quality matters more. Premarket data can be sparse or inconsistent depending on your data provider. Make sure you're using tick-level or minute-level data that accurately captures premarket price action and volume.
Liquidity assumptions change. A strategy that works beautifully during regular hours might fail premarket due to wider spreads and slippage. Your backtest should account for realistic execution costs.
Sample size may be smaller. Not every stock has significant premarket activity every day. Your backtest might have fewer occurrences than a regular-hours strategy, which means you need longer historical periods to reach statistical significance.
Key metrics to track when backtesting premarket strategies:
- Win rate: Percentage of trades that hit profit targets before stop loss
- Average return per trade: Mean profit/loss across all trades
- Expected value (EV): Win rate × average win - loss rate × average loss
- Maximum drawdown: Largest peak-to-trough decline during the backtest period
- Profit factor: Gross profits divided by gross losses
- Sample size: Number of occurrences (aim for 100+ for statistical relevance)
Example backtest data for a common premarket pattern:
Setup: Stock gaps up 5%+ on earnings beat, RVOL 4x+, holds above VWAP in premarket
Entry: Break of premarket high in first 15 minutes of regular trading
Exit: 3% profit target or break below VWAP
Results (2023-2026): 64% win rate, +1.8% average return, 1.9 profit factor, 247 occurrences
This data tells you the setup has a genuine edge. It wins more than it loses, the average return is positive, and it's occurred enough times to be statistically meaningful. Without this information, you're flying blind.
For traders serious about data-driven decision-making, understanding how to build winning backtesting strategies is foundational. ChartMath takes this a step further by providing backtest data for every screen and alert, so you know the historical performance before you take the trade.
6. Time Your Entries: First 5 Minutes vs First 30 Minutes
Timing is everything in premarket trading. Enter too early and you might catch a false breakout. Wait too long and you miss the move entirely. Understanding volatility patterns and entry timing can dramatically improve your results.
The Opening Range Breakout (ORB) strategy is one of the most popular premarket-to-open transitions. The concept is simple: identify the high and low of the first 5, 15, or 30 minutes of regular trading, then trade the breakout of that range. Stocks with strong premarket momentum often break their opening range and continue trending.
Here's how volatility typically unfolds:
First 5 minutes (9:30-9:35 AM): Extreme volatility as overnight orders flood the market. Spreads can be wide, and price can whipsaw violently. This is the highest-risk, highest-reward window. Experienced traders with tight risk management can capitalize on explosive moves, but beginners often get chopped up.
First 15 minutes (9:30-9:45 AM): Volatility remains elevated but starts to stabilize. The opening range becomes more defined. Many professional traders wait for the first 5-minute candle to close before entering, using that high/low as their breakout levels.
First 30 minutes (9:30-10:00 AM): The market finds its rhythm. Stocks with genuine momentum continue trending, while weak setups fade back toward their opening prices. The 30-minute ORB is popular among swing traders who want confirmation before committing capital.
When to jump in immediately: If you've validated the setup thoroughly in premarket (strong catalyst, high RVOL, technical confirmation, positive backtest data), and the stock breaks premarket high with conviction in the first few minutes, immediate entry can capture the most explosive part of the move.
When to wait for confirmation: If the premarket setup is marginal, the catalyst is unclear, or you're trading a larger position size, waiting for the first pullback or consolidation reduces risk. Look for the stock to break premarket high, pull back to VWAP or the 9-EMA, then resume the uptrend. This "higher low" entry offers better risk/reward.
Risk management is non-negotiable. Use the premarket low or VWAP as your stop-loss reference. If the stock breaks below these levels, the setup is invalidated and you should exit. Don't hope and hold.
7. Manage Risk in Premarket Trading
Premarket trading offers tremendous opportunity, but it also carries unique risks that require adjusted risk management protocols. Lower liquidity, wider spreads, and gap risk demand a disciplined approach.
Position sizing for lower liquidity: Don't trade the same size premarket as you would during regular hours. Reduce your position size by 30-50% to account for potential slippage and difficulty exiting if the trade goes against you. A $10,000 regular-hours position might become a $5,000-$7,000 premarket position.
Stop-loss placement using premarket support: Your stop should be based on technical levels, not arbitrary percentages. Common stop-loss placements include below the premarket low, below VWAP, or below the previous day's close. Give the trade enough room to breathe, but not so much that a loss becomes catastrophic.
The danger of wide spreads and slippage: In premarket hours, the bid-ask spread can be significantly wider than during regular trading. A stock with a $0.02 spread at 10:00 AM might have a $0.10 spread at 7:00 AM. This means you pay more to enter and receive less when you exit. Factor this into your profit targets. A 2% profit target might become 1.5% after spread costs.
Exit strategy: before the bell or through the open? This depends on your trading style and the strength of the setup. Some traders take profits on premarket moves before 9:30 AM to avoid opening volatility. Others hold through the open expecting continuation. A hybrid approach works well: scale out of half your position in premarket to lock in gains, then let the remainder run with a trailing stop.
Never risk more than 1-2% of your trading capital on a single premarket trade. The lower liquidity and higher volatility mean things can go wrong faster than during regular hours. Preservation of capital is always the first priority.
Common Premarket Trading Mistakes to Avoid
Even experienced traders make costly errors in premarket sessions. Here are the most common mistakes and how to avoid them:
Chasing extended moves without confirmation. Just because a stock is up 15% premarket doesn't mean it will continue higher. If you're entering after a significant move, you're buying from early sellers taking profits. Wait for a pullback and consolidation before entering, or skip the trade entirely.
Ignoring catalyst quality. Not all news is created equal. An FDA approval or earnings beat is a legitimate catalyst. A tweet from an unknown account or vague "partnership announcement" is not. Do your due diligence before committing capital. Real news drives sustainable moves; hype creates pump-and-dumps.
Over-trading low-volume stocks with wide spreads. A stock trading 5,000 shares in premarket with a $0.25 spread is not a quality setup, no matter how attractive the chart looks. Stick to liquid names with meaningful volume and tight spreads. Your execution quality will thank you.
Failing to adjust position size. Trading your full regular-hours position size in premarket is asking for trouble. The reduced liquidity means you can't exit as easily if things go wrong. Scale down your size to match the environment.
Not having a plan. "I'll just see what happens" is not a strategy. Before entering any premarket trade, know your entry price, profit target, stop-loss level, and exit plan. Write it down if necessary. Emotional decisions in volatile premarket conditions lead to losses.
Tools and Platforms for Premarket Trading
Your tools can make or break your premarket trading success. Here's what to look for in a premarket scanner and alert system:
Real-time data with minimal delay. Premarket moves happen fast. A 15-minute delayed data feed is useless. You need real-time or near-real-time data (1-2 second delay maximum) to make timely decisions.
Customizable filters and thresholds. Every trader has different criteria. Your scanner should allow you to set specific RVOL thresholds, gap percentages, price ranges, volume minimums, and technical conditions. One-size-fits-all scanners miss opportunities or generate too much noise.
Backtest data and performance metrics. This is where most scanners fall short. They tell you what's moving, but not whether it's worth trading. Platforms that show historical win rates, average returns, and sample sizes for each setup give you a massive edge.
Mobile-first design for on-the-go trading. Premarket hours often coincide with morning routines. You need a mobile app that delivers alerts, displays charts, and allows quick analysis without being chained to a desktop. A clunky mobile experience means missed opportunities.
Integration with your charting platform. Your scanner should complement, not replace, your existing tools. The ability to quickly jump from an alert to your charting platform for deeper analysis streamlines your workflow.
ChartMath delivers all of this in a single platform. It continuously scans 200+ technical setups including premarket movers, gap-and-go patterns, RVOL spikes, and momentum breakouts. Every alert includes backtest data showing historical win rate and average return, so you know the edge before you trade. The mobile-first, swipeable interface lets you discover and evaluate setups in seconds, with push alerts ensuring you never miss a high-probability opportunity—even when you're away from your desk.
Unlike traditional scanners that require constant manual refreshing, ChartMath monitors the market in real-time and delivers ranked setups based on quality and freshness. No coding required, no Pine Script to learn, just proven technical patterns with transparent performance data. Try the web-based screener or download the mobile app to see how it transforms your premarket trading workflow.
Start Finding High-Probability Premarket Trading Setups Today
Mastering premarket trading gives you a significant edge in today's markets. By implementing these seven strategies, scanning for RVOL spikes, identifying gap-and-go setups, validating with technical indicators, setting up intelligent alerts, backtesting your approach, timing your entries, and managing risk appropriately, you position yourself to capitalize on opportunities that most traders miss.
The key is consistency and systematic execution. Don't chase every premarket mover. Focus on setups that meet your criteria, have positive backtest data, and align with your risk tolerance. Keep a trading journal to track which premarket patterns work best for your style and continuously refine your approach.
Remember, the goal isn't to trade every day. It's to trade the right setups when they appear. Some days will have multiple high-probability premarket opportunities. Other days will have none. Patience and discipline separate profitable premarket traders from those who give back their gains.
Ready to stop missing early-morning breakouts? ChartMath's premarket scanning and alert system does the heavy lifting for you, delivering high-probability setups with backtest data directly to your phone. Whether you're a day trader looking for explosive opening range breakouts or a swing trader identifying multi-day momentum plays, ChartMath helps you find setups that actually work, backed by real performance data, not guesswork.
Watch a demo to see how ChartMath scans for premarket trading opportunities in real-time, or download the app and start discovering high-probability premarket setups before the opening bell. Your next winning trade might be forming right now while you're reading this, make sure you don't miss it.
Ankush Jindal
Co-Founder, ChartMath
Ankush Jindal is the Co-Founder of ChartMath, a real-time trade discovery platform that monitors 200+ technical screens across the market to surface actionable setups for technical traders. He holds a B.Tech in Computer Science from IIT Mandi. Before ChartMath, he co-founded two successful technology ventures spanning hundreds of thousands of users. This experience building data-intensive, real-time systems directly shaped his approach to technical analysis tooling. At ChartMath, Ankush leads product vision, designing intuitive interfaces that translate complex price action into clear, backtested signals. His philosophy: trading decisions should be backed by data, not gut feeling.
LinkedInSee these setups live in ChartMath
200+ curated screens with backtest data. Free to use.
Related Articles
Volume Analysis for Day Traders: How to Use RVOL and Volume Spikes
Master volume analysis with RVOL and volume spikes to predict price moves. Learn how day traders use volume indicators to confirm breakouts in 2026.

Intraday Trading: How to Execute 1-Minute to 15-Minute Plays
Master intraday trading with this step-by-step guide. Learn to identify ORB breaks, VWAP reclaims, and momentum setups across 1m, 5m, and 15m timeframes.
VWAP Trading: How to Use Volume-Weighted Average Price
Master VWAP trading with this complete guide. Learn how to identify high-probability entries, exits, and setups using volume-weighted average price indicators.