VWAP Trading: How to Use Volume-Weighted Average Price
You've been staring at charts for hours, watching price dance around that blue line. Sometimes it bounces perfectly. Other times it slices right through. You know VWAP matters—institutional traders use it, every trading guru mentions it—but turning that knowledge into consistent profits feels like trying to catch smoke.
Here's the truth: VWAP trading isn't complicated, but it does require understanding when and how to act on the signals. This guide will show you exactly how to use the Volume-Weighted Average Price indicator to identify high-probability entry and exit points, recognize the most reliable VWAP setups, and automate the entire process so you're not glued to your screen all day.
Whether you're a day trader looking for scalp opportunities or a swing trader building positions, mastering VWAP trading can dramatically improve your timing and win rate. Let's break down everything you need to know.
What Is VWAP Trading and Why Does It Matter?
VWAP stands for Volume-Weighted Average Price. Unlike a simple moving average that treats every price point equally, VWAP gives more weight to prices where higher volume occurred. Think of it as the "fair value" line for the trading day—the average price weighted by how much actual trading happened at each level.
Here's why VWAP trading has become essential for technical traders: institutional investors and algorithmic trading systems use VWAP as a benchmark. When a large fund needs to buy 500,000 shares, they aim to execute near VWAP to prove they got a fair price. This creates predictable behavior around the VWAP line throughout the trading session.
When price trades above VWAP, buyers are in control—the average participant is profitable. When price drops below VWAP, sellers dominate and the average trader is underwater. This psychological dynamic makes VWAP act as dynamic support and resistance that shifts throughout the day based on actual trading activity.
The volume component is what makes VWAP trading more reliable than price-only indicators. A price spike on 100 shares barely moves VWAP. A price move on 1 million shares significantly shifts it. This volume weighting filters out noise and highlights where real institutional money is flowing.
For day traders and swing traders, VWAP provides a reference point to gauge whether you're buying at a favorable price relative to the day's trading activity. It's not a crystal ball, but it's one of the most widely watched technical indicators for good reason.
How VWAP Is Calculated (The Simple Version)
You don't need to calculate VWAP manually, every modern charting platform does it automatically. But understanding the basic formula helps you interpret what you're seeing on screen.
VWAP is calculated by taking the cumulative total of price multiplied by volume, then dividing by cumulative volume. In practical terms: for each period (usually each minute), multiply the typical price (high + low + close divided by 3) by the volume for that period. Add all those values together from market open, then divide by total volume since market open.
The key detail: VWAP resets at the start of each trading session. At 9:30 AM Eastern when US markets open, VWAP starts fresh. This makes VWAP trading primarily an intraday tool. By the end of the day, VWAP represents the volume-weighted average price for the entire session.
Because VWAP is cumulative throughout the day, it becomes more stable as the session progresses. In the first 15 minutes, VWAP can move quickly as volume floods in. By midday, it takes significant volume to shift VWAP meaningfully. This is why VWAP trading setups often work best during high-volume periods like market open and the final hour.
Some traders also use anchored VWAP, which starts from a specific point (like a major high or low) rather than market open. But for most VWAP trading strategies, the standard daily VWAP is what matters.
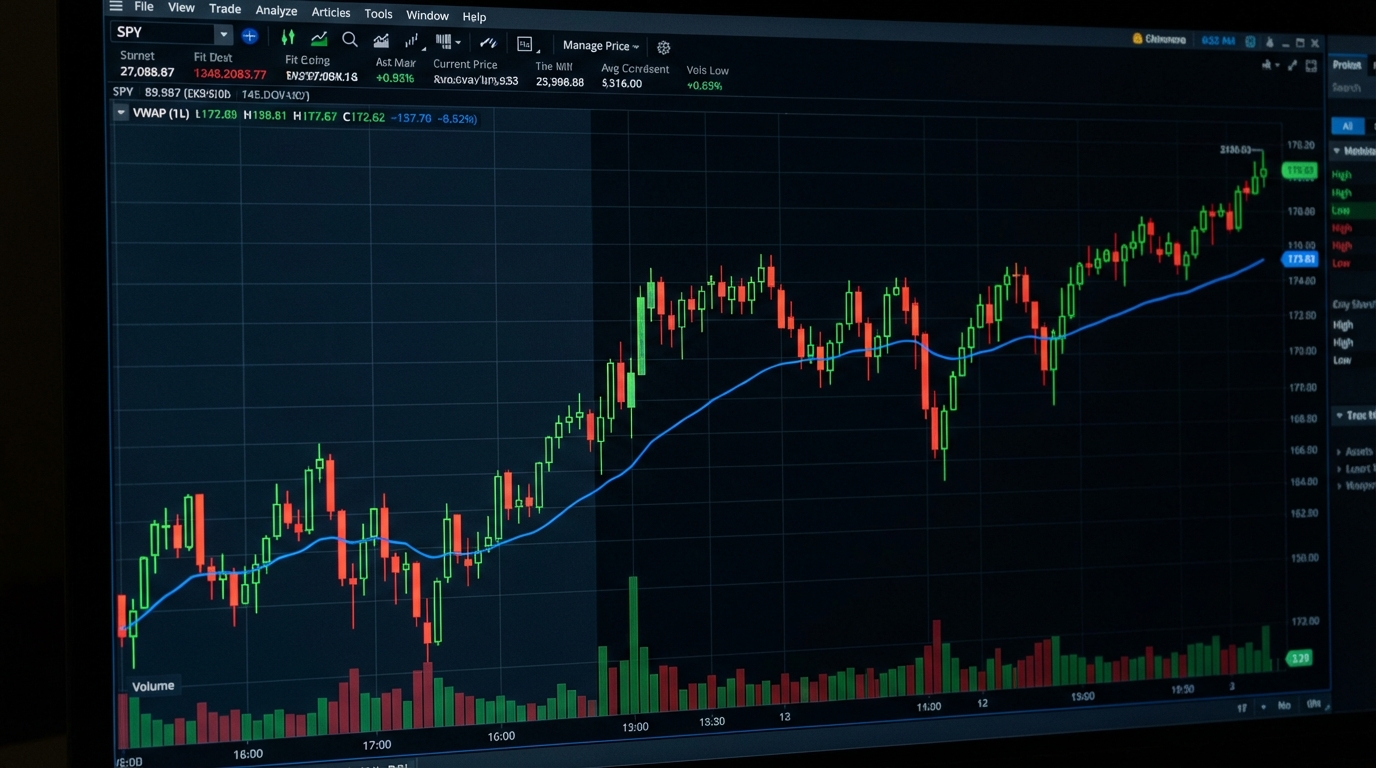
1. Identify VWAP on Your Charts
Before you can trade VWAP, you need to see it clearly on your charts. Most charting platforms include VWAP as a built-in indicator. On TradingView, search for "VWAP" in the indicators menu. On Thinkorswim, it's under Studies. On Webull and Robinhood, check the indicator library.
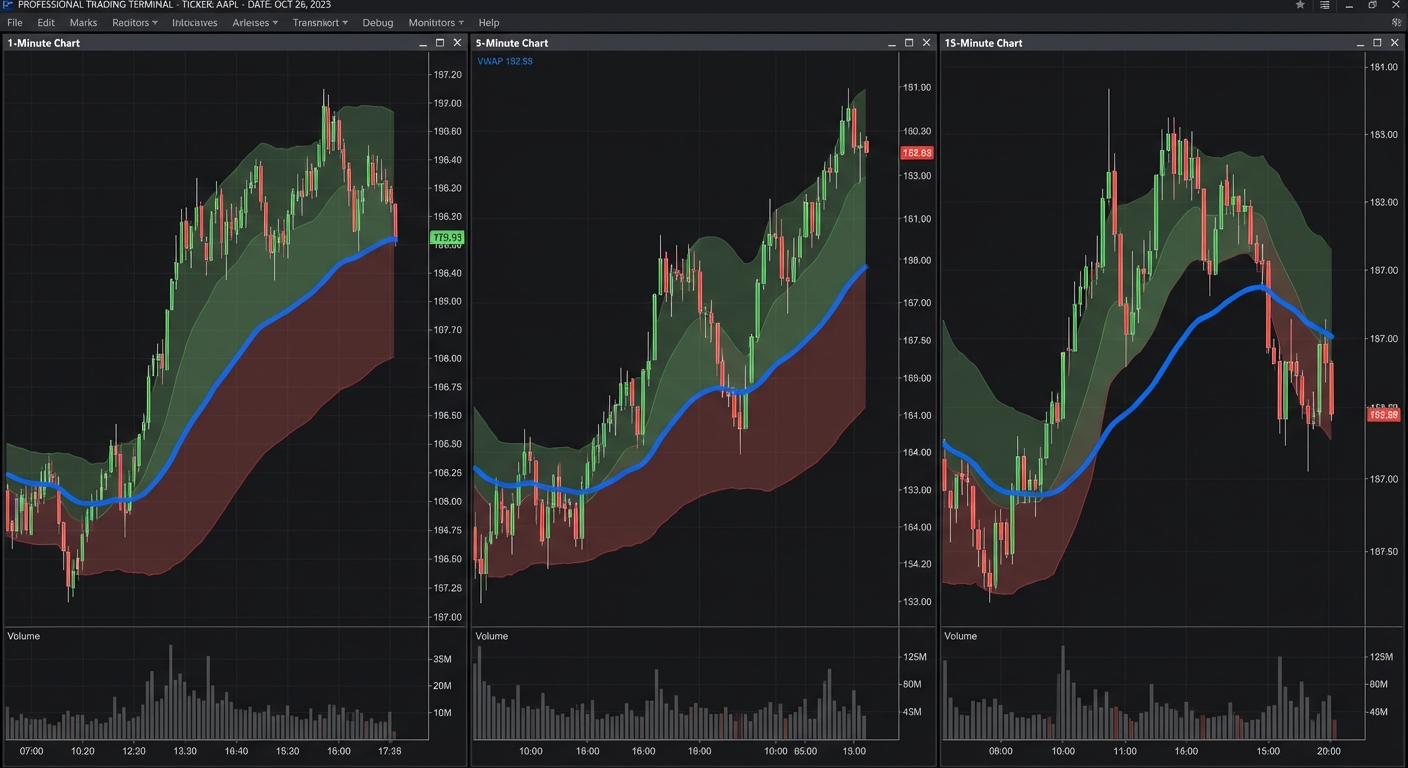
For VWAP trading, the best timeframes depend on your trading style. Day traders typically use 1-minute, 5-minute, or 15-minute charts. Scalpers who hold positions for minutes prefer 1-minute or 5-minute. Traders holding for hours use 15-minute or 1-hour charts. The VWAP line itself is the same regardless of timeframe, it's calculated from all trades since market open, but the candlestick timeframe affects how you time your entries.
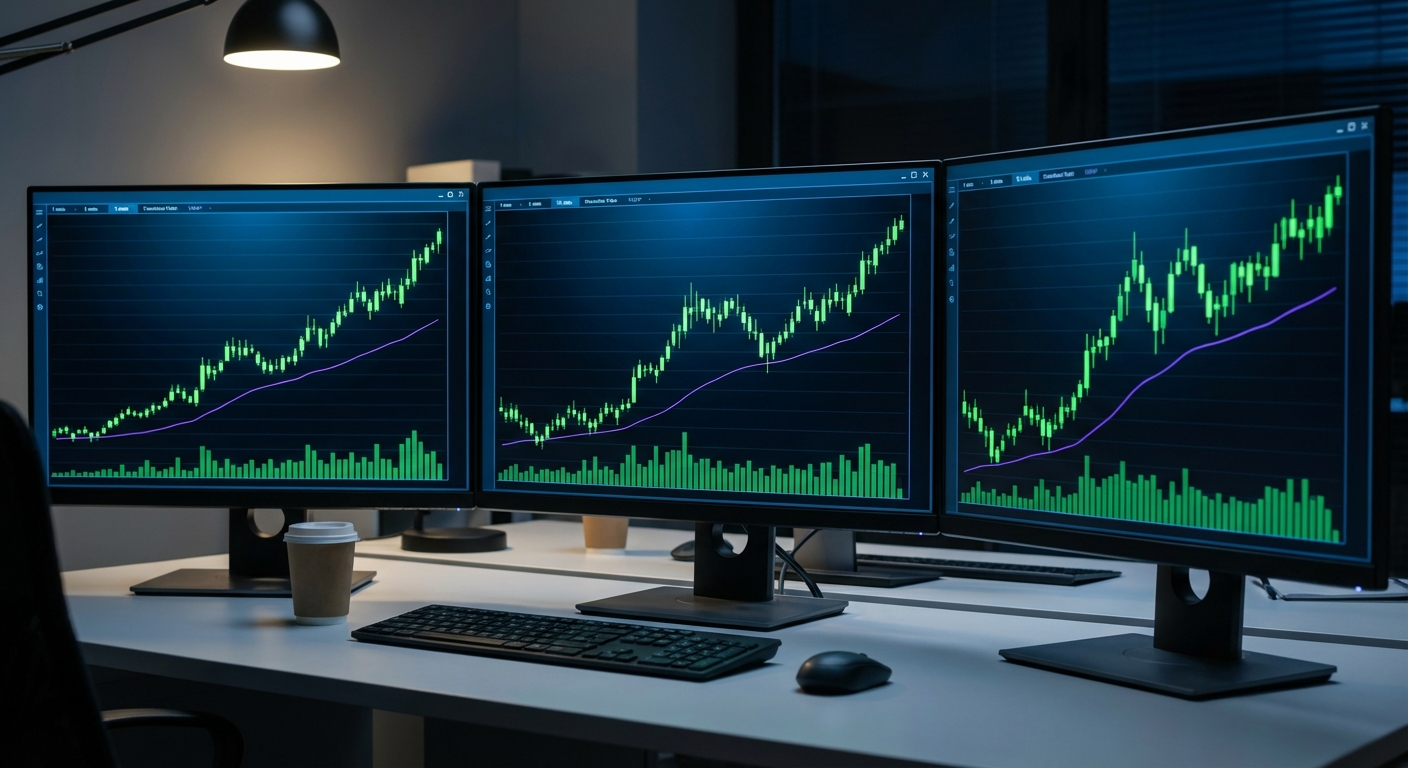
Visually, VWAP appears as a smooth line that flows through price action. Unlike moving averages that can be choppy, VWAP tends to be smoother because it's weighted by volume and cumulative throughout the day. When price is above VWAP, you're looking at a bullish bias. When price is below VWAP, the bias is bearish.
Many traders also add VWAP bands, standard deviation lines above and below VWAP. These bands show when price is stretched too far from VWAP, similar to Bollinger Bands. When price reaches the upper band, it's extended and may pull back to VWAP. When it hits the lower band, it may bounce back up. These bands add context to your VWAP trading decisions.
The key is to watch how price interacts with the VWAP line. Does it bounce off VWAP repeatedly? Does it slice through without hesitation? These patterns tell you whether VWAP is acting as strong support/resistance or if it's being ignored by the market.
2. Master the VWAP Bounce Setup
The VWAP bounce is one of the highest-probability setups in VWAP trading. Here's how it works: when price is trending above VWAP and pulls back to touch or slightly penetrate the VWAP line, then bounces back up, that's a VWAP bounce. It's essentially buying the dip at a logical support level.
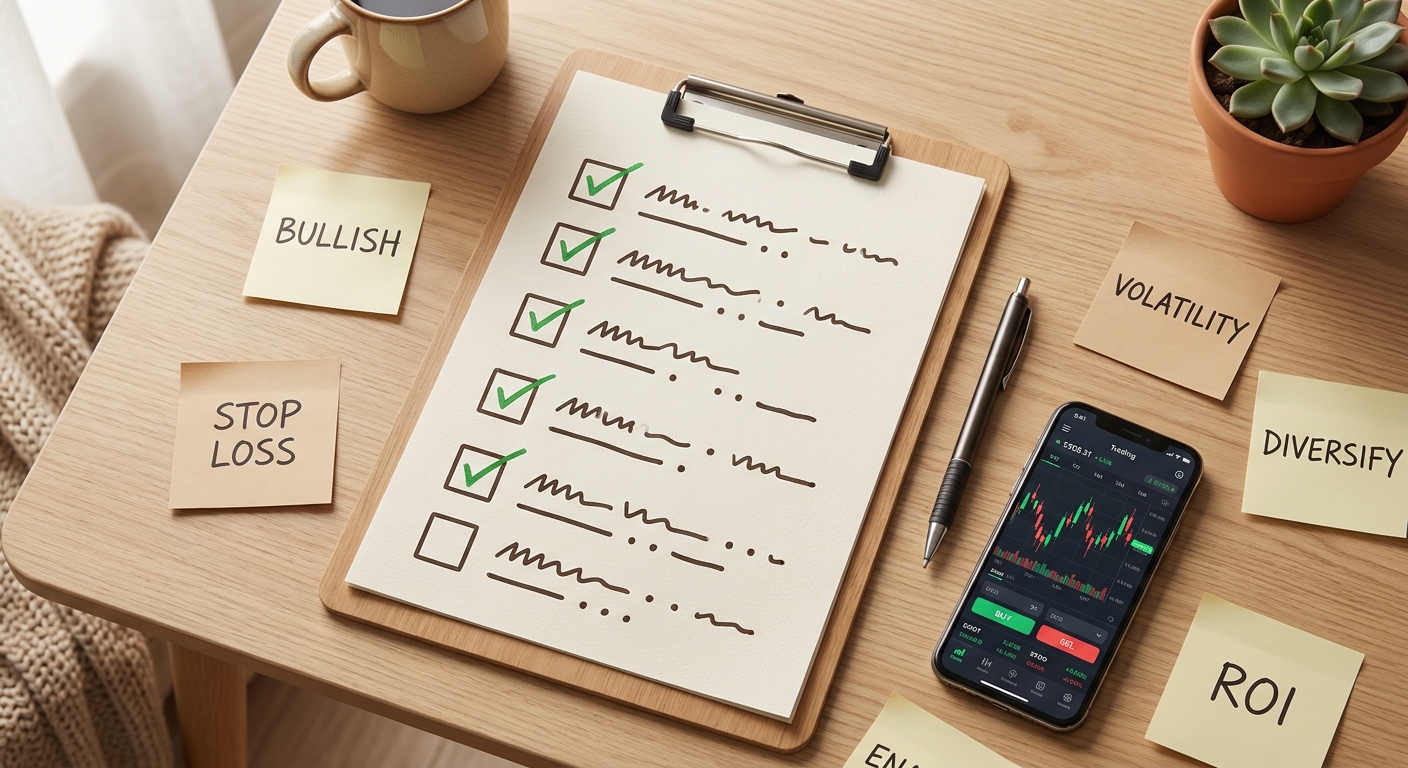
To identify a valid VWAP bounce setup, look for these elements:
- Price trending above VWAP for at least 30 minutes, establishing VWAP as support
- Pullback to VWAP on decreasing volume (profit-taking, not aggressive selling)
- Rejection candle at or near VWAP, a candle with a long lower wick showing buyers stepped in
- Volume surge on the bounce candle, confirming buying interest
- Relative volume (RVOL) above 1.5x to ensure the stock is actively traded
Entry timing is critical for VWAP trading. Conservative traders wait for the rejection candle to close, then enter on the next candle if it continues higher. Aggressive traders enter as soon as they see the rejection wick forming. The trade-off: early entries get better prices but higher risk of false signals.
For stop loss placement, most VWAP traders put stops just below the VWAP line, typically 5-10 cents below on stocks under $50, or 0.2-0.5% below on higher-priced stocks. If price breaks below VWAP with volume, the setup is invalidated and you want to be out.
Targets depend on the stock's range and resistance levels. Common approaches include previous swing highs, whole number levels, or a risk-reward ratio of 2:1 or 3:1. Some traders scale out at multiple targets, taking partial profits at 1R and letting the rest run to 2R or 3R.
The VWAP bounce works because institutional algorithms and traders are programmed to buy dips to VWAP. When everyone is watching the same level, it becomes a self-fulfilling prophecy. This is why stock screeners for day trading often include VWAP bounce filters as a core feature.
3. Trade VWAP Breaks and Reclaims
While VWAP bounces are continuation plays, VWAP breaks and reclaims are reversal or momentum acceleration setups. Understanding the difference is crucial for VWAP trading success.
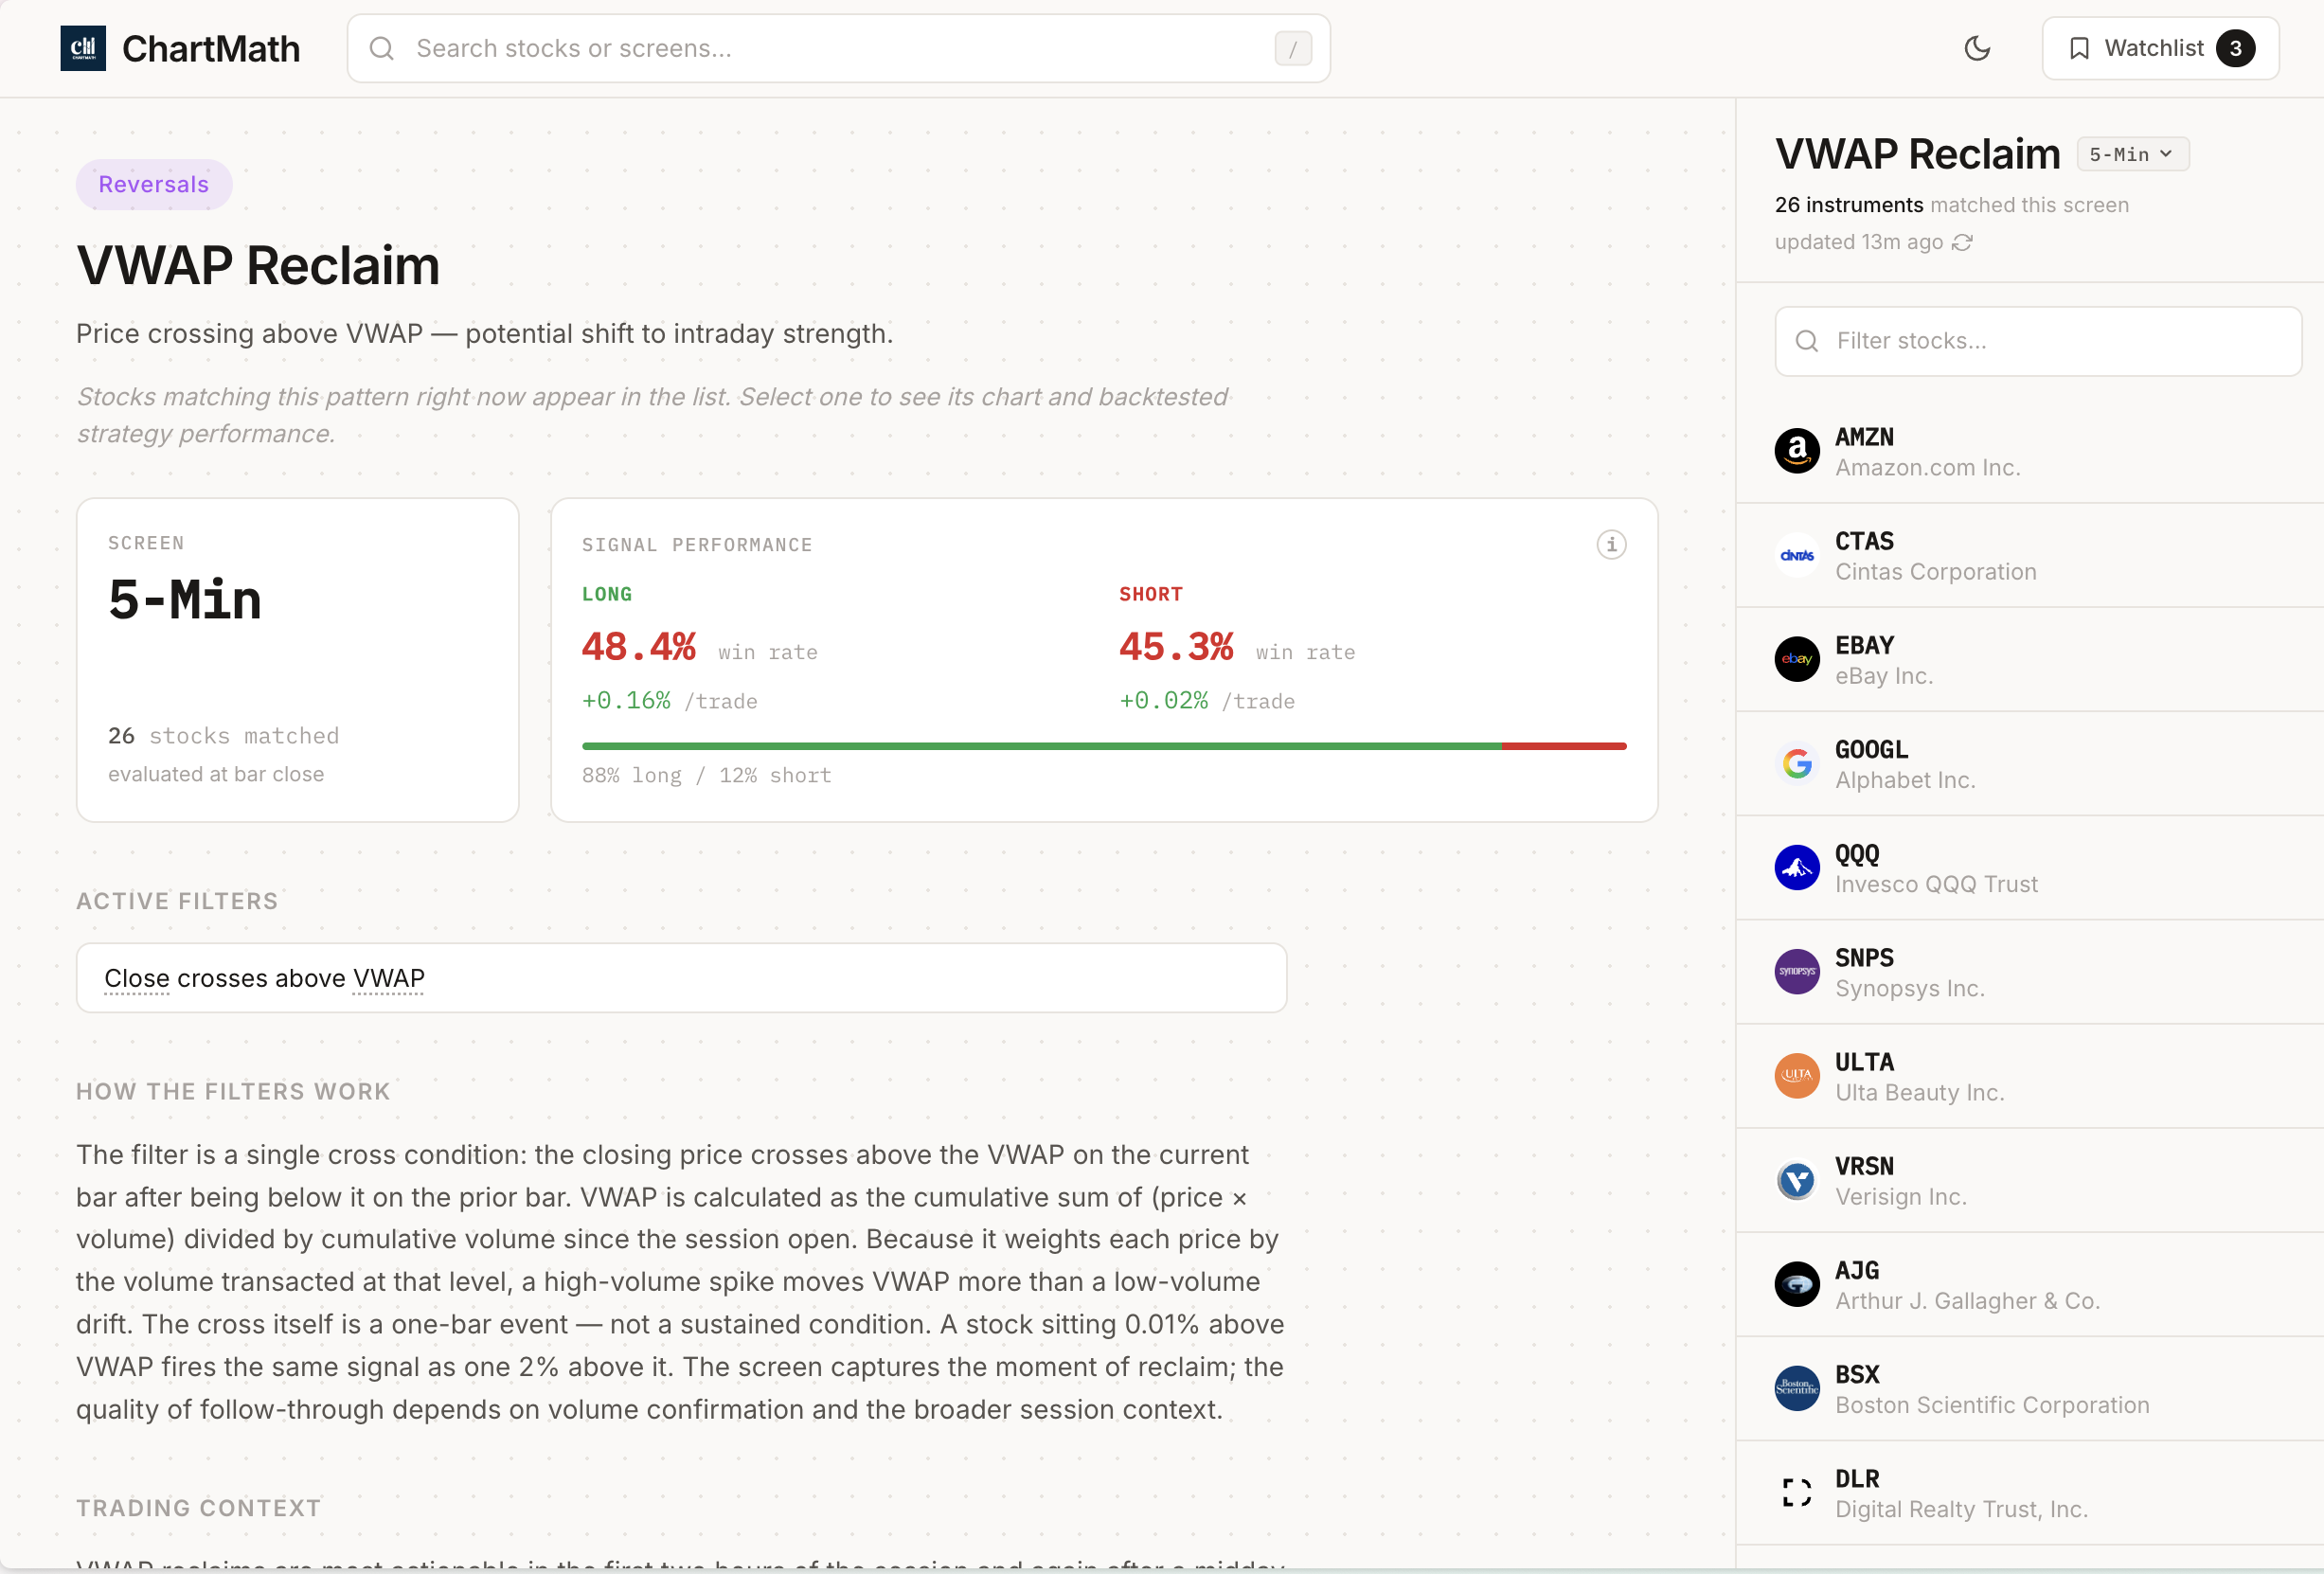
A VWAP reclaim happens when price has been trading below VWAP, then breaks back above it with conviction. This signals a potential shift from bearish to bullish. The setup looks like this: price trades below VWAP for at least 15-30 minutes, then surges through VWAP on high volume, and holds above it for several candles. The reclaim is confirmed when price pulls back to VWAP from above and bounces, now VWAP has flipped from resistance to support.
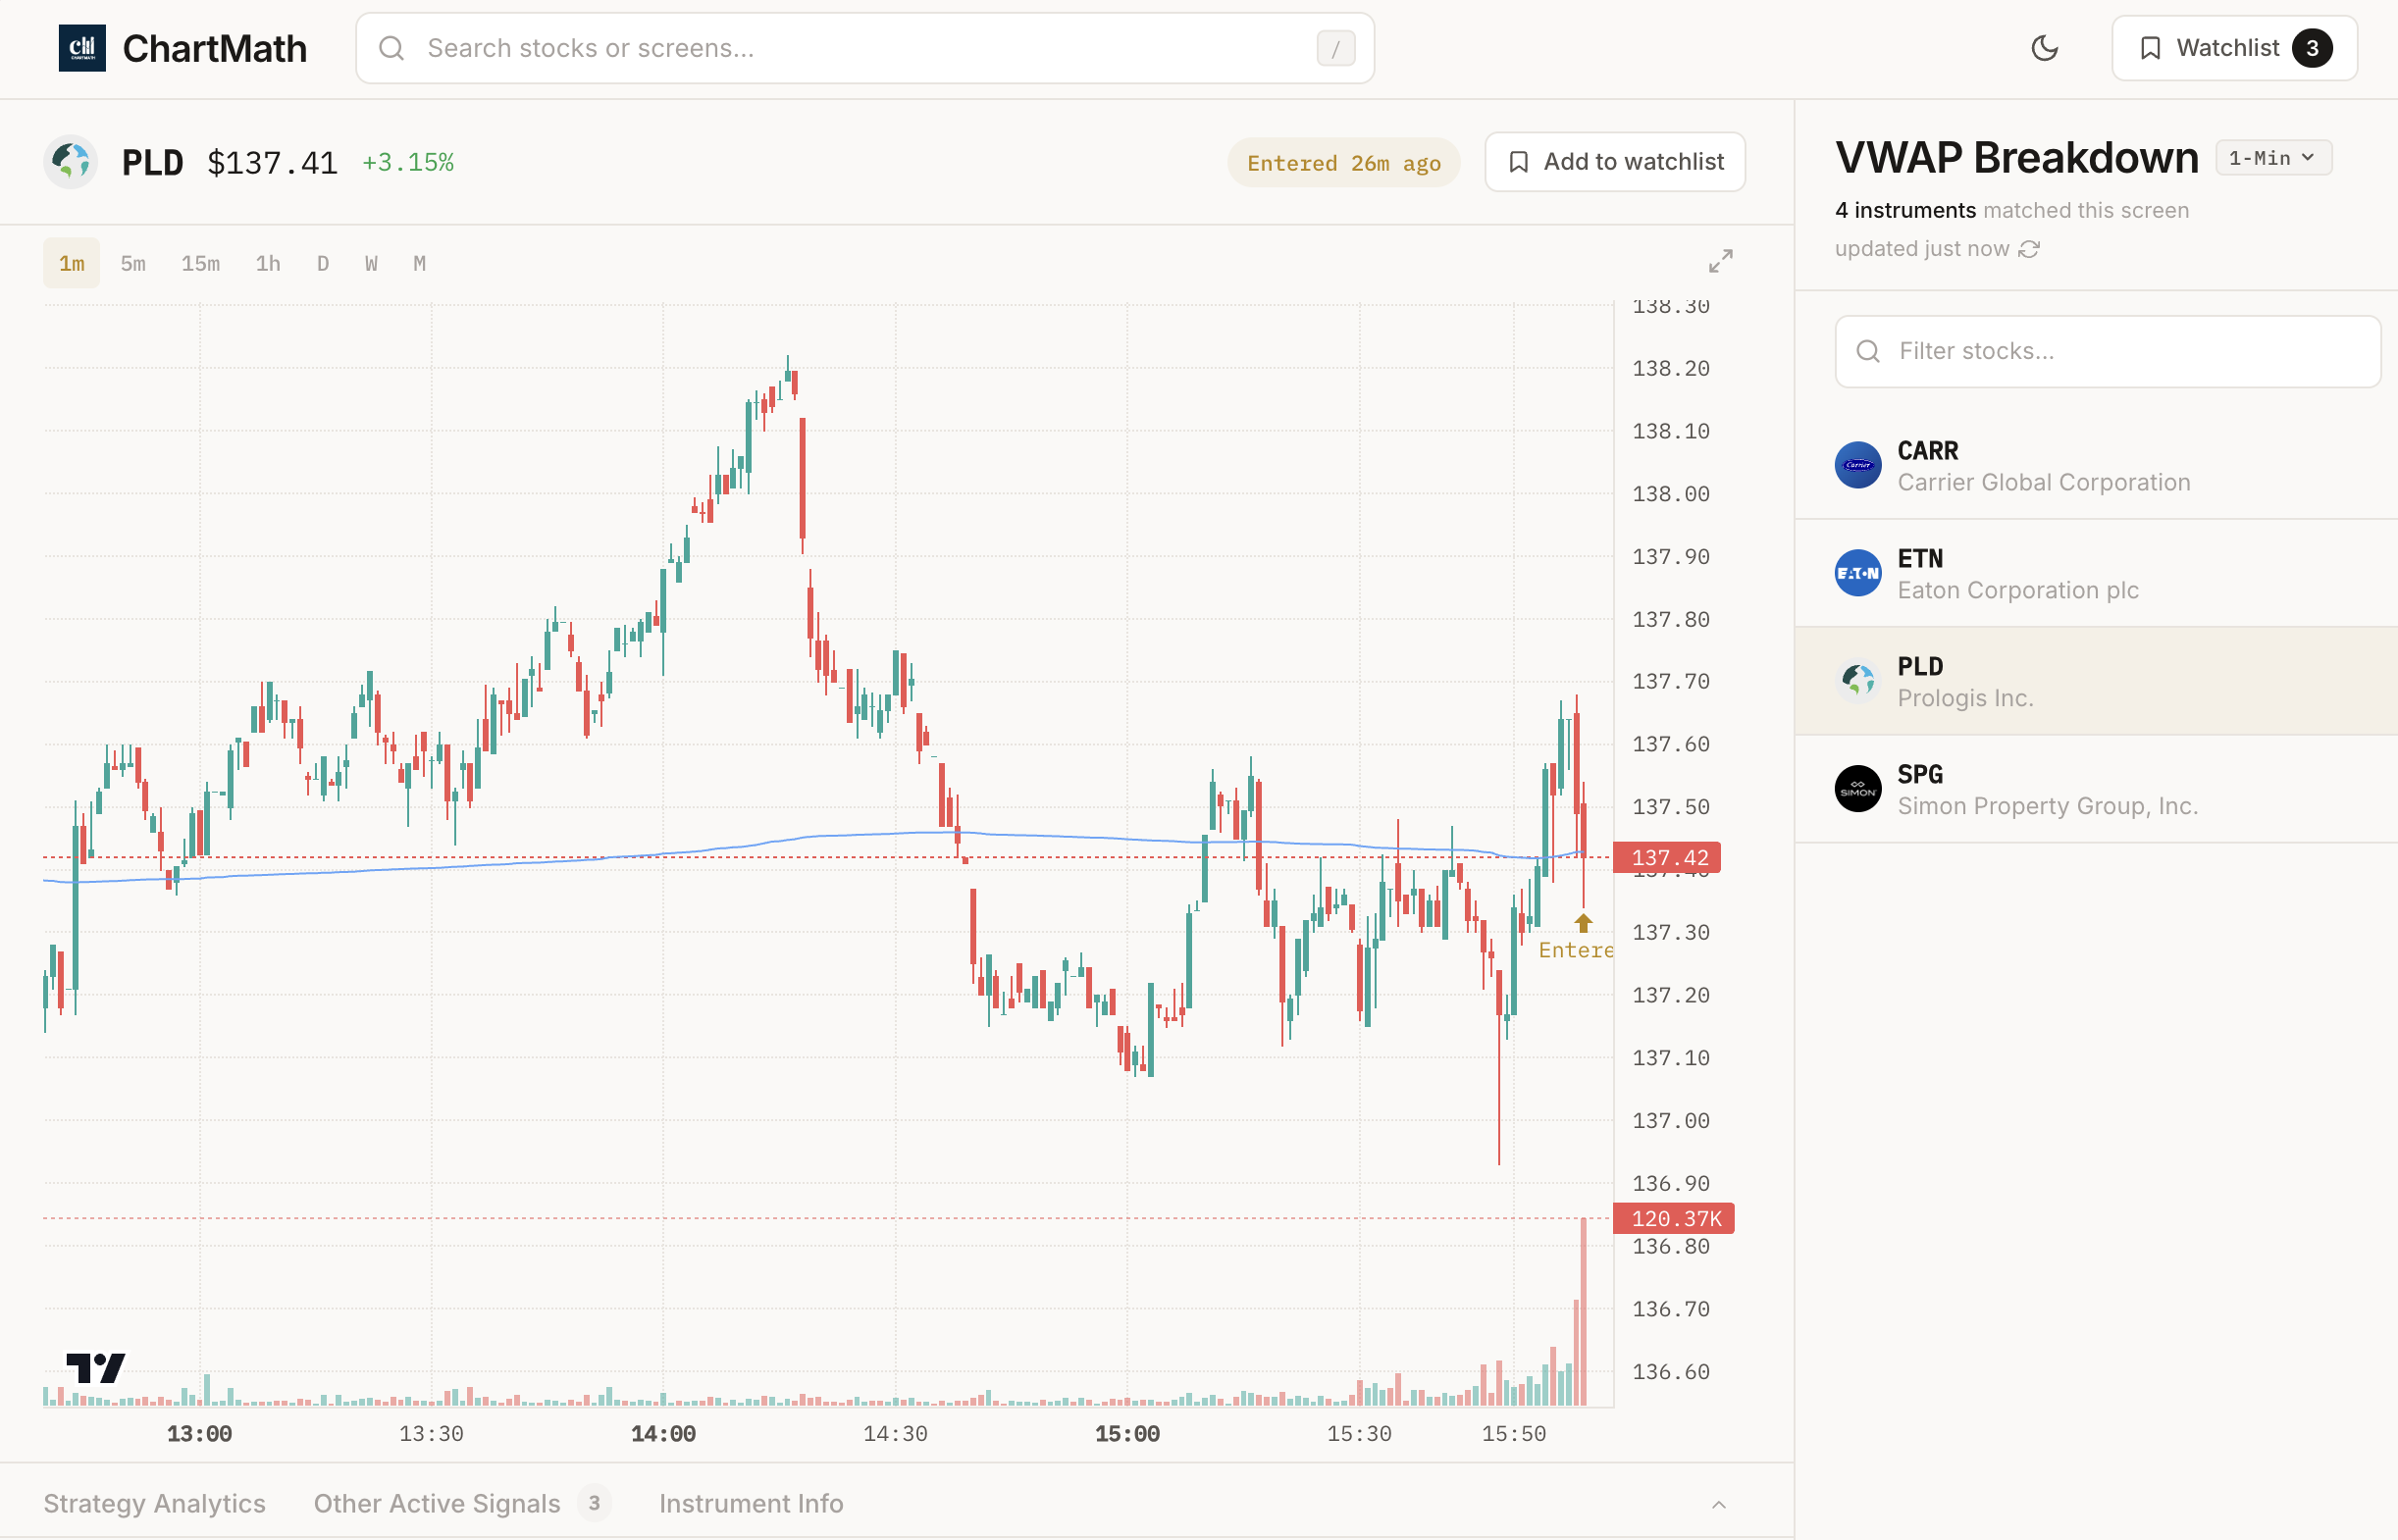
A VWAP breakdown is the opposite: price breaks below VWAP with volume after trading above it. This can signal a shift from bullish to bearish, and VWAP becomes resistance on any bounce attempts. For traders who short stocks, VWAP breakdowns offer entry opportunities when price rallies back to VWAP and gets rejected.
The key to trading VWAP breaks and reclaims is volume confirmation. A break on light volume is likely a false move. You want to see volume at least 1.5x to 2x the recent average when price crosses VWAP. Without volume, price often drifts back across VWAP without establishing a new trend.
False breaks are common in VWAP trading, especially during low-volume periods like midday. To avoid getting trapped, wait for price to hold above or below VWAP for at least 2-3 candles on your timeframe. A 5-minute chart trader should see 10-15 minutes of holding; a 1-minute chart trader should see 2-3 minutes minimum.
Another confirmation signal: watch for a retest. After price breaks above VWAP, the strongest setups pull back to VWAP, hold it as support, then continue higher. This retest gives you a lower-risk entry than chasing the initial break. Similarly, after a breakdown, a rally back to VWAP that fails offers a short entry with a tight stop just above VWAP.
Combining VWAP breaks with other momentum indicators significantly improves win rates. This is where comparing VWAP with RVOL and ORB becomes valuable, when multiple technical indicators align, the probability of follow-through increases dramatically.
4. Combine VWAP with Other Technical Indicators
VWAP trading becomes significantly more effective when you layer additional technical indicators for confirmation. No single indicator is perfect, but when multiple signals align, your edge improves.
VWAP + Relative Volume (RVOL) is one of the most powerful combinations. RVOL measures current volume compared to the average volume at this time of day. When you see a VWAP bounce on a stock with RVOL above 2.0, you know there's unusual interest driving the move. Without elevated RVOL, VWAP setups often lack follow-through.
VWAP + Support/Resistance Levels creates high-conviction zones. When VWAP aligns with a previous day's close, a major swing low, or a psychological whole number, that confluence makes the level even stronger. For example, if VWAP sits at $50.00 on a stock that previously found support at $50, you have two reasons to expect a bounce.
VWAP + Moving Averages helps identify trend strength. Many traders use the 9 EMA or 20 SMA alongside VWAP. When price is above both VWAP and the 9 EMA, the bullish trend is strong. When price is above VWAP but below the 9 EMA, the trend is weakening. This multi-indicator approach filters out marginal setups.
VWAP + RSI Divergence can signal reversals. If price makes a lower low but RSI makes a higher low, and this happens right at VWAP, you have both momentum divergence and a key support level. This combination often produces strong bounces.
VWAP + Chart Patterns is another effective pairing. Bull flags, ascending triangles, and cup-and-handle patterns become more reliable when VWAP acts as the support level during consolidation. If a bull flag forms with VWAP as the lower boundary, the breakout has both pattern and VWAP support.
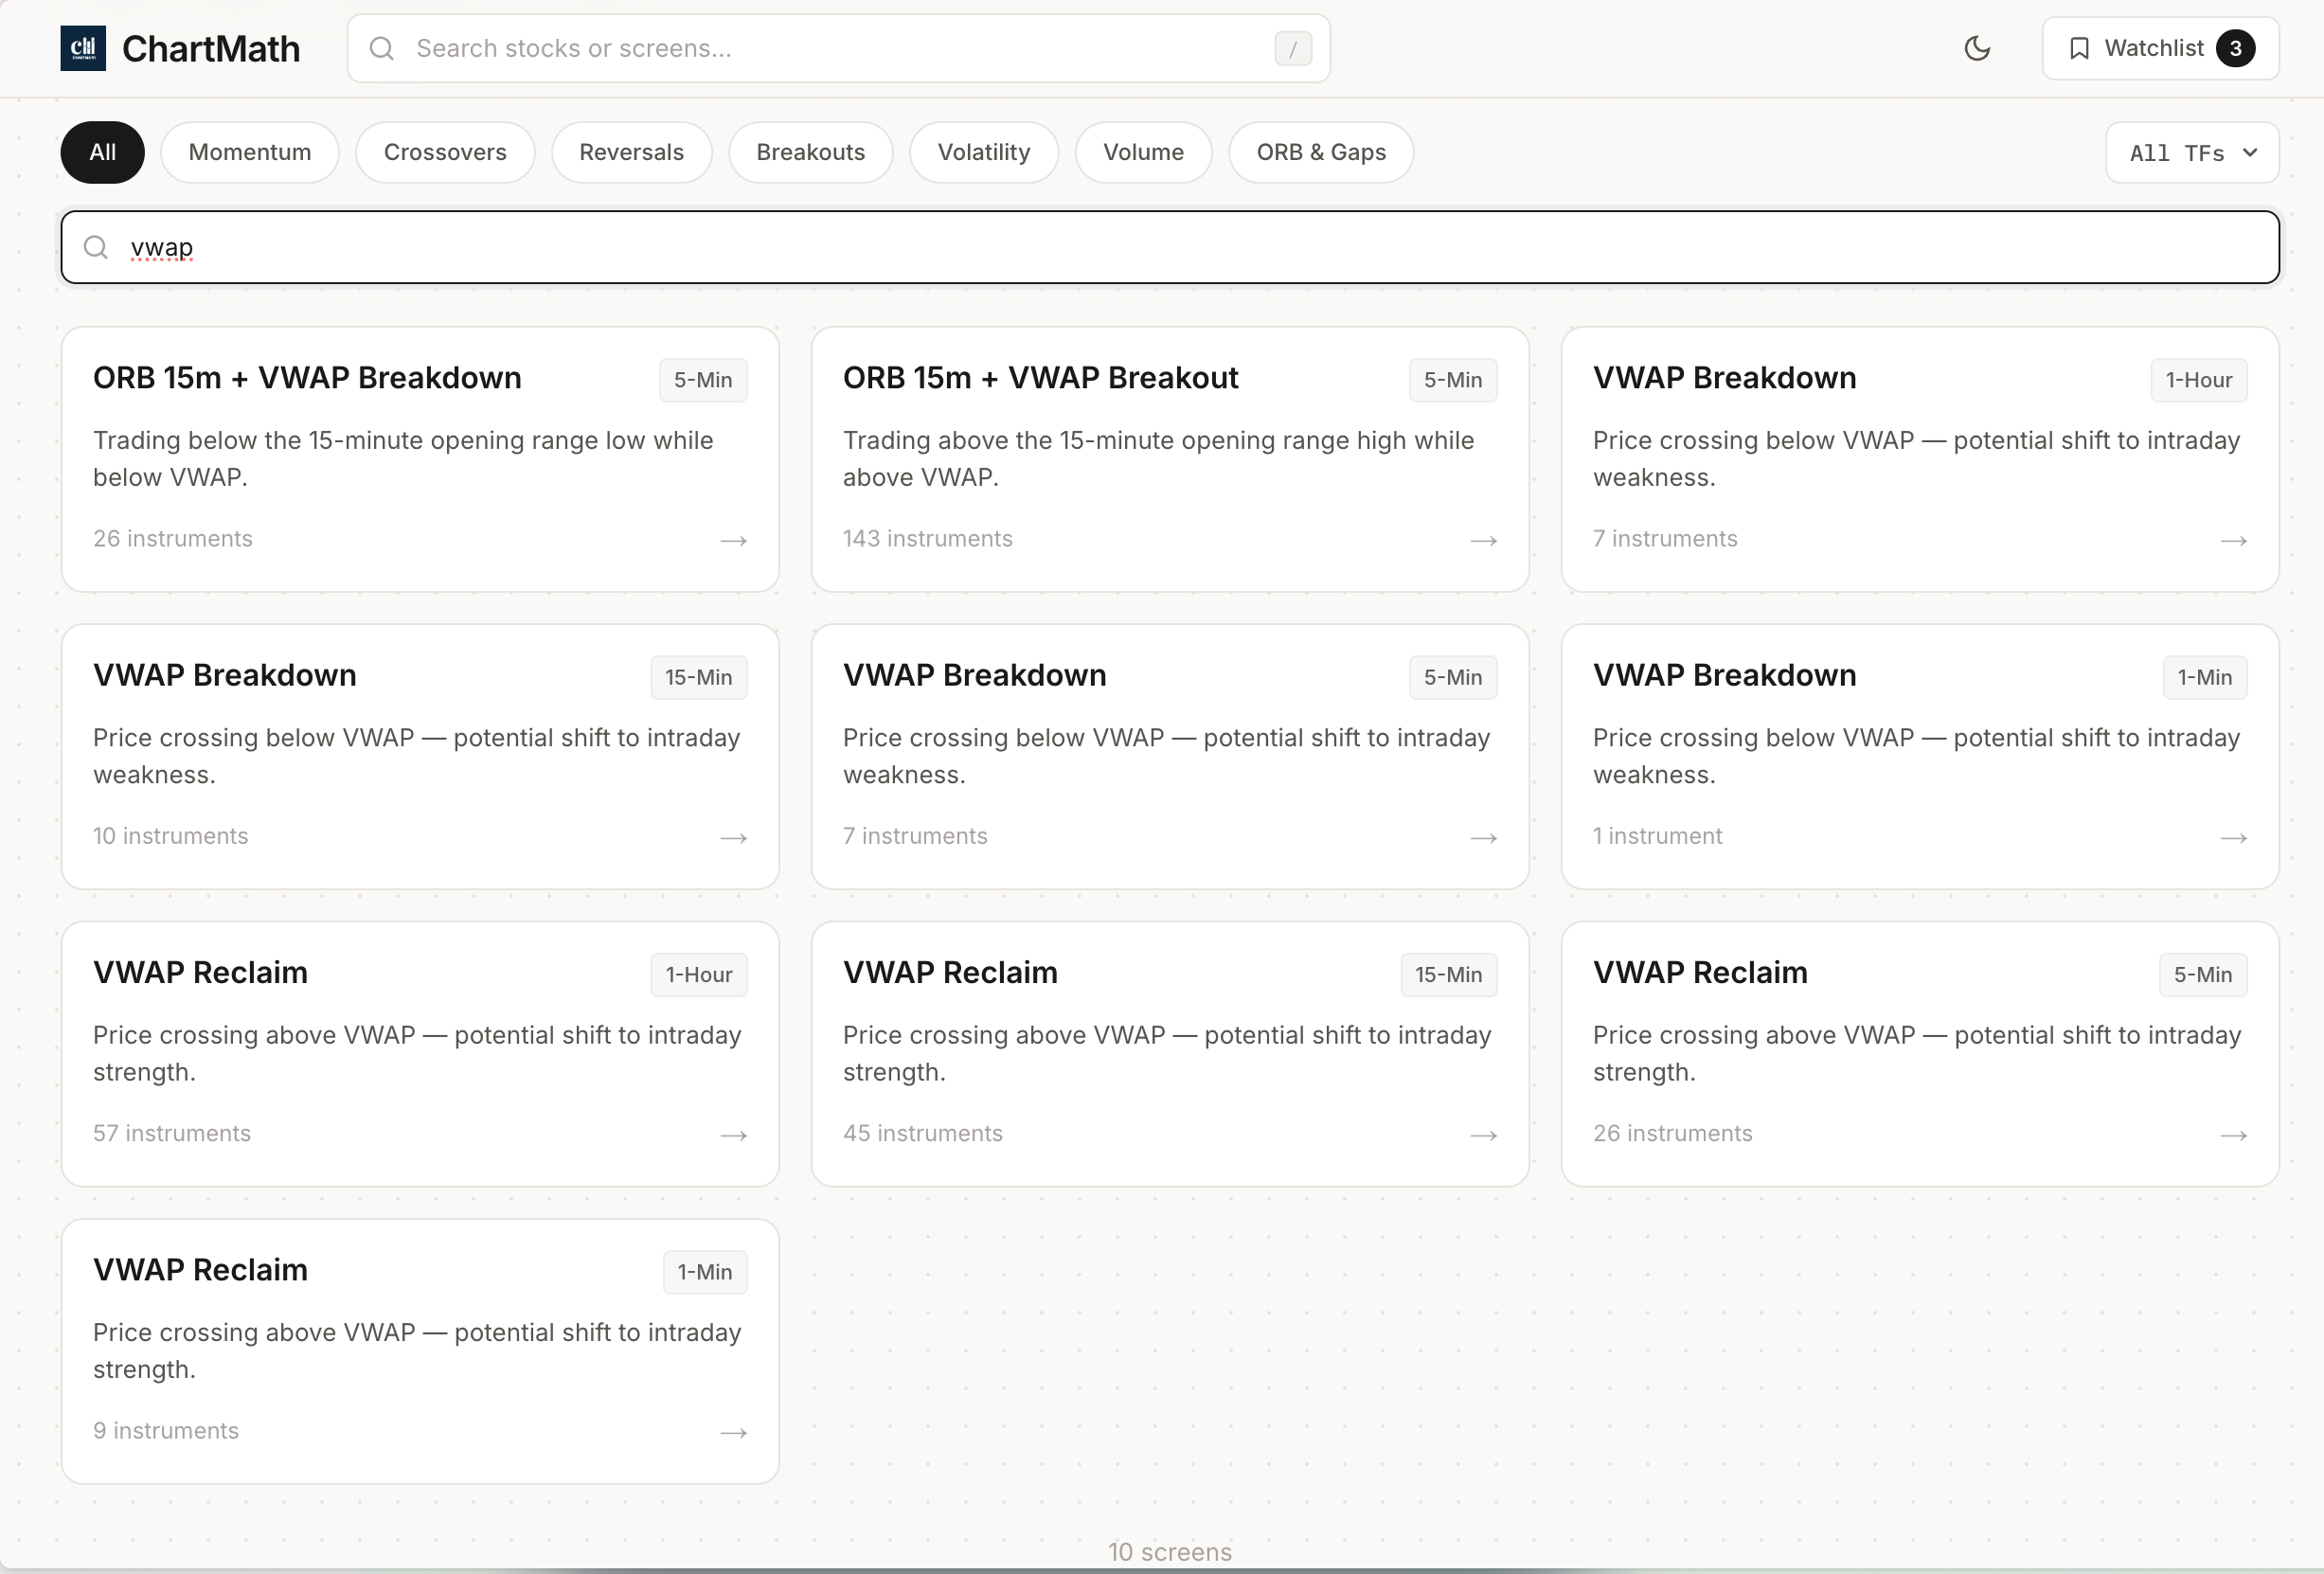
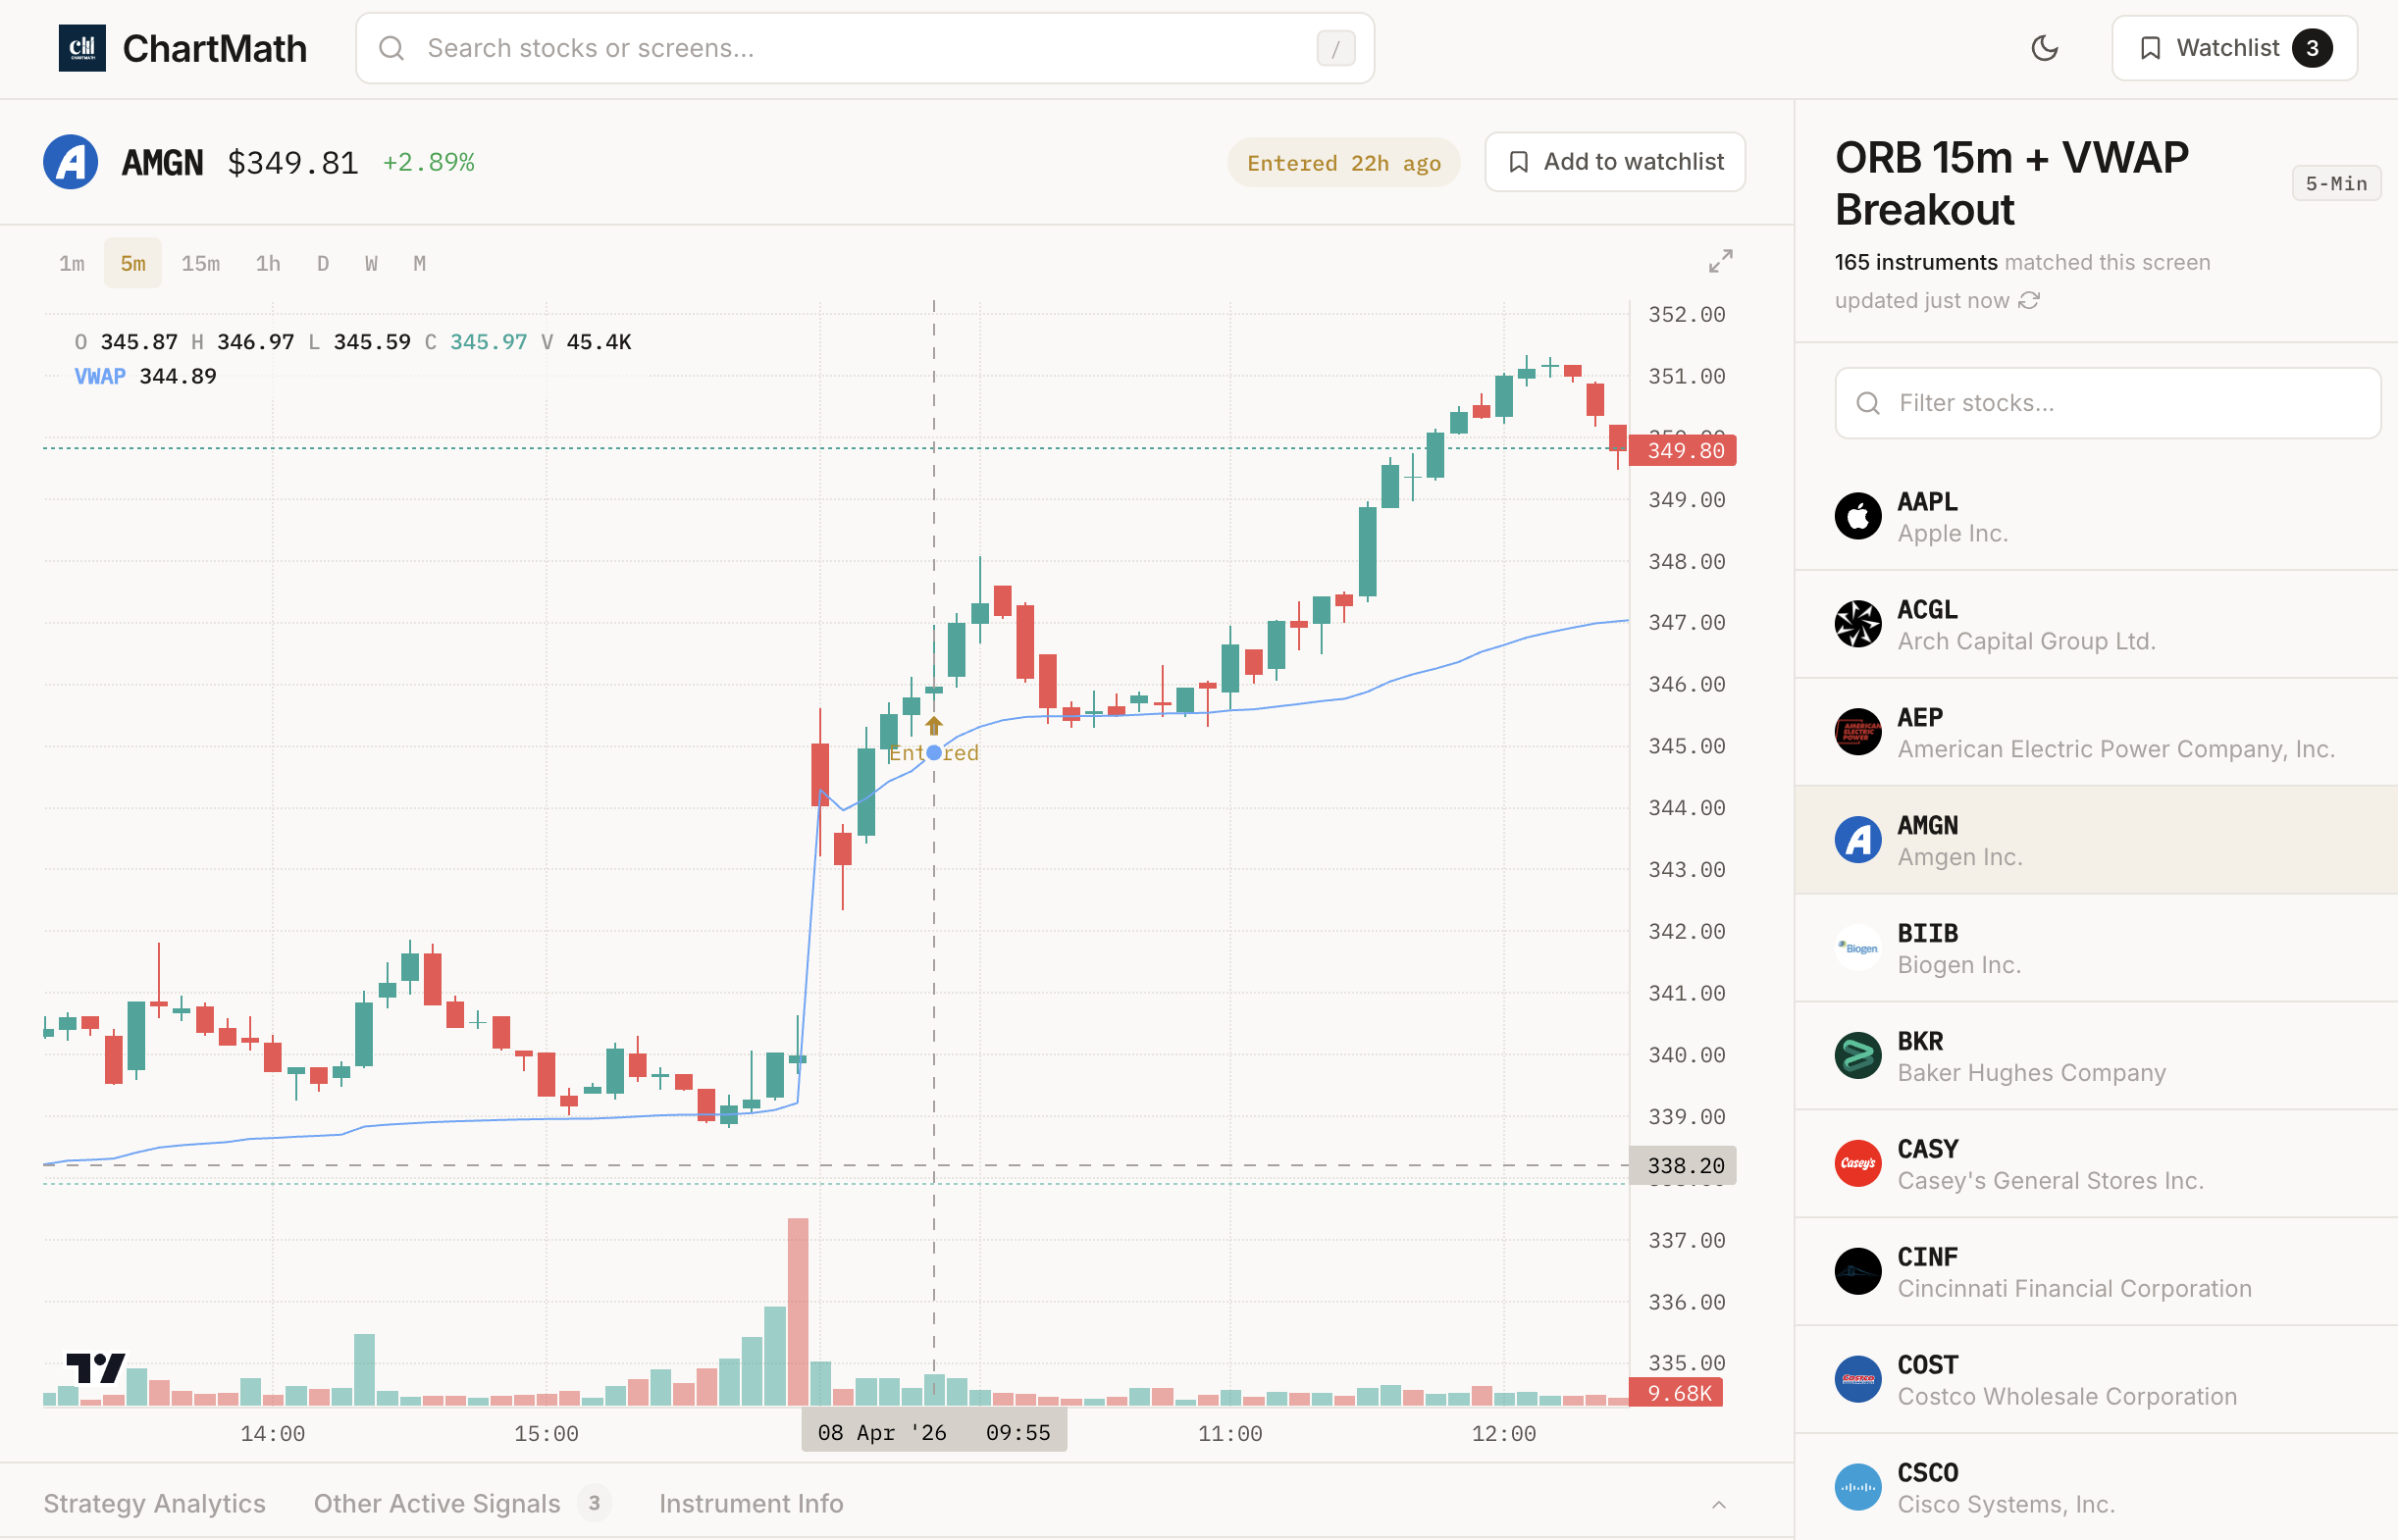
The challenge with combining indicators is information overload. Monitoring VWAP, RVOL, moving averages, RSI, and chart patterns across dozens of stocks manually is impossible. This is where modern scanning tools become essential. Platforms like ChartMath run 200+ pre-built screens that combine VWAP with other technical indicators, showing you only the setups where multiple signals align. Instead of manually checking every stock, you get alerts when high-probability VWAP trading opportunities form.
5. Optimize Your VWAP Trading Timeframes
The timeframe you use for VWAP trading dramatically affects your results. Different trading styles require different chart intervals, and VWAP behaves differently across these timeframes.
1-minute charts are for scalpers who hold positions for 5-15 minutes. On this timeframe, VWAP provides rapid-fire signals. You'll see multiple VWAP touches throughout the day, offering frequent entry opportunities. The downside: more noise and false signals. You need tight stops and quick decision-making. 1-minute VWAP trading works best during the first and last hour when volume is highest.
5-minute charts are the sweet spot for most day traders. This timeframe filters out some of the 1-minute noise while still providing enough signals for active trading. VWAP bounces and breaks on 5-minute charts tend to have better follow-through. You can hold positions for 30 minutes to 2 hours, giving trades room to develop. This is the most popular timeframe for VWAP trading strategies.
15-minute charts suit swing traders and position builders. VWAP signals on this timeframe are less frequent but more reliable. A VWAP bounce on a 15-minute chart often leads to moves lasting several hours or even into the next day. This timeframe works well for traders who can't watch screens constantly, you can check charts every 30-60 minutes and still catch quality setups.
Hourly charts are less common for VWAP trading but useful for longer intraday holds. By this timeframe, VWAP has stabilized significantly, and touches are rare. When they do occur, they often mark major turning points in the day's action.
Multi-timeframe analysis is where experienced VWAP traders gain an edge. Check the 15-minute chart to identify the overall trend and key VWAP levels, then drop to the 5-minute chart for precise entry timing. If VWAP is holding as support on both the 15-minute and 5-minute charts, that's stronger confirmation than a signal on just one timeframe.
The best times of day for VWAP trading are market open (9:30-11:00 AM ET) and power hour (3:00-4:00 PM ET). These periods have the highest volume, which makes VWAP more reliable. During the midday lull (11:30 AM-2:30 PM), volume drops and VWAP signals become less trustworthy. Many professional day traders step away during midday and focus their VWAP trading on the high-volume bookends of the session.
Your trading style should dictate your timeframe choice. Scalpers need 1-minute charts and constant attention. Day traders thrive on 5-minute charts with moderate monitoring. Swing traders can use 15-minute charts and check in periodically. Match your timeframe to your available time and temperament, forcing yourself to scalp on 1-minute charts when you can only check your phone every hour is a recipe for frustration.
6. Automate VWAP Signal Detection with Scanning Tools
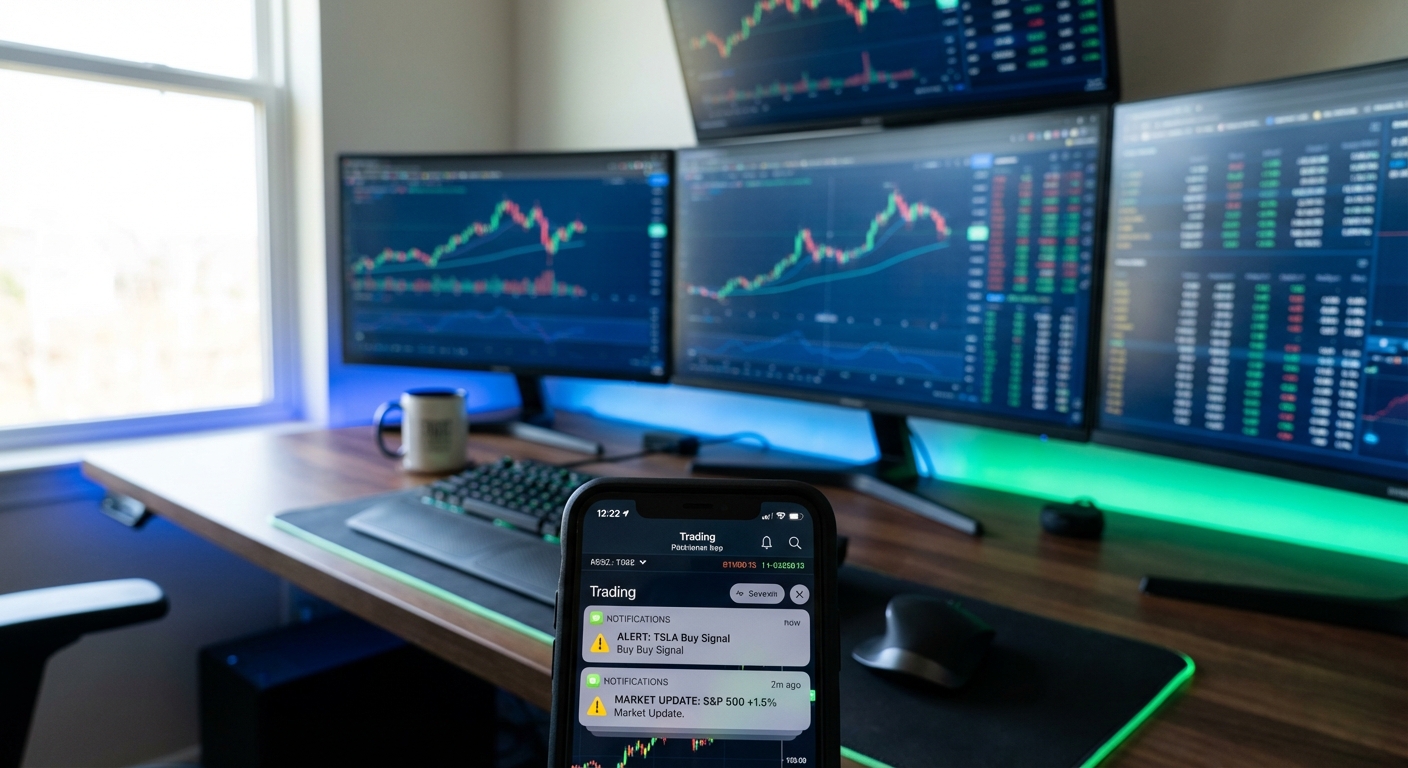
Here's the problem with manual VWAP trading: you can't watch 500 stocks simultaneously. While you're analyzing one chart, a perfect VWAP bounce is forming on another stock you never even looked at. You refresh your screener, but by the time you see the alert, the move is already halfway done. You're always one step behind.
This is why serious VWAP traders use real-time scanning tools that monitor the entire market and alert them the moment a setup forms. Instead of manually checking charts, the software does the heavy lifting and notifies you only when your criteria are met.
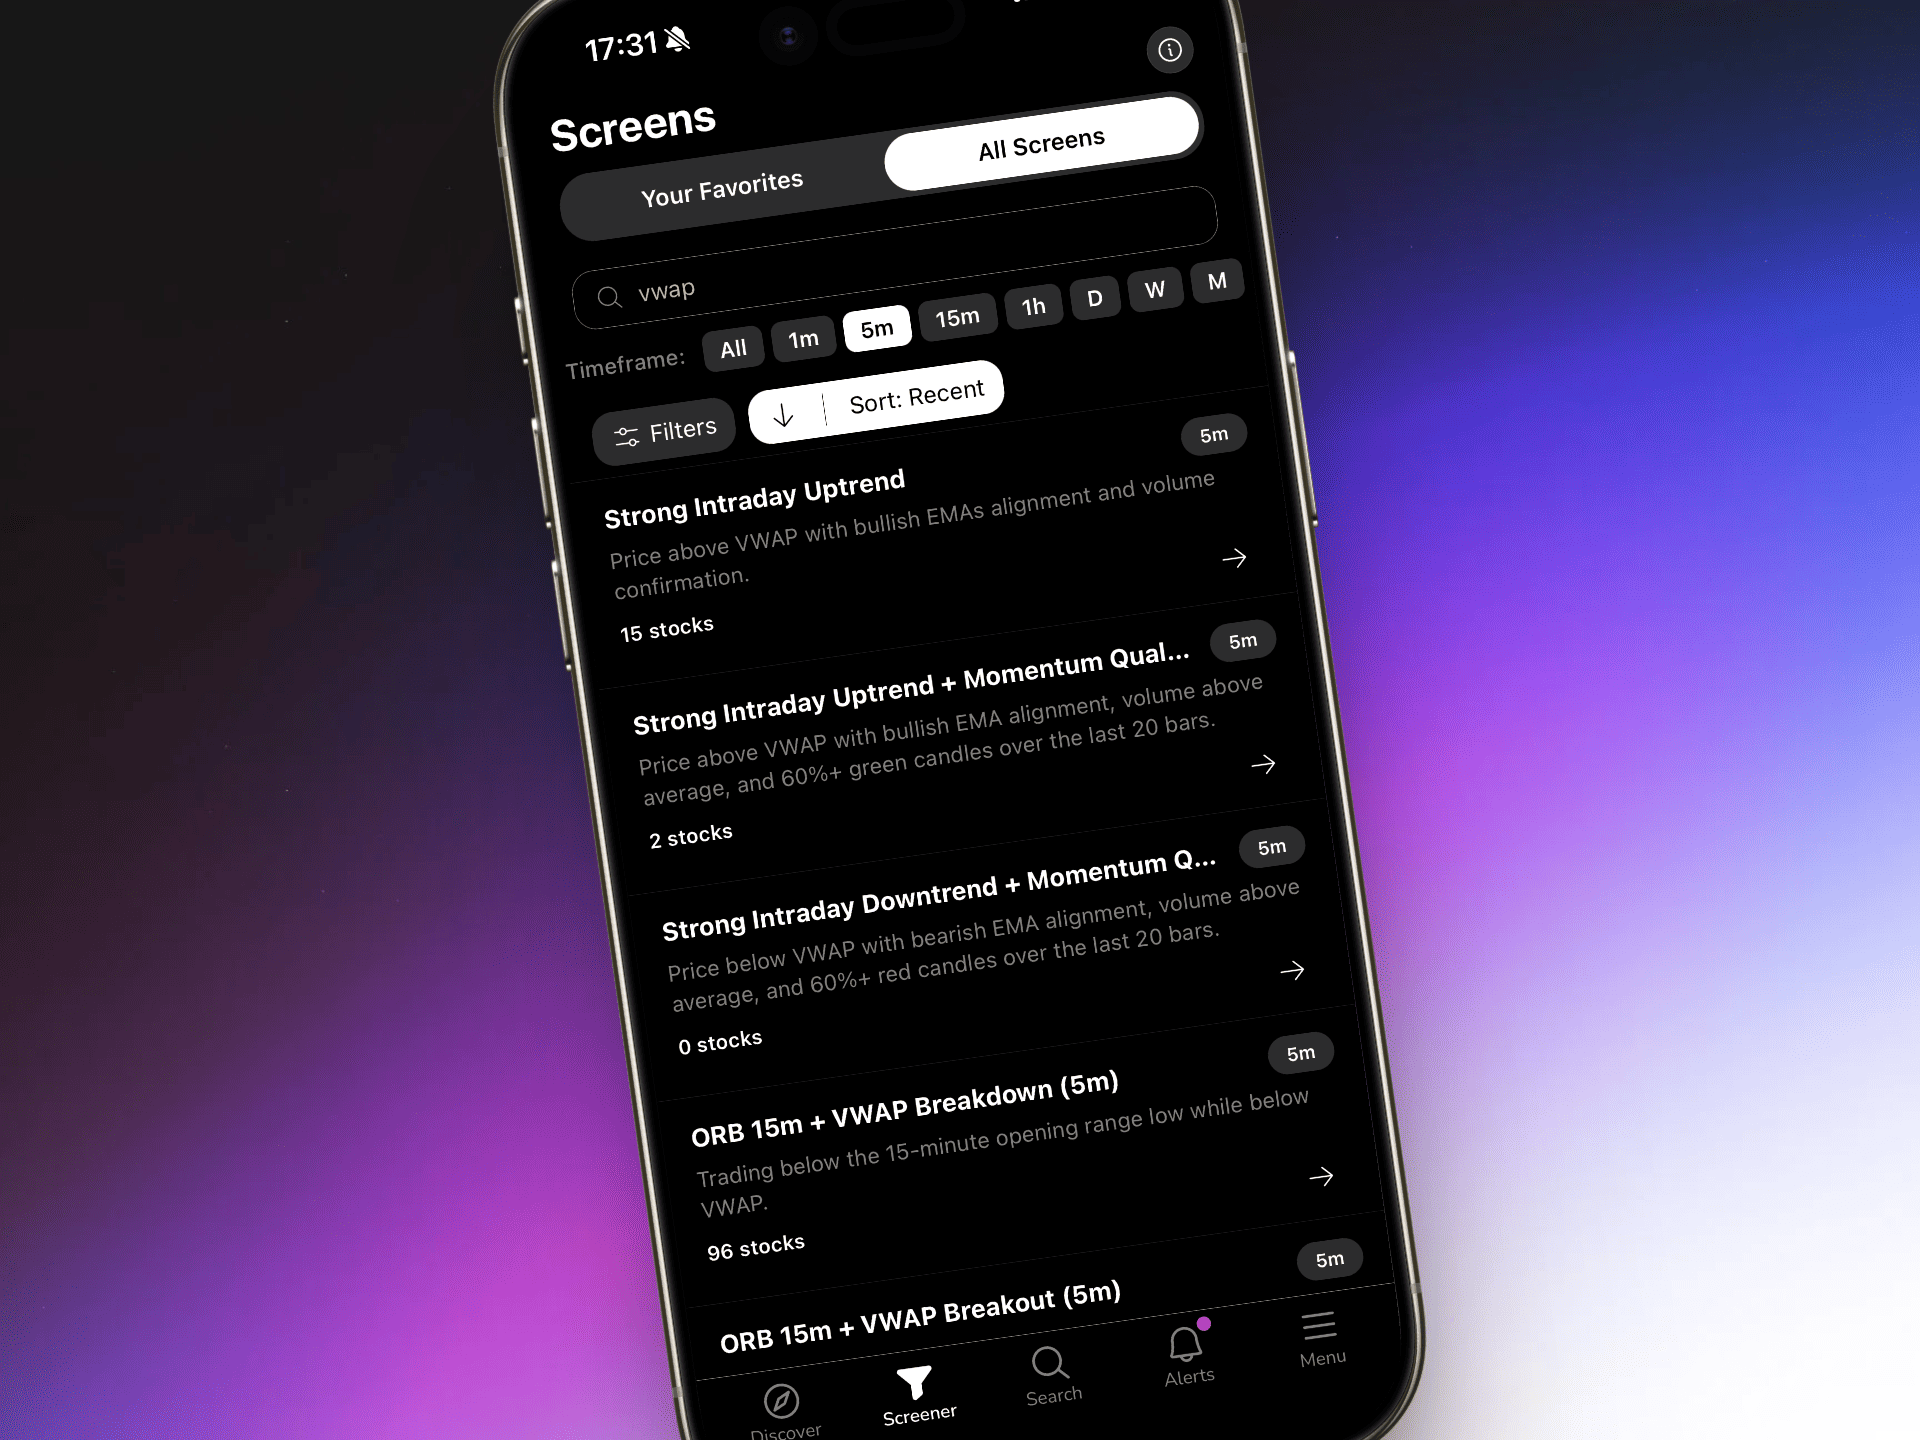
Modern stock screeners can detect VWAP bounces, VWAP reclaims, and VWAP breakdowns as they happen. You set your parameters, minimum RVOL, price range, volume requirements, and the scanner continuously monitors thousands of stocks. When a stock meets your VWAP trading criteria, you get an instant alert on your phone or desktop.
The real value comes from backtest data. Not all VWAP setups are created equal. A VWAP bounce on a low-float stock with 5x RVOL has different characteristics than a VWAP bounce on a large-cap stock with 1.2x RVOL. Scanning tools that include historical performance data show you which specific VWAP trading setups have the highest win rates and average returns.
ChartMath takes this approach with its platform. Instead of just showing you stocks near VWAP, it runs 200+ pre-built technical screens, including multiple VWAP strategies, and displays backtest data for each setup. You can see the historical win rate, average return per trade, and maximum drawdown for VWAP bounces, VWAP reclaims, and other technical setups. This data-driven approach helps you focus on the VWAP trading strategies that actually work, not just the ones that sound good in theory.
The mobile-first design means you get push alerts the moment a VWAP setup forms, even if you're away from your desk. Each alert includes a plain-English explanation of why the signal triggered—"AAPL reclaimed VWAP on 2.3x RVOL with volume surge"—so you understand the context immediately. No more decoding cryptic alerts or wondering why your screener flagged a stock.
Integration with your existing workflow is key. Scanning tools shouldn't replace your charting platform, they should complement it. When you get a VWAP alert, you open your charting software to confirm the setup and execute the trade. The scanner finds opportunities; you make the final decision. This is the approach covered in detail in our guide on integrating trading alerts with your charting platform.
For traders who can't watch screens all day, those with day jobs, other commitments, or simply a desire for better work-life balance, automated VWAP scanning is the difference between missing most opportunities and catching the best ones. You're not glued to your screen refreshing charts every 30 seconds. You're living your life, and your phone buzzes when a high-probability VWAP trading setup appears.
Common VWAP Trading Mistakes to Avoid
Even experienced traders make these VWAP trading errors. Recognizing them can save you from costly mistakes.
Trading VWAP in low-volume stocks is the most common mistake. VWAP is a volume-weighted indicator, it only works when there's significant volume. On a stock trading 50,000 shares per day, VWAP is essentially meaningless. A few large orders can swing it wildly. Stick to stocks with at least 500,000 shares of daily volume, and preferably 1 million or more. Check RVOL to ensure the stock is actively traded today, not just historically.
Ignoring the broader trend leads to fighting the tape. If the overall market is selling off hard and your stock is below VWAP, taking a long position on a VWAP bounce is swimming upstream. VWAP works best when aligned with the prevailing trend. In strong uptrends, focus on VWAP bounces. In downtrends, focus on VWAP breakdown shorts or stay flat.
Chasing price too far from VWAP destroys your risk-reward ratio. If price is 2% above VWAP and you buy, where do you put your stop? Below VWAP means a 2%+ stop, which requires a 4-6% move to hit 2:1 or 3:1 reward-risk. The best VWAP trading entries happen close to the VWAP line, where stops are tight and potential rewards are large relative to risk.
Not waiting for volume confirmation results in false signals. A VWAP bounce on declining volume often fails. A VWAP break on light volume usually reverses. Volume is the fuel that drives price movement. Without it, VWAP signals are just noise. Always check that volume is elevated when taking VWAP setups.
Overtrading VWAP touches without additional confluence is another trap. Just because price touched VWAP doesn't mean you have a trade. You need confirmation: volume, trend alignment, support/resistance confluence, or other technical indicators. Taking every VWAP touch blindly leads to death by a thousand cuts.
Using VWAP on longer timeframes where it loses effectiveness is a waste of time. VWAP is an intraday tool. On daily charts, it's just the average price for that day, not particularly useful. On weekly or monthly charts, it's meaningless. Keep VWAP trading on intraday timeframes where it was designed to work.
One more mistake: not tracking your VWAP trading performance. Without data, you don't know if your approach is working. Keep a trading journal that records every VWAP setup you take, the timeframe, the outcome, and what confluence factors were present. Over time, you'll see which VWAP trading strategies work best for your style and which ones to avoid.
Real-World VWAP Trading Examples
Theory is useful, but seeing VWAP trading in action makes it click. Here are three real-world scenarios that illustrate how these setups play out.
Example 1: Morning VWAP Bounce on a Gapping Stock
A biotech stock gaps up 8% on positive FDA news, opening at $42.50 with VWAP starting at $42.30. In the first 30 minutes, price surges to $44.20, then pulls back to $42.80 (just above VWAP) at 10:15 AM. Volume on the pullback is decreasing, profit-taking, not panic selling. At 10:18 AM, a 5-minute candle forms a long lower wick at $42.70, rejecting right at VWAP, and closes at $43.10 on a volume surge. RVOL is 3.2x.
Entry: $43.15 on the next candle. Stop: $42.50 (below VWAP). Target: $44.20 (previous high). Risk: $0.65. Reward: $1.05. Ratio: 1.6:1. The stock reaches $44.30 within 45 minutes, and you exit at $44.20 for a 2.4% gain.
This is a textbook VWAP bounce: gap up, pullback to VWAP, rejection with volume, continuation higher. The high RVOL and news catalyst provided additional conviction.
Example 2: VWAP Reclaim During Midday Consolidation
A tech stock opens at $128, trades down to $125 by 10:30 AM (below VWAP at $126.50), and consolidates between $125-$126 for two hours. At 12:45 PM, price breaks above VWAP on a 15-minute candle with volume 1.8x the recent average, closing at $127.20. The next candle pulls back to $126.60 (VWAP is now at $126.50), holds for 5 minutes, then continues to $127.80.
Entry: $126.70 on the retest of VWAP. Stop: $126.20 (below VWAP). Target: $128.50 (morning high). Risk: $0.50. Reward: $1.80. Ratio: 3.6:1. The stock reaches $128.40 by 2:00 PM, and you exit at $128.30 for a 1.2% gain.
This VWAP reclaim worked because price held above VWAP on the retest, confirming the flip from resistance to support. The midday timing is less ideal (lower volume), but the clean retest and hold made it a valid setup. This type of setup is exactly what real-time breakout scanners are designed to catch.
Example 3: Failed VWAP Break and Reversal Trade
A retail stock is trading above VWAP all morning, with VWAP at $67.80 and price at $68.50. At 11:20 AM, price drops to $67.70 (below VWAP) on a 5-minute candle, but volume is only 0.8x recent average, light volume. The next candle drops to $67.50, still on weak volume. At 11:30 AM, price reverses sharply, closing back above VWAP at $68.00 on a volume surge.
Entry: $68.10 (recognizing the failed breakdown). Stop: $67.40 (below the false break low). Target: $68.80 (previous resistance). Risk: $0.70. Reward: $0.70. Ratio: 1:1. The stock reaches $68.75 within 20 minutes, and you exit at $68.70 for a 0.9% gain.
This example shows the importance of volume. The initial break below VWAP lacked conviction, making it a false signal. Experienced VWAP traders recognize these failed breaks and trade the reversal. The quick move back above VWAP with volume confirmed the trap, and shorts likely covered, fueling the bounce.
After each trade, analyze what worked and what didn't. Did you enter at the right time? Was your stop placement appropriate? Did you exit too early or hold too long? This post-trade analysis, combined with the backtest data available through platforms like ChartMath, helps you refine your VWAP trading approach over time. For more on this process, check out our guide on building winning backtesting strategies.
Building a Complete VWAP Trading Workflow
Successful VWAP trading isn't just about knowing the setups, it's about having a systematic workflow that ensures you're prepared, focused, and disciplined throughout the trading day.
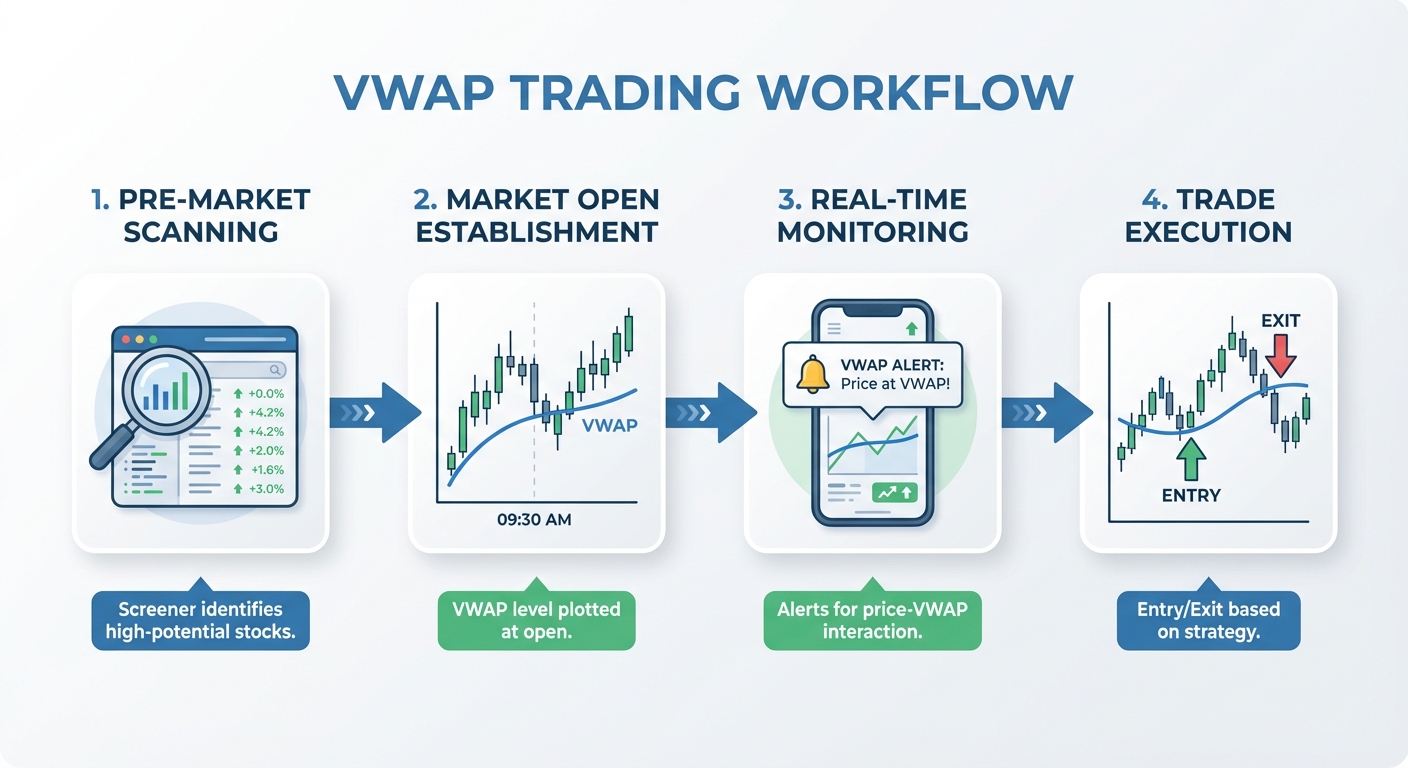
Pre-market (7:00-9:30 AM ET): Start by identifying high-volume candidates with VWAP potential. Look for stocks with news catalysts, earnings reports, or unusual pre-market volume. These are the stocks most likely to have active VWAP trading opportunities once the market opens. Build a watchlist of 10-20 stocks that meet your criteria: market cap above $500M, average daily volume above 1M shares, and some catalyst driving interest.
Market open (9:30-10:00 AM): Watch how VWAP establishes in the first 30 minutes. On gapping stocks, VWAP often starts near the opening price and shifts as volume comes in. Don't rush into trades in the first 5-10 minutes, let VWAP stabilize. By 9:45-10:00 AM, you'll have a clearer picture of whether VWAP is acting as support or resistance.
Intraday (10:00 AM-4:00 PM): This is where automated scanning becomes essential. You can't manually monitor 20 stocks across multiple timeframes for 6 hours. Set up real-time alerts for VWAP bounces, VWAP reclaims, and VWAP breakdowns on your watchlist. When an alert fires, open your charting platform, confirm the setup, and execute if it meets your criteria. Between alerts, you can focus on other tasks rather than staring at charts.
Integration with your charting platform: Your scanning tool and charting platform should work together seamlessly. When ChartMath alerts you to a VWAP bounce on TSLA, you open TradingView or Thinkorswim to see the full chart, confirm the setup with additional indicators, and place the trade through your broker. The scanner finds opportunities; your charting platform provides the detailed analysis; your broker executes the trade. Each tool has a specific role in your VWAP trading workflow.
ChartMath fits into this workflow by handling the time-consuming scanning and monitoring. Instead of manually checking 20 stocks every 15 minutes (80 chart checks per day), you get push alerts only when high-probability setups form. The mobile app means you're never tied to your desk, you can be at the gym, in a meeting, or running errands, and still catch quality VWAP trading opportunities.
End-of-day review (4:00-5:00 PM): Track your VWAP trading performance. Which setups worked? Which failed? Was there a pattern to your winners and losers? Did you follow your rules or deviate? This daily review is how you improve over time. Keep a spreadsheet or trading journal with every VWAP trade: entry price, exit price, timeframe, confluence factors, and outcome.
For swing traders who can't monitor markets during the day, the workflow is simpler: use end-of-day scans to identify stocks where VWAP setups are forming on 15-minute or hourly charts, set alerts for the next day, and check in periodically. The principles are the same, but the execution is less time-intensive. Our swing trading guide for busy professionals covers this approach in detail.
The key to a successful VWAP trading workflow is consistency. Follow the same process every day. Use the same criteria for entries and exits. Track your results systematically. Over time, this disciplined approach compounds into significant edge and profitability.
Start Trading VWAP with Confidence
VWAP trading offers a clear, data-driven approach to identifying high-probability entry and exit points in day trading and swing trading. By understanding how VWAP acts as dynamic support and resistance, recognizing the most reliable setups like VWAP bounces and reclaims, and combining VWAP with other technical indicators for confirmation, you can significantly improve your timing and win rates.
The difference between knowing about VWAP and profiting from VWAP trading comes down to execution. You need a systematic workflow that includes pre-market preparation, real-time monitoring during market hours, and post-trade analysis. Most importantly, you need tools that automate the time-consuming parts, scanning hundreds of stocks, detecting setups as they form, and alerting you instantly, so you can focus on making smart trading decisions rather than manually refreshing charts.
ChartMath was built specifically for this purpose. With 200+ pre-built technical screens including multiple VWAP trading strategies, real-time alerts with plain-English explanations, and backtest data showing historical win rates and average returns, you get everything you need to trade VWAP effectively without spending hours glued to your screen. The mobile-first design means you catch opportunities whether you're at your desk or on the go.
Ready to see how automated VWAP scanning can transform your trading? Watch a demo to see ChartMath's VWAP trading screens in action, or download the app and start discovering high-probability VWAP setups today. Your next winning VWAP trade is forming right now, make sure you don't miss it.

Ankush Jindal
LinkedInSee these setups live in ChartMath
200+ curated screens with backtest data. 14-day free trial.