Table of Contents
You've refreshed Finviz 47 times today. You've got six browser tabs open, three alert windows blinking, and you still missed that ORB breakout on NVDA at 9:35 AM. Sound familiar? Choosing the best stock screener isn't just a nice-to-have for technical traders — it's the difference between catching high-probability setups and watching them fly by from the sidelines. In 2026, the market moves faster than ever, and your screening tool needs to keep up.
This guide compares the top stock screener platforms head-to-head: ChartMath, TradingView, Trade Ideas, Finviz, TrendSpider, and Tickeron. We'll break down real-time scanning, pre-built technical screens, backtest data, mobile accessibility, and alert quality — so you can pick the right tool for your trading style without wasting another afternoon on a platform that doesn't fit.
Why Choosing the Right Stock Screener Matters in 2026
The average stock screener isn't built for the way active technical traders actually work. Most platforms were designed for fundamental investors who filter by P/E ratios and market cap. But if you're trading ORB breaks, VWAP reclaims, or momentum spikes, you need a tool that speaks your language — in real time, on your phone, with context about why a setup triggered.
The cost of using the wrong screener is real. Alert fatigue from low-quality notifications trains you to ignore your alerts. End-of-day-only updates mean you miss intraday momentum plays entirely. Platforms that require coding (looking at you, Pine Script) lock out traders who don't have a software engineering degree. And desktop-only tools leave you blind the moment you step away from your desk.
The best stock screener for technical traders in 2026 needs to do three things well: scan the entire market continuously, surface only high-quality setups with proven edges, and deliver those setups to you wherever you are. Let's look at what separates the best from the rest.
What Makes the Best Stock Screener for Technical Traders?
Before diving into the platform-by-platform comparison, it's worth establishing the criteria that actually matter for technical traders. Not all screeners are created equal, and the features that matter for a swing trader differ from what a day trader needs.
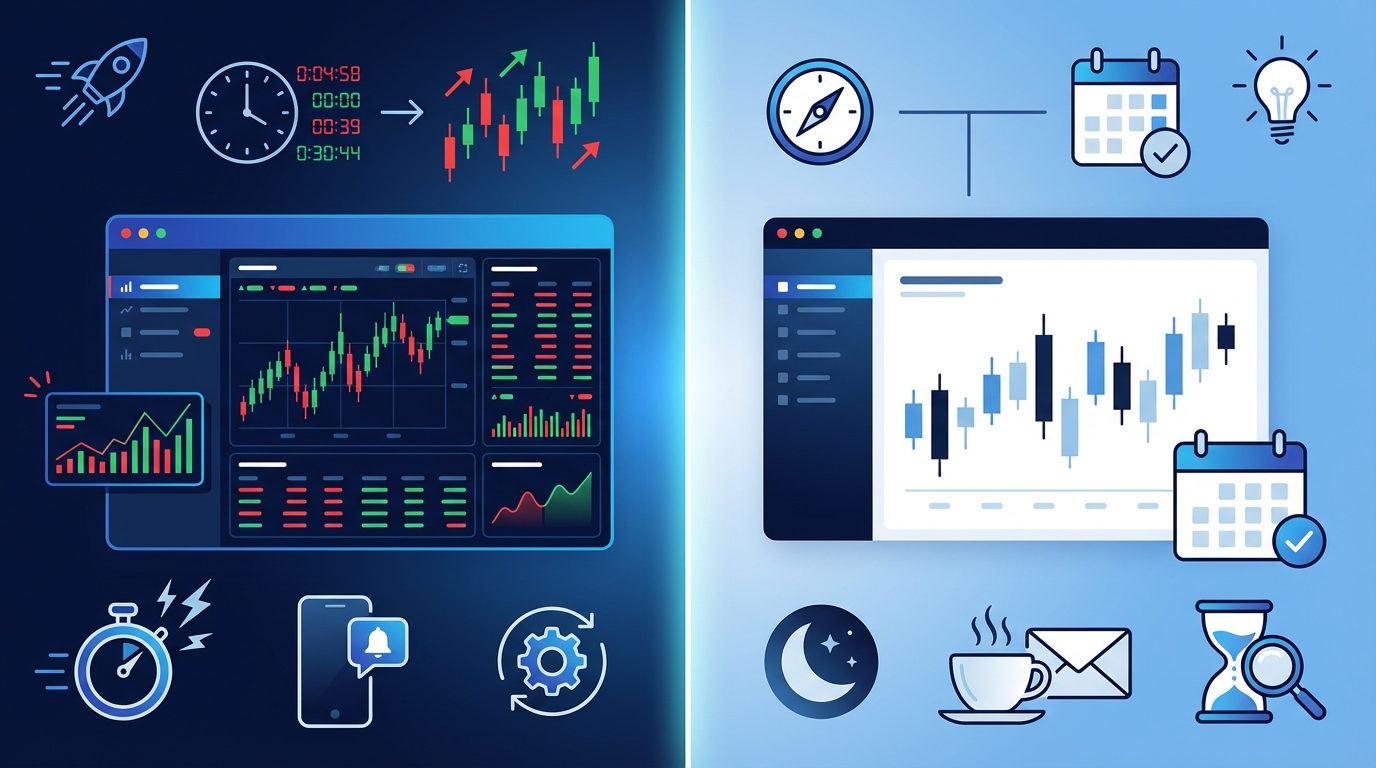
Real-Time vs. End-of-Day Scanning
For day traders and intraday momentum players, real-time scanning is non-negotiable. If your screener updates once at market close, you're not getting trade alerts, you're getting a history lesson. The best stock screener for active traders scans continuously throughout the session, flagging setups as they develop on 1-minute, 5-minute, and 15-minute timeframes. Swing traders have more flexibility, but even they benefit from intraday signals that confirm daily chart setups before the close.
Pre-Built Screens vs. Custom Coding
TradingView's Pine Script is powerful, if you know how to use it. Most traders don't, and they shouldn't have to. The best stock screener platforms offer a library of pre-built technical screens covering the setups that actually move stocks: ORB (Opening Range Breakout), VWAP reclaims, relative volume spikes, momentum divergences, and breakout patterns. Pre-built screens get you scanning in minutes, not weeks.
Backtest Data: Knowing Your Edge Before You Trade
Here's a question most screeners can't answer: does this setup actually work? Backtest validation, showing historical win rates, average returns, and drawdown data for each screen, is what separates a signal with a real edge from random noise. Without it, you're flying blind. For a deeper look at building backtested strategies, check out our guide on How to Build Winning Backtesting Strategies.
Alert Quality: Context vs. Spam
Getting 200 alerts a day is worse than getting zero. Alert fatigue is a real problem, and it's caused by platforms that fire notifications without context. The best stock screener sends fewer, smarter alerts, ones that tell you what triggered, why it matters, and what the historical edge looks like. That's actionable intelligence, not noise.
Mobile Accessibility
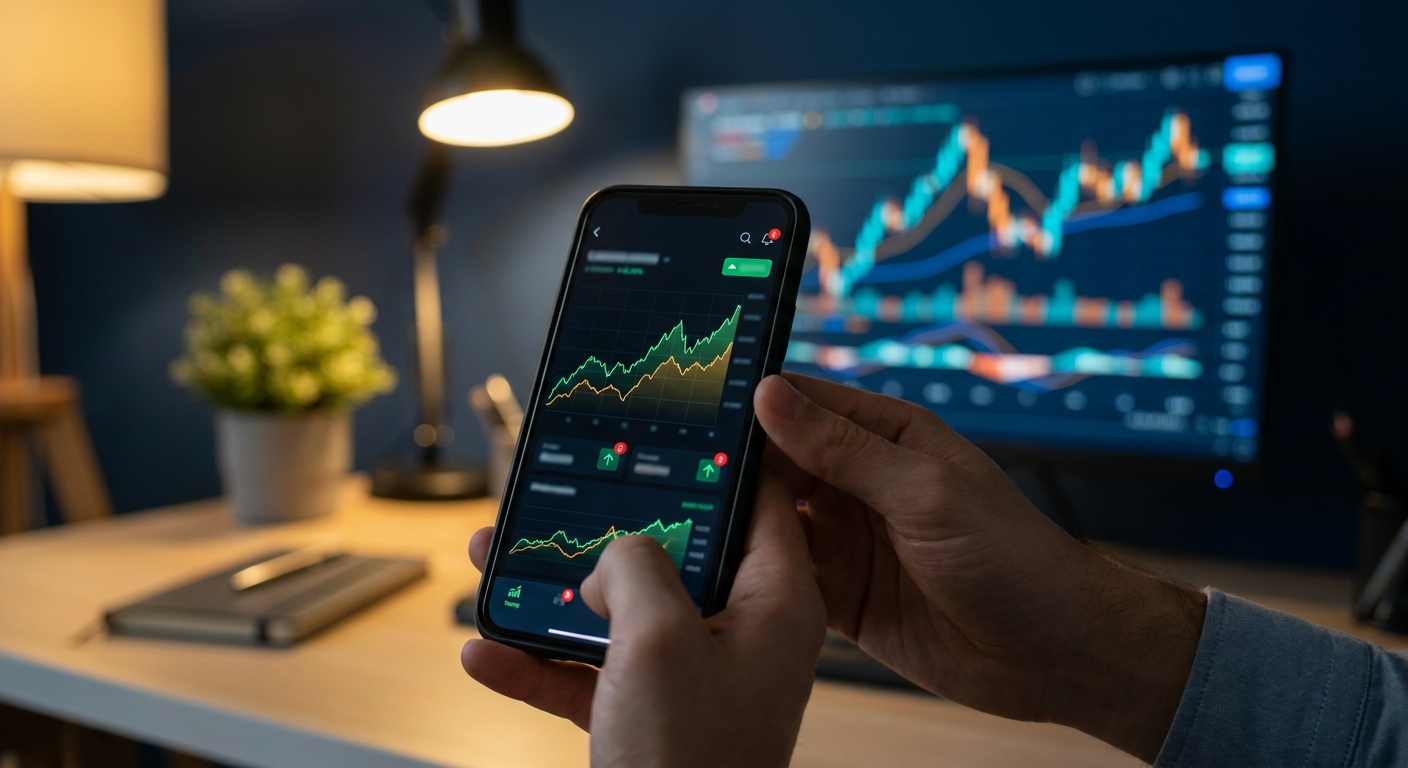
Trading doesn't stop when you leave your desk. Whether you're in a meeting, at lunch, or away from your monitors, your screener should be in your pocket. A mobile-first design with push notifications means you never miss a high-quality setup because you weren't sitting in front of your computer.
Best Stock Screener Platforms Compared: Feature-by-Feature Breakdown
Here's how the major platforms stack up across the criteria that matter most for technical traders:
| Feature | ChartMath | TradingView | Trade Ideas | Finviz | TrendSpider | Tickeron |
|---|---|---|---|---|---|---|
| Real-Time Scanning | ✅ | ⚠️ (with coding) | ✅ | ❌ (EOD only) | ⚠️ (watchlist only) | ⚠️ |
| Pre-Built Technical Screens | ✅ 200+ | ⚠️ Limited | ✅ | ✅ (basic) | ⚠️ | ✅ |
| Backtest Data Per Setup | ✅ | ❌ | ❌ | ❌ | ✅ | ⚠️ (black-box) |
| Mobile App with Push Alerts | ✅ | ⚠️ (limited) | ❌ | ❌ | ❌ | ❌ |
| No Coding Required | ✅ | ❌ | ✅ | ✅ | ✅ | ✅ |
| Alert Context / Explanation | ✅ | ❌ | ❌ | ❌ | ❌ | ❌ |
| Free Tier Available | ✅ | ✅ | ❌ | ✅ (limited) | ❌ | ✅ (limited) |
The table tells a clear story: most platforms excel in one or two areas but fall short where it counts for active technical traders. Let's dig into each platform in detail.
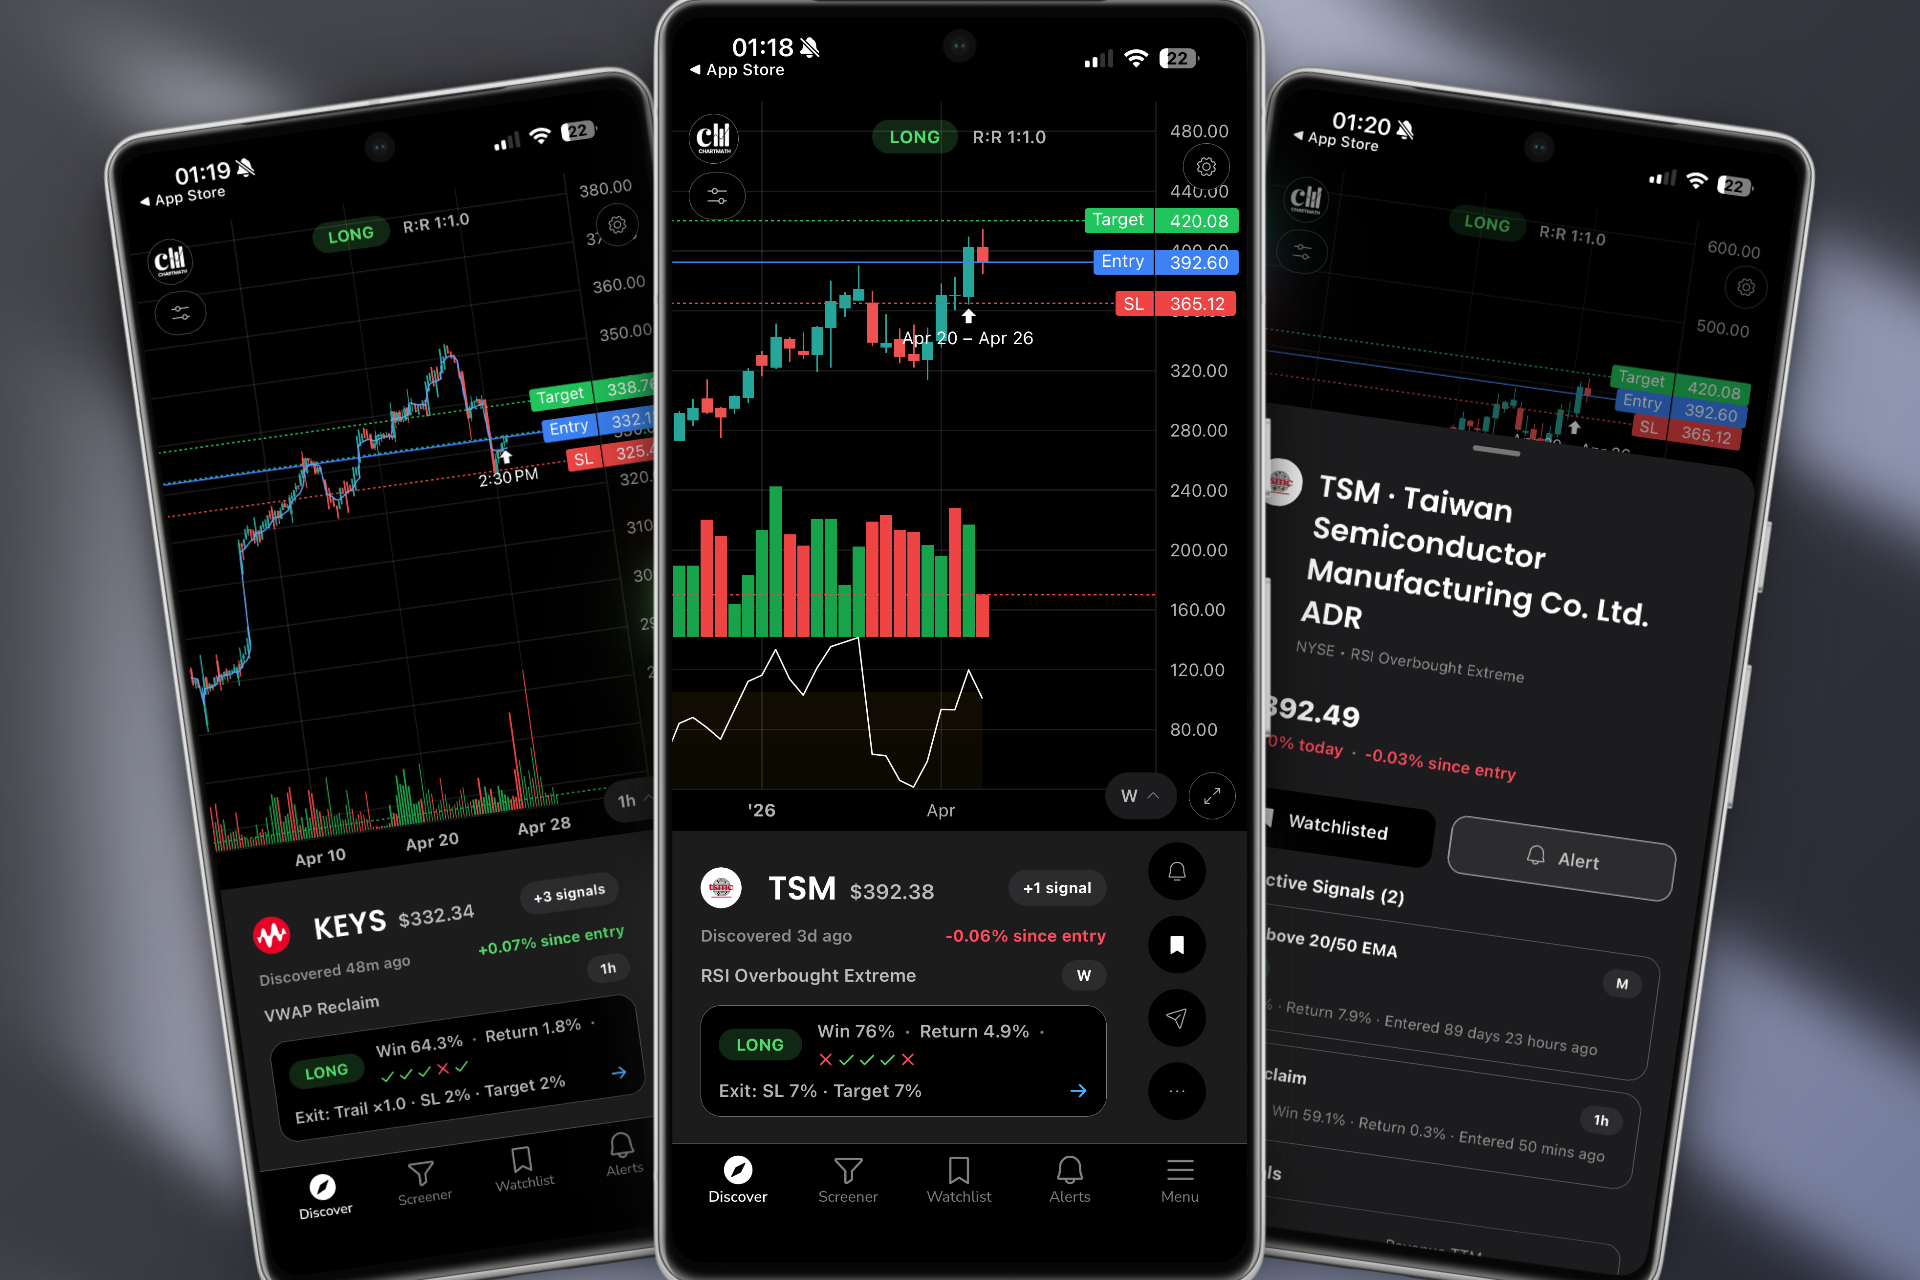
ChartMath: The Mobile-First Best Stock Screener for Active Traders
ChartMath was built from the ground up to solve the problems that frustrate technical traders most: missed entries, alert spam, no context, and being chained to a desktop. It's not trying to be a charting platform, it's a trade discovery engine that works alongside your existing tools.
200+ Pre-Built Technical Screens
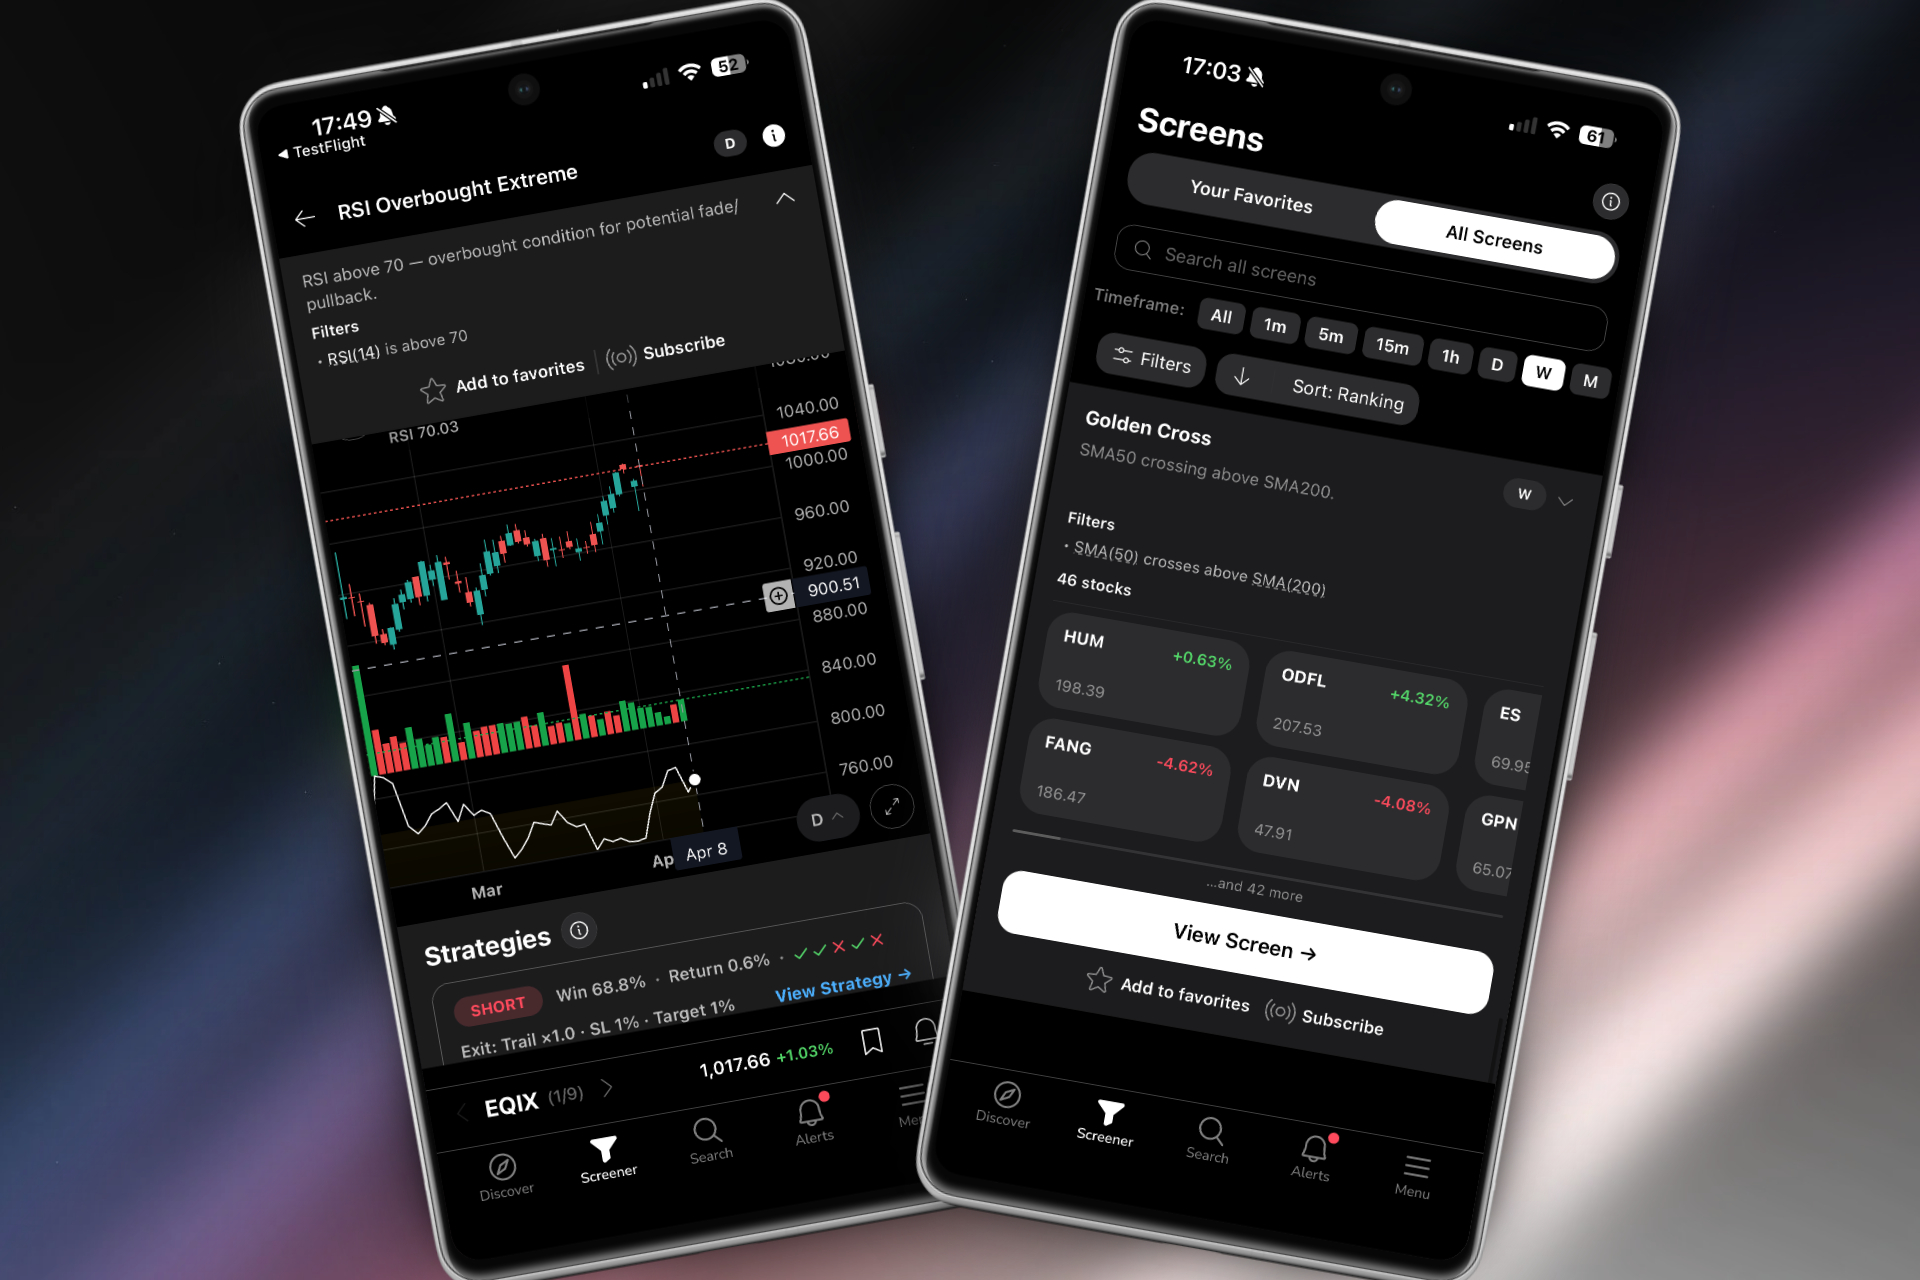
ChartMath scans the entire market continuously across more than 200 curated technical setups. These aren't generic filters, they're purpose-built screens for the setups that technical traders actually use: Opening Range Breakouts (ORB), VWAP reclaims, Relative Volume (RVOL) spikes, momentum breakouts, 52-week highs, and more. No Pine Script. No custom formula building. You open the app and the market is already being scanned for you.
For a deep dive into how these indicators compare, see our breakdown of VWAP vs RVOL vs ORB: Which Technical Indicators Work Best?
Backtest Validation Built Into Every Alert
This is where ChartMath separates itself from every other platform on this list. Every screen comes with historical backtest data, win rates, average returns, and drawdown statistics, so you know the edge behind a setup before you trade it. When an alert fires, you're not guessing whether the pattern works. You have the data to back it up. That's a level of transparency no other screener on this list provides out of the box.
Intelligent Push Alerts With Plain-English Explanations
ChartMath's alerts don't just tell you a stock triggered a screen. They tell you why it triggered, what the setup means, and what the historical performance looks like. This is especially valuable for traders who are still building their technical analysis knowledge. Instead of a cryptic "AAPL alert," you get a clear explanation of the setup, the timeframe, and the edge, delivered as a push notification to your phone.
TikTok-Style Swipe Interface for Fast Discovery
ChartMath's mobile interface uses a swipe-based discovery feed, think TikTok for stock setups. You can swipe through ranked setups in the Discover tab, filter by strategy in the Screener tab, or track your favorites in the Watchlist tab. It's designed for speed. You can evaluate a setup, check the backtest data, and add it to your watchlist in seconds, all from your phone while you're away from your desk.
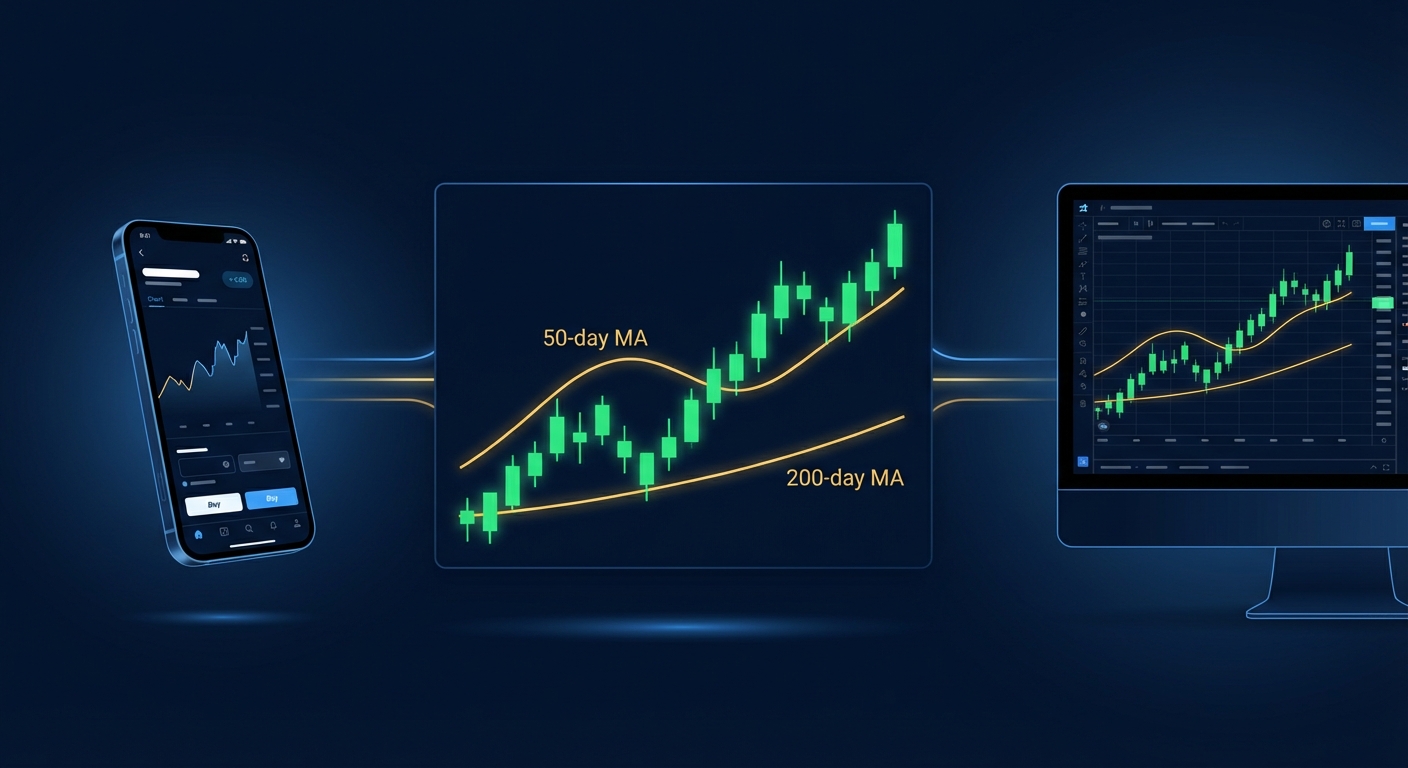
ChartMath supports multi-timeframe analysis from 1-minute to weekly charts, making it equally useful for day traders catching intraday momentum and swing traders building end-of-day watchlists. You can also explore ChartMath's web-based screener if you prefer working from a desktop browser.
Best for: Day traders who need real-time ORB, VWAP, and RVOL alerts on mobile. Swing traders who want end-of-day breakout signals. Beginners who need pre-built screens and plain-English explanations without any coding.
TradingView: Powerful Charts, But Is It the Best Stock Screener?
TradingView is the gold standard for charting. Its community, indicator library, and visual tools are unmatched. But as a stock screener for technical traders, it has real limitations.
Strengths
- World-class charting with thousands of community indicators
- Large, active trading community sharing ideas and scripts
- Pine Script allows highly customized alerts and screens for those who can code
- Free tier with basic screening functionality
Weaknesses
- Requires Pine Script coding to build meaningful custom alerts, a significant barrier for most traders
- Not a proactive screener, it doesn't discover new setups across the market for you
- No backtest data attached to individual alerts
- Mobile app is limited compared to the desktop experience
- Alert context is minimal, you get a notification, not an explanation
TradingView is an excellent charting companion, and ChartMath is designed to work alongside it, not replace it. Use ChartMath to discover setups, then pull up TradingView to confirm the chart before entering. That's a workflow that gets the best out of both tools. For more on building that kind of integrated workflow, read our guide on How to Integrate Trading Alerts with Your Charting Platform.
Best for: Chart analysis and visualization. Traders who already know what stocks they want to watch and need a powerful charting environment.
Trade Ideas: Advanced Scanning Power With a Steep Learning Curve
Trade Ideas is one of the most powerful real-time scanners on the market. Its Holly AI system generates trade ideas automatically, and its scanning engine is genuinely impressive for professional day traders.
Strengths
- Powerful real-time scanning with extensive filter options
- Holly AI system provides automated trade suggestions
- Large library of pre-built scans for active traders
Weaknesses
- Desktop-only, no mobile app with push alerts, meaning you're tied to your computer
- Starts at $118/month, making it one of the most expensive options on this list
- Complex interface that overwhelms beginners and even intermediate traders
- No transparent backtest data per setup, you're trusting the AI without seeing the historical stats
Best for: Professional day traders with a dedicated trading desk, a significant budget, and the time to learn a complex platform.
Finviz, TrendSpider & Tickeron: Filling Specific Niches
These three platforms each serve a specific use case well, but none of them qualify as the best stock screener for active technical traders who need real-time, mobile-first discovery.
Finviz
Finviz is a popular starting point for traders because it's free, visual, and easy to use. Its heatmap and basic screening tools are genuinely useful for getting a broad market overview. But Finviz updates end-of-day on the free tier, has no real-time intraday scanning, and offers no mobile app with push alerts. For momentum traders who need to catch setups as they develop, Finviz simply isn't built for the job. It's a great tool for fundamental screening and market visualization, not for catching ORB breaks at 9:35 AM.
TrendSpider
TrendSpider is an impressive chart analysis platform with automated trendline detection and multi-timeframe analysis. But it's fundamentally a tool for analyzing stocks you're already watching, not for discovering new setups across the entire market. It has no mobile app with push alerts, and it's not designed to proactively surface opportunities you didn't know to look for. If you want to analyze a specific stock's chart in depth, TrendSpider is excellent. If you want to find the best setups in the market right now, it falls short.
Tickeron
Tickeron uses AI-driven pattern recognition to score stocks and generate trade ideas. The concept is solid, but the execution has a transparency problem: its AI scoring is largely a black box. You get a score, but not the underlying backtest statistics that tell you why a setup has an edge. It's also web-only with no mobile push notifications, which limits its usefulness for traders who aren't at their desk. For traders who want to understand the data behind their alerts, Tickeron's opaque approach is a significant drawback.
Best for: Finviz, end-of-day fundamental + technical filtering and market visualization. TrendSpider, deep chart analysis on a focused watchlist. Tickeron, AI-assisted pattern recognition for web-based traders.
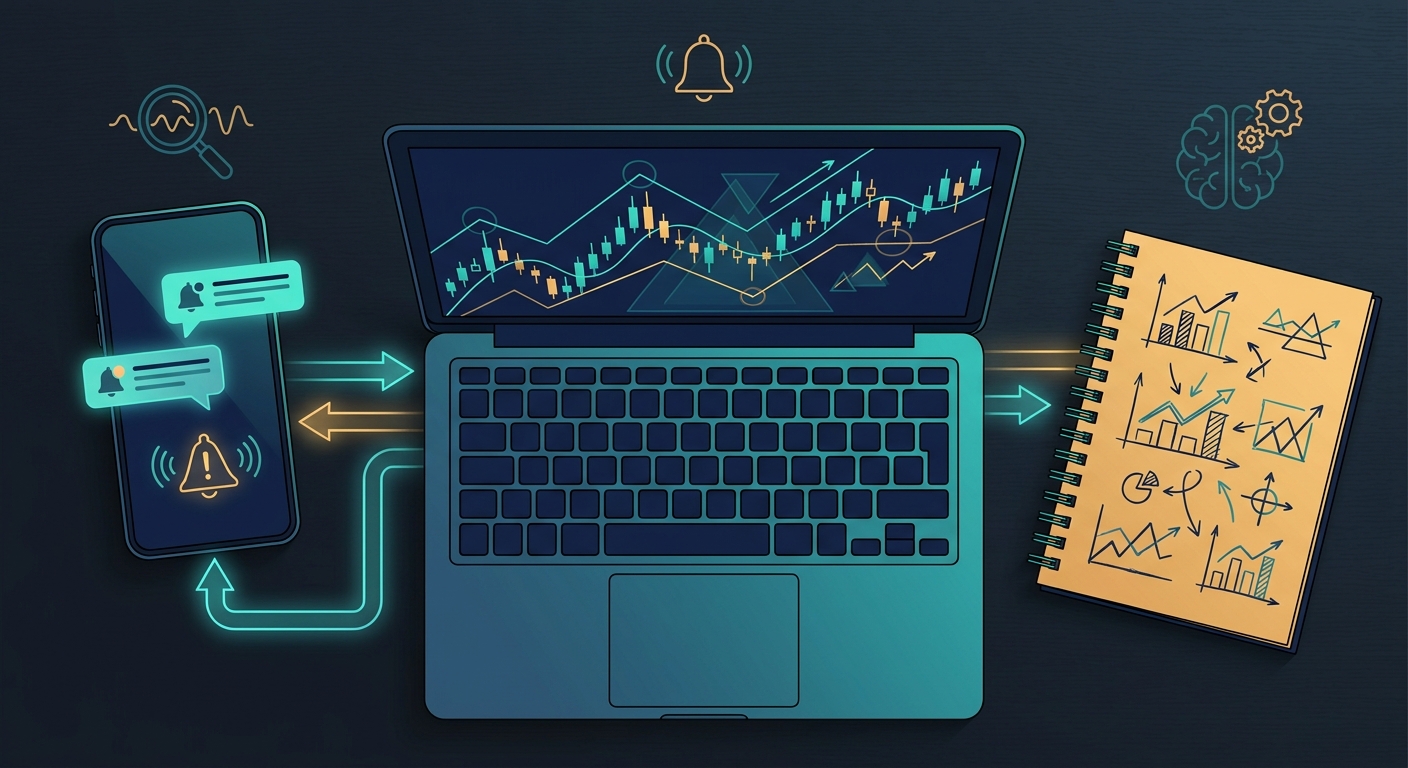
How to Integrate Your Stock Screener Into a Complete Trading Workflow
The best stock screener is only as good as the workflow it fits into. Here's how to build a complete technical trading routine around your screener, whether you're a day trader, swing trader, or somewhere in between.
Premarket Scanning Routine
Before the market opens, your screener should be surfacing stocks with elevated premarket volume, gap-ups or gap-downs with relative volume spikes, and setups that are approaching key technical levels. ChartMath's premarket scanner flags these setups automatically, so you can build your morning watchlist in minutes rather than hours. For a structured approach to premarket preparation, see our guide on Premarket Trading: 7 Strategies to Find High-Probability Setups.
Intraday Alert Management
During market hours, your screener should be doing the heavy lifting. Real-time alerts for ORB breaks, VWAP reclaims, and RVOL spikes should arrive on your phone with enough context to make a quick decision, even if you're not at your desk. The goal is to reduce the time between setup trigger and trade evaluation to seconds, not minutes. Every minute of delay on a momentum play costs you entry quality.
For a detailed breakdown of intraday execution strategies, check out our guide on Intraday Trading: How to Execute 1-Minute to 15-Minute Plays.
End-of-Day Swing Trade Review
Swing traders can use their screener's end-of-day signals to build a watchlist for the next session. Look for stocks that triggered breakout screens on daily or weekly timeframes, then review the charts on your charting platform to confirm the setup. This 30-minute routine is all you need to stay on top of swing opportunities without spending your entire evening scanning charts. Our Swing Trading for Busy Professionals: 30-Minute Daily Guide walks through exactly this process.
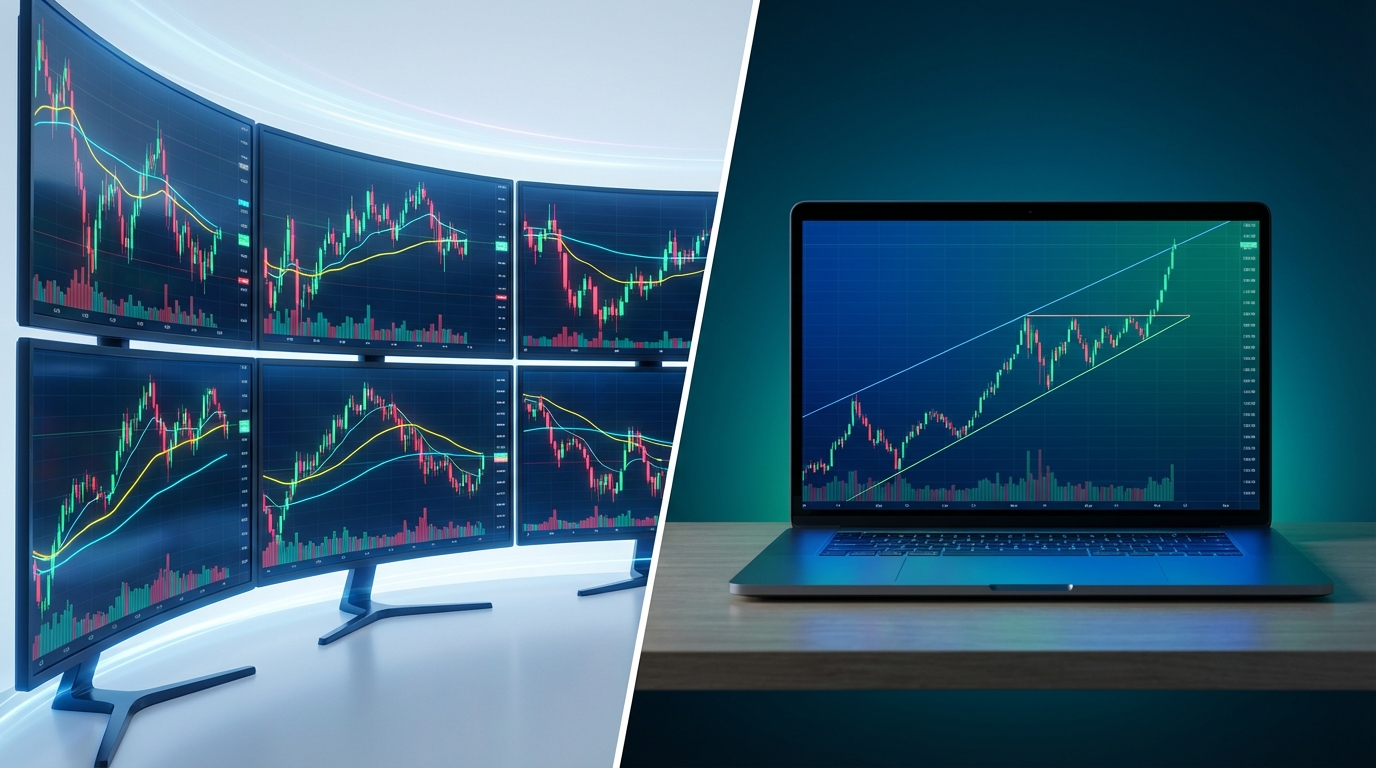
Pairing Your Screener With a Charting Platform
The most effective technical traders use their screener for discovery and their charting platform for confirmation. ChartMath surfaces the setup and provides the backtest context. TradingView (or your preferred charting tool) lets you zoom in on the chart, check key levels, and plan your entry and exit. These tools are complementary, not competing. For a complete look at building this kind of efficient system, read our guide on How to Build an Efficient Trading Workflow in 2026.
Which Best Stock Screener Is Right for Your Trading Style?
Every trader's needs are different. Here's a quick summary to help you match the right platform to your style:
Day Traders
You need real-time scanning, mobile push alerts, and intraday setups like ORB, VWAP, and RVOL. You can't watch everything at once, and you can't be chained to your desk. ChartMath was built specifically for this use case. Its continuous market scanning, intelligent push alerts, and mobile-first interface make it the best stock screener for active intraday traders. For more on the specific setups that matter most, see our breakdown of 15 Proven Technical Setups Every Day Trader Should Know.
Swing Traders
You need end-of-day breakout signals, daily and weekly timeframe screens, and a watchlist you can review on your own schedule. ChartMath's Screener tab lets you filter by strategy and timeframe, delivering swing trade setups before market close so you can review them in the evening. Finviz can supplement this with fundamental filters, but ChartMath's backtest data gives you the edge context Finviz lacks.
Technical Trading Beginners
You need pre-built screens, plain-English explanations, and backtest data that helps you understand why setups work, without writing a single line of code. ChartMath's intelligent alerts explain each setup in plain language, and the backtest stats show you the historical edge. It's the fastest way to learn technical analysis by seeing real setups in real time with real data behind them.
| Trader Type | Top Pick | Why |
|---|---|---|
| Day Trader | ChartMath | Real-time ORB/VWAP/RVOL alerts, mobile push notifications, 200+ intraday screens |
| Swing Trader | ChartMath + Finviz | Backtested breakout screens + fundamental filters for multi-day positions |
| Beginner | ChartMath | Pre-built screens, plain-English alerts, backtest data, no coding required |
| Chart Analyst | TradingView | Best-in-class charting for stocks you're already watching |
| Professional Desk Trader | Trade Ideas | Advanced scanning power for traders with budget and dedicated setup |
Frequently Asked Questions About Stock Screeners
What is a stock screener and how does it work?
A stock screener is a tool that filters the entire stock market based on specific criteria, price, volume, technical indicators, chart patterns, and more, to surface stocks that match a particular setup. The best stock screener platforms scan continuously in real time and alert you when a stock meets your criteria, so you don't have to manually review thousands of charts.
What is the best free stock screener?
For end-of-day fundamental and technical filtering, Finviz's free tier is a solid starting point. For real-time technical setups with backtest data and mobile alerts, ChartMath offers a free tier that gives you access to its core scanning and discovery features, making it the best free stock screener for active technical traders.
Can I use a stock screener on my phone?
Most screeners are desktop-first, which means you're stuck at your computer to catch alerts. ChartMath is the exception, it's built mobile-first, with a native app and push notifications that deliver setup alerts directly to your phone. You can download the ChartMath app and start receiving real-time technical alerts wherever you are.
Do stock screeners work for swing trading?
Absolutely. The best stock screener for swing trading filters for daily and weekly chart setups, breakouts above resistance, 52-week highs, momentum divergences, and volume confirmation. ChartMath's multi-timeframe support covers daily and weekly screens, delivering end-of-day signals that swing traders can review and act on before the next session opens.
What technical indicators should a stock screener include?
At minimum, a strong technical screener should cover: VWAP (Volume Weighted Average Price), RVOL (Relative Volume), ORB (Opening Range Breakout), RSI, moving average crossovers, and breakout patterns. ChartMath covers all of these and more across its 200+ pre-built screens. For a deeper look at how these indicators compare, see our guide on VWAP vs RVOL vs ORB: Which Technical Indicators Work Best?
How is ChartMath different from a traditional stock screener?
Traditional screeners are passive, you set filters and check results. ChartMath is proactive, it continuously scans the market and pushes alerts to you when high-quality setups emerge. It also provides backtest data for every screen, plain-English explanations for every alert, and a mobile-first interface designed for traders who can't be at their desk all day. It's less of a screener and more of a trade discovery engine.
Stop Missing Setups, Find the Best Stock Screener for Your Style
The right stock screener doesn't just save you time, it changes how you trade. Instead of spending hours refreshing charts and chasing setups you already missed, you get intelligent alerts delivered to your phone the moment a high-quality technical setup emerges. That's the difference between reactive trading and proactive trading.
For most technical traders in 2026, the best stock screener is one that combines real-time market scanning, pre-built technical screens with backtest validation, and mobile-first push alerts that keep you in the game even when you're away from your desk. ChartMath was built to do exactly that, and it's the only platform on this list that delivers all three without requiring a coding degree or a professional trading budget.
Ready to stop missing high-quality setups? Watch the ChartMath demo to see how the platform discovers and delivers technical setups in real time, or download the ChartMath app and start scanning the market with 200+ pre-built technical screens today. Your next great trade is already setting up. Make sure you're there to catch it.
Ankush Jindal
Co-Founder, ChartMath
Ankush Jindal is the Co-Founder of ChartMath, a real-time trade discovery platform that monitors 200+ technical screens across the market to surface actionable setups for technical traders. He holds a B.Tech in Computer Science from IIT Mandi. Before ChartMath, he co-founded two successful technology ventures spanning hundreds of thousands of users. This experience building data-intensive, real-time systems directly shaped his approach to technical analysis tooling. At ChartMath, Ankush leads product vision, designing intuitive interfaces that translate complex price action into clear, backtested signals. His philosophy: trading decisions should be backed by data, not gut feeling.
LinkedInSee these setups live in ChartMath
200+ curated screens with backtest data. Free to use.
Related Articles
Real-Time vs End-of-Day Scanner Software: Which Delivers Better Trading Results in 2026?
Compare real-time and end-of-day backtested stock screener tools for day traders and swing traders. Learn which scanner type delivers better trading results.
Day Trading vs Swing Trading: Which Strategy Fits You?
Compare day trading vs swing trading strategies in 2026. Learn time commitment, capital needs, risk profiles, and which approach fits your schedule.
Golden Cross Scanner: Desktop vs Mobile Trading Platforms 2026
Compare desktop and mobile golden cross scanner platforms for active traders. Discover real-time scanning, alerts, and backtesting features in 2026.