Table of Contents
You've refreshed your screener for the 47th time today. You're stuck in a meeting when your phone buzzes with a generic alert, but by the time you check it, the setup is already gone. Sound familiar? If you're a technical trader in 2026, you know the frustration of traditional stock screeners that were built for a different era.
The right stock screening app can be the difference between catching high-probability setups and watching opportunities slip away. But with dozens of platforms claiming to offer the best scanning capabilities, how do you separate the signal from the noise? This guide walks you through the essential features that matter most when choosing a stock screening app for technical trading, from real-time scanning and backtested strategies to mobile accessibility and intelligent alert filtering.
Whether you're a day trader executing scalps on 5-minute charts or a swing trader looking for end-of-day breakout setups, the screening platform you choose will directly impact your ability to discover, validate, and execute trades efficiently. Let's break down exactly what to look for.
Why Traditional Stock Screeners Are Failing Active Traders
The stock screening landscape has changed dramatically, but many platforms haven't kept up. Traditional screeners were designed for an era when traders sat at desktop computers all day, manually refreshing spreadsheet-style interfaces to find opportunities. In 2026, that approach is fundamentally broken for several reasons.
First, desktop-only screeners trap you at your desk. The market doesn't care that you're in a meeting, picking up your kids, or grabbing lunch. High-probability setups form throughout the trading day, and if your screening tool only works when you're sitting in front of three monitors, you're missing opportunities. The rise of mobile trading has made it clear: traders need access to quality setups wherever they are.
Second, alert fatigue is real. Many screeners blast you with dozens of notifications daily, but without context or quality filtering, you're left wondering which alerts actually matter. When every VWAP cross and volume spike triggers a notification, you start ignoring them all. The result? You miss the one setup that actually had edge.
Third, traders are wasting hours manually scanning charts. If you're spending 30 minutes every morning scrolling through watchlists, checking for breakouts, and validating setups across multiple timeframes, that's time you could spend analyzing entries or managing positions. Efficiency matters, especially for swing traders who only have 30 minutes per day to prepare for the next session.
Finally, most screeners don't tell you why a setup matters. They show you that a stock crossed above VWAP, but they don't explain the historical win rate of that pattern, the average return, or whether it's actually worth trading. Without backtested data, you're flying blind, trusting that the alert has edge when it might just be noise.
The shift is happening toward intelligent, mobile-first screening platforms that prioritize quality over quantity, provide context with every alert, and integrate seamlessly into modern trading workflows. If your current screener feels like a relic from 2015, it probably is.
1. Real-Time Scanning Capabilities: The Foundation of Any Stock Screening App
When evaluating a stock screening app, real-time scanning is non-negotiable for active traders. The difference between a screener that updates every 15 minutes and one that scans the market continuously can mean the difference between catching a momentum breakout at the start of the move or chasing it after it's already extended.
Real-time data matters because technical setups are time-sensitive. An Opening Range Breakout (ORB) on a 5-minute chart might only offer a clean entry for a few minutes before the stock runs or pulls back. If your screener is working with delayed data, you're always one step behind. Day traders executing scalps and intraday plays need platforms that scan the market tick-by-tick, identifying setups the moment they form.
But real-time scanning alone isn't enough. The best stock screening app platforms offer multi-timeframe analysis, allowing you to monitor setups across 1-minute, 5-minute, 15-minute, hourly, daily, and weekly charts simultaneously. A stock might be forming a bull flag on the daily chart while simultaneously showing a VWAP reclaim on the 15-minute timeframe. Multi-timeframe confluence increases the probability of success, and your screener should surface these opportunities automatically.
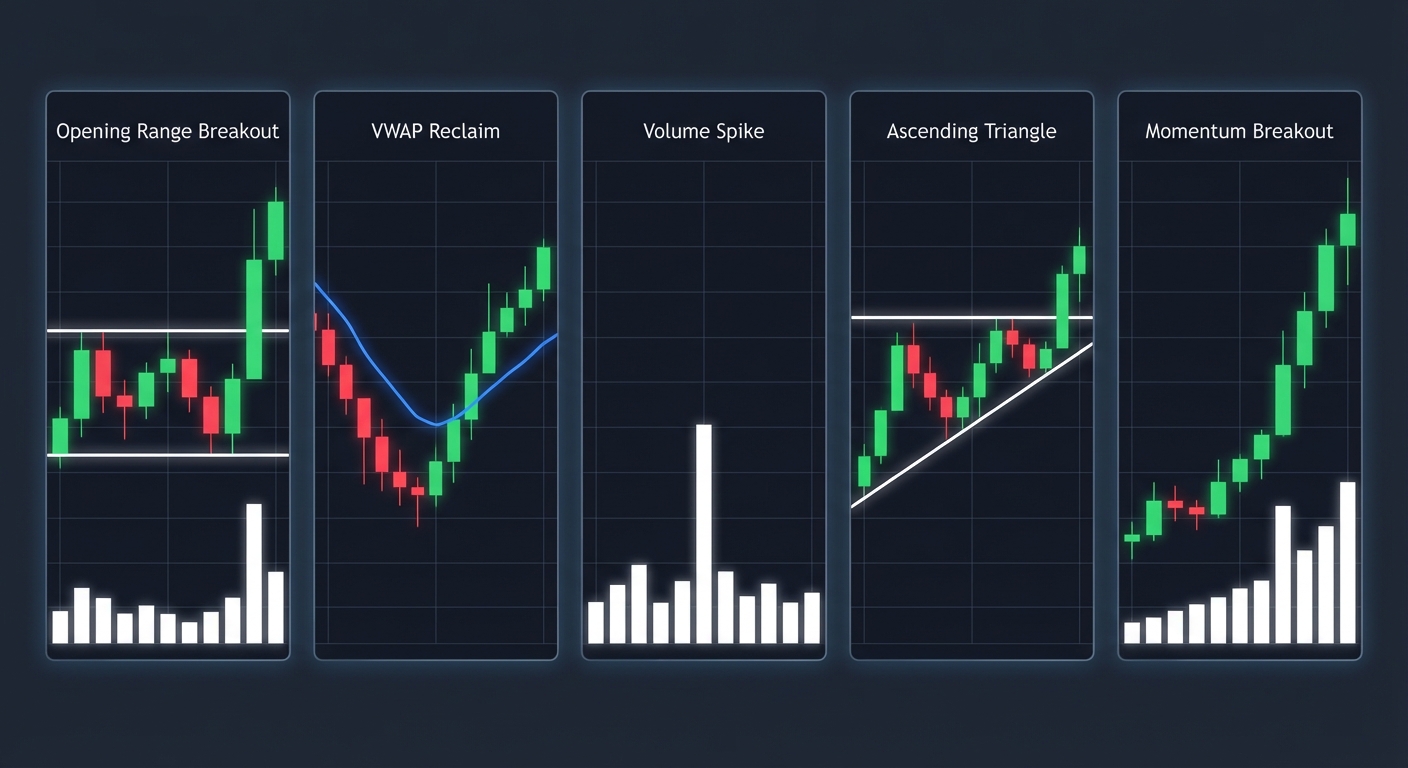
Another critical factor is breadth of coverage. How many technical screens does the platform offer? A screener with 10 basic filters forces you to build everything from scratch. A platform with 200+ pre-built screens covering ORB breaks, VWAP reclaims, RVOL spikes, momentum breakouts, chart patterns, and reversal setups gives you instant access to proven strategies without requiring coding knowledge.
Consider what you're actually screening for. Are you looking for premarket scanner results to identify gappers before the open? Do you need intraday momentum plays that show relative volume spikes combined with price action? Are you hunting for swing trade setups like ascending triangles or cup-and-handle patterns forming on daily charts? Your stock screening app should cover the specific technical setups that match your trading style, not force you to adapt your strategy to the platform's limitations.
Real-time scanning is the foundation, but it's only valuable if the platform is actually monitoring the setups you care about. Look for platforms that offer comprehensive coverage across technical indicators, chart patterns, and multi-timeframe analysis.
2. Backtested Strategy Data: Separating Signal from Noise
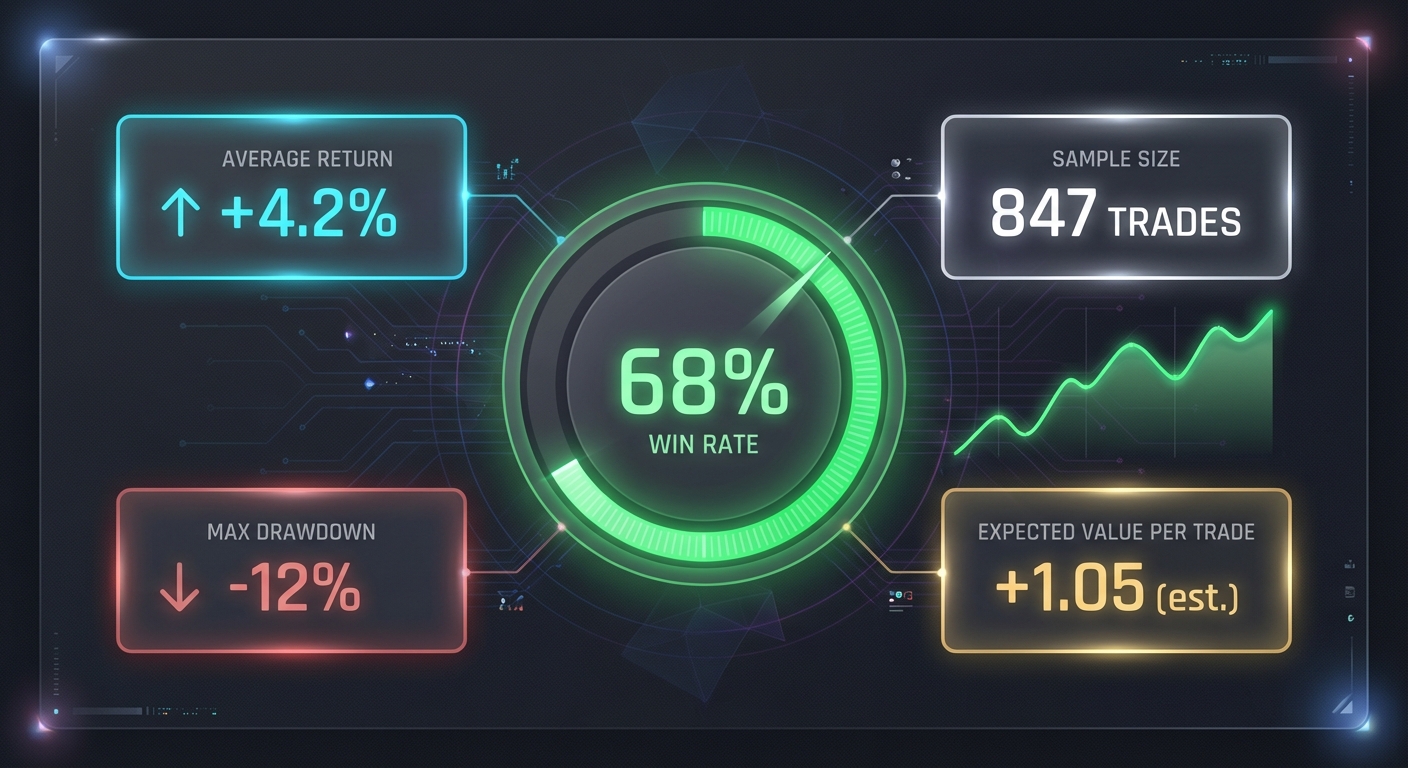
Here's a question most screeners can't answer: Does this setup actually work? You get an alert that a stock just crossed above VWAP with increasing volume. Great. But what's the historical win rate of that pattern? What's the average return per trade? How many times has this setup occurred in the past, and what's the expected value?
Backtested strategy data is what separates professional-grade screening platforms from glorified stock filters. Before you risk real capital on a setup, you should know whether it has a statistical edge. The best stock screening app platforms provide transparent backtest results for every screen, showing you exactly how the strategy has performed historically.
Key metrics to look for include:
- Win rate: What percentage of trades were profitable? A 60% win rate means 6 out of 10 trades hit their target.
- Average return per trade: What's the expected profit or loss per trade, accounting for both winners and losers?
- Sample size: How many historical occurrences were tested? A backtest with 500+ samples is far more reliable than one with 20.
- Maximum drawdown: What's the worst losing streak the strategy experienced? This helps you understand risk.
- Expected value (EV): The mathematical edge of the strategy, calculated as (win rate × avg win) - (loss rate × avg loss).
Platforms that show this data build confidence. You're not blindly following alerts; you're executing strategies with proven historical performance. This is especially valuable for technical trading beginners who are still learning which setups actually have edge.
Beware of black-box AI scoring systems that assign confidence scores without explaining the methodology. Some platforms use proprietary algorithms to rate setups, but if you can't see the actual filters, the backtest parameters, or the historical data, you're trusting a system you don't understand. Transparency matters. You should be able to see exactly what conditions triggered the alert and how that pattern has performed in the past.
Compare platforms side-by-side. Does the screener show you the actual backtest stats, or does it just say "high probability setup" without data to back it up? The difference is credibility. When you're building a backtesting strategy, you need platforms that respect the importance of historical validation, not marketing hype.
3. Mobile Accessibility: Trading Opportunities Don't Wait for Your Desktop
Let's be honest: you're not sitting at your trading desk for 6.5 hours straight every day. You have meetings, errands, a life outside of trading. But the market doesn't pause when you step away from your monitors. This is why mobile accessibility has become a critical feature in any modern stock screening app.
The rise of mobile-first trading platforms reflects a fundamental shift in how traders operate. Instead of being chained to a desktop, traders now expect to discover, validate, and track setups from their phones. The best mobile screening apps don't just shrink a desktop interface onto a smaller screen; they reimagine the entire user experience for on-the-go discovery.
Push notifications vs. email alerts is a perfect example. Email alerts arrive in your inbox alongside newsletters, spam, and meeting invites. By the time you see the alert, the setup might be gone. Push notifications, on the other hand, appear instantly on your lock screen with the urgency they deserve. For day traders monitoring ORB breaks or RVOL spikes, seconds matter. Mobile apps with intelligent push alerts ensure you never miss a high-probability setup, even when you're away from your desk.
But not all mobile interfaces are created equal. Some platforms simply cram a spreadsheet-style screener onto a phone, forcing you to scroll through tiny rows of data. Others embrace modern UX design with swipe interfaces that feel intuitive and fast. Imagine scrolling through trading setups the same way you scroll through social media: swipe up to see the next ranked opportunity, tap to dive deeper into the chart and backtest data, swipe left to dismiss setups that don't fit your criteria. This TikTok-style discovery experience is far more efficient than navigating cluttered dashboards on a 6-inch screen.
It's also important to understand that mobile screening apps should complement, not replace, your existing charting platform. You're not executing trades from a screener; you're using it to discover opportunities, then validating and executing them on TradingView, ThinkorSwim, or your broker's platform. The mobile app's job is to surface the right setups at the right time, so you can focus your limited screen time on the stocks that actually matter.
For swing traders with only 30 minutes per day to prepare for the next session, mobile accessibility is a game-changer. You can review end-of-day setups during your commute, set alerts for your watchlist, and get notified when your favorite stocks trigger technical patterns. The stock screening app becomes a companion tool that fits into your life, not a desktop application that demands you sit in front of it all day.
4. Alert Quality and Intelligent Filtering: Avoiding Notification Overload
Here's the paradox of modern screening tools: the more alerts you receive, the less valuable they become. If your phone buzzes 50 times a day with every minor VWAP cross and volume tick, you'll start ignoring them all. This is alert fatigue, and it's one of the biggest complaints traders have about traditional screeners.
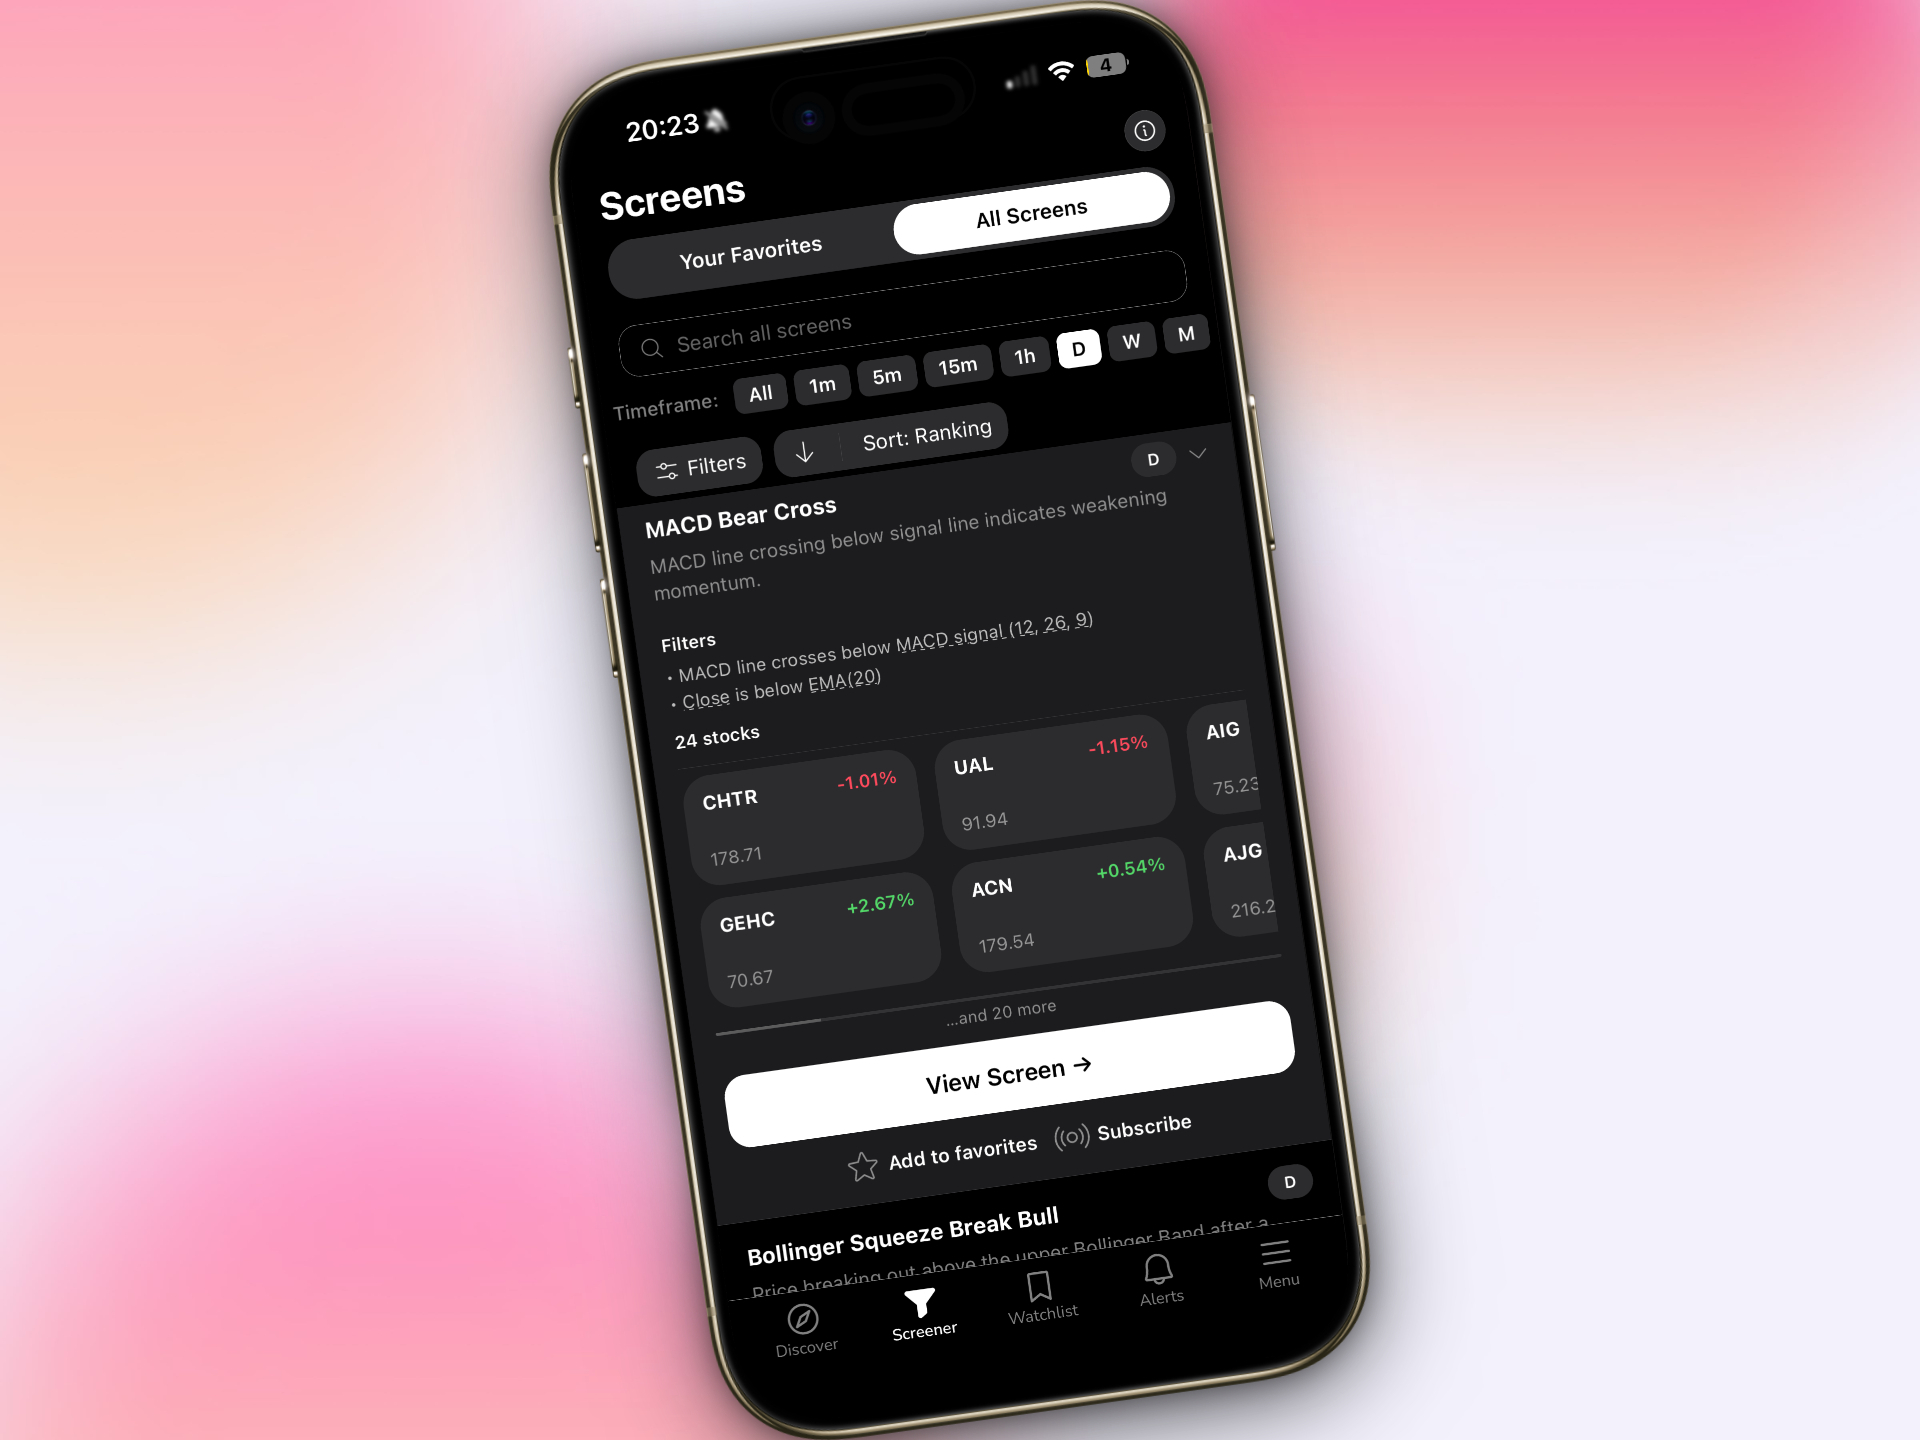
The solution isn't fewer alerts; it's smarter alerts. The best stock screening app platforms use intelligent filtering to surface only the highest-quality setups, ranked by probability and freshness. Instead of blasting you with every stock that meets basic criteria, they prioritize setups with strong historical performance, multi-timeframe confluence, and favorable risk-reward ratios.
Quality ranking systems work by scoring each setup based on multiple factors. For example, a VWAP reclaim with increasing relative volume, bullish price action, and a 65% historical win rate would rank higher than a simple VWAP cross with no volume confirmation. The platform does the filtering for you, so you only see setups worth your attention.
But even high-quality alerts are useless if you don't understand why they triggered. This is where plain-English explanations become essential. Instead of just saying "AAPL triggered ORB screen," the alert should explain: "AAPL broke above the opening range high of $185.50 with 2.3x average volume on the 5-minute chart. This setup has a 62% win rate with an average return of 1.8% based on 487 historical occurrences."
That context transforms an alert from a notification into an actionable trading opportunity. You understand the setup, the edge, and the historical performance. You can make an informed decision about whether to take the trade, rather than blindly following a signal you don't understand.
Another critical feature is custom watchlist alerts. You might have 20 favorite stocks you monitor closely. Instead of scanning the entire market, you want to know the moment one of your watchlist stocks triggers a technical setup. The best platforms let you create custom alerts for specific tickers, so you get notified when TSLA forms an ascending triangle or when NVDA reclaims VWAP with volume. This targeted approach reduces noise and keeps you focused on the stocks you actually trade.
Finally, right-time alerts matter. A swing trader doesn't need intraday 1-minute alerts; they need end-of-day signals for daily and weekly setups. A scalper doesn't care about monthly chart patterns; they need real-time notifications for 5-minute momentum plays. Your stock screening app should let you customize alert preferences based on your trading style and timeframe, so you only receive notifications that match your strategy.
When evaluating platforms, ask yourself: will these alerts help me find better trades, or will they just add to the noise? Quality over quantity is the mantra of intelligent screening in 2026.
5. Technical Setup Coverage: From ORB to VWAP to Momentum Breakouts
A stock screening app is only as good as the setups it can identify. If you're a technical trader, you need a platform that covers the full spectrum of patterns and indicators you actually use. Let's break down the essential technical setups every serious screening platform should monitor.
Opening Range Breakouts (ORB) are a staple for day traders. The first 5, 15, or 30 minutes of the trading session establish a range, and when price breaks above or below that range with volume, it often signals the start of a directional move. Your screener should identify ORB breaks in real-time across multiple timeframes, alerting you the moment a stock clears the opening range high or low. This is especially valuable during the first hour of trading when momentum is strongest.
VWAP (Volume-Weighted Average Price) is one of the most reliable intraday indicators. Institutional traders use VWAP as a benchmark, and price action around this level often creates tradable setups. Look for screeners that identify VWAP reclaims (price crossing above VWAP with volume), VWAP rejections (price failing to hold above VWAP), and VWAP holds (price consolidating above VWAP before continuation). These setups work across 5-minute, 15-minute, and hourly charts, making them versatile for both scalpers and intraday swing traders. For a deeper dive into this indicator, check out our guide on VWAP trading strategies.
Relative Volume (RVOL) spikes are critical for momentum trading. When a stock is trading at 2x, 3x, or 5x its average volume, it signals unusual activity that often precedes big moves. Your screener should flag RVOL spikes in real-time, especially when combined with price action like breakouts or gap-ups. This is how you catch stocks before they make explosive moves, not after they've already run 20%.
Chart patterns remain foundational to technical analysis. Ascending triangles, bull flags, cup-and-handle formations, double bottoms, and head-and-shoulders patterns all offer high-probability trade setups when identified correctly. The challenge is that manually scanning hundreds of charts for these patterns is time-consuming. A quality stock screening app automates this process, identifying pattern formations across daily and weekly timeframes so you can focus on validation and execution.
Momentum breakouts combine multiple factors: price breaking above resistance, volume increasing above average, and often a catalyst like earnings or news. Screeners should identify these multi-factor setups automatically, ranking them by strength and historical performance. This is where breakout trading becomes systematic rather than discretionary.
The advantage of pre-built screens cannot be overstated. Platforms that require you to code your own alerts using Pine Script or custom syntax create a massive barrier to entry. Most traders don't want to spend hours learning a programming language; they want to start finding trades immediately. Pre-built screens for ORB, VWAP, RVOL, chart patterns, and momentum setups give you instant access to proven strategies without writing a single line of code.
When comparing platforms, count how many technical setups they cover out of the box. A screener with 10 basic filters will force you to build everything manually. A platform with 200+ curated screens gives you comprehensive coverage across every major technical setup, timeframe, and trading style. For more on which setups work best, explore our comparison of VWAP vs RVOL vs ORB indicators.
6. Ease of Use: No Coding Required
Let's address the elephant in the room: Pine Script and custom coding create unnecessary barriers for most traders. Yes, advanced users love the flexibility of building custom indicators and alerts from scratch. But the vast majority of technical traders just want to find high-probability setups without learning a programming language.
This is where the value of curated, pre-built screens becomes clear. Instead of spending hours writing code to identify an ascending triangle or a VWAP reclaim with volume confirmation, you simply select the screen from a library and start receiving alerts. The platform has already done the work of defining the filters, backtesting the strategy, and optimizing the parameters. You get to focus on what matters: analyzing the setups and executing trades.
User interface design plays a huge role in ease of use. Compare a traditional screener with a spreadsheet-style interface (rows of tickers, columns of data, endless scrolling) to a modern TikTok-style discovery feed. The latter presents one setup at a time, ranked by quality, with all the relevant information (chart, backtest data, plain-English explanation) in a single view. You swipe up to see the next opportunity, swipe left to dismiss setups that don't fit your criteria. It's faster, more intuitive, and far less overwhelming than staring at a table of 200 stocks.
For technical trading beginners, the educational value of a well-designed stock screening app is immense. Instead of just showing you that a stock triggered a setup, the platform explains why the setup matters, what the historical performance looks like, and how to interpret the signal. This turns the screener into a learning tool, helping you understand technical analysis through real-world examples rather than abstract theory.
Onboarding experience matters too. Does the platform throw you into a complex interface with no guidance, or does it walk you through the key features, help you set up your first watchlist, and explain how to customize alerts? The best stock screening app platforms are designed for traders of all experience levels, from beginners learning the basics to veterans who want instant access to advanced setups.
Bottom line: if you're spending more time configuring your screener than actually trading, something is wrong. Look for platforms that prioritize simplicity, clarity, and speed. The goal is to find trades, not to become a software engineer.
7. Integration with Your Trading Workflow
A stock screening app doesn't exist in isolation. It's one piece of your overall trading stack, and it needs to integrate seamlessly with the other tools you use daily. Understanding how screening fits into your workflow is critical to maximizing efficiency and avoiding redundant steps.
Most technical traders use a charting platform like TradingView, ThinkorSwim, or their broker's proprietary software for detailed analysis and execution. The screener's job is not to replace these tools but to complement them. Think of it as a discovery engine: the screener surfaces high-probability setups, you validate them on your charting platform, and you execute the trade through your broker. This three-step workflow (discovery → validation → execution) is how modern traders operate efficiently.
The key is eliminating wasted time. Without a quality screener, you might spend 30-60 minutes every morning manually scanning watchlists, checking for breakouts, and validating setups across multiple timeframes. A good stock screening app automates the discovery phase, delivering ranked opportunities directly to your phone or desktop. You skip the manual scanning and jump straight to validation, saving hours every week.
For swing traders and busy professionals, this workflow optimization is essential. If you only have 30 minutes per day to prepare for the next session, you can't afford to waste time on low-probability setups or manual chart scanning. The screener does the heavy lifting, and you focus your limited time on the stocks that actually matter. Our guide on swing trading for busy professionals dives deeper into building efficient routines.
Integration also means alert delivery that fits your workflow. If you're a day trader actively monitoring the market, you want real-time push notifications on your phone. If you're a swing trader who checks setups once per day, you want a daily digest of end-of-day signals. The platform should adapt to your schedule, not force you to adapt to its limitations.
Another consideration is watchlist syncing. If you maintain a list of 50 favorite stocks, you don't want to manually recreate that list in every tool you use. Look for platforms that let you import watchlists or easily add tickers, so you can track the same stocks across your screener, charting platform, and broker.
Finally, think about how the screener fits into your trading routine. Do you check it before the market opens to identify premarket gappers? Do you monitor it throughout the day for intraday setups? Do you review it after the close for swing trade opportunities? The best platforms support all of these workflows, giving you flexibility to use the tool however it best serves your strategy. For more on building efficient systems, see our article on building an efficient trading workflow.
Comparing Popular Stock Screening Apps in 2026
The market for stock screening tools is crowded, and each platform takes a different approach. Let's compare some of the most popular options to help you understand the landscape.
Desktop-heavy platforms like Trade Ideas and TC2000 are powerful but expensive and designed for professional day traders who sit at their desks all day. Trade Ideas starts at $118/month and offers AI-driven scanning with real-time alerts, but it's desktop-only with no mobile app. TC2000 ranges from $25-100/month and includes integrated charting and brokerage, but it also lacks a true mobile-first experience. These platforms are feature-rich but not ideal for traders who need on-the-go access or who are just getting started.
Charting platforms with screening like TradingView and TrendSpider offer scanning as a secondary feature. TradingView is primarily a charting tool where you need to write Pine Script to build custom alerts. It's incredibly flexible for advanced users, but there's no library of pre-built screens with backtested performance data. TrendSpider automates chart analysis with multi-timeframe overlays and pattern recognition, but it's not a screener in the traditional sense; you can't say "show me all stocks in ascending triangles right now" and get a ranked list.
Free but limited options like Finviz and StockCharts are popular starting points, but they come with significant drawbacks. Finviz offers free stock screening with end-of-day data and fundamental filters, but it lacks real-time scanning, push alerts, and backtested performance metrics. StockCharts is known for its educational resources (ChartSchool is excellent), but the scanning is DIY with no backtested data to validate strategies. These platforms are fine for casual research but fall short for active technical traders who need real-time, mobile-first tools.
Mobile-first alternatives represent a new category of screening platforms designed for the modern trader. Instead of shrinking a desktop interface onto a phone, these platforms reimagine the entire experience around mobile discovery, intelligent filtering, and transparent backtest data. This is where platforms like ChartMath differentiate themselves: 200+ pre-built screens, real-time scanning, backtested win rates and average returns for every strategy, TikTok-style swipe interface, and push alerts with plain-English explanations. The focus is on accessibility, transparency, and workflow efficiency.
When comparing platforms, consider price vs. value. A $100/month desktop screener might offer more raw features, but if you're never at your desk, those features are wasted. A mobile-first platform with a free tier and a $20-40/month premium option might deliver more practical value for your specific trading style. The question isn't "which platform has the most features?" but rather "which platform helps me find better trades more efficiently?"
Feature comparison checklist:
- Real-time scanning vs. end-of-day data
- Backtested performance metrics vs. no historical data
- Mobile app with push alerts vs. desktop-only or email alerts
- Pre-built screens vs. DIY coding required
- Free tier or trial vs. paid-only
- Multi-timeframe coverage (1m to monthly) vs. limited timeframes
- Plain-English explanations vs. raw data only
The right choice depends on your trading style, budget, and workflow preferences. But in 2026, the trend is clear: traders are moving toward mobile-first, data-driven platforms that prioritize quality over complexity.
How ChartMath Solves the Stock Screening App Challenge
ChartMath was built to address the exact pain points we've discussed throughout this guide. Instead of forcing traders to choose between desktop power and mobile accessibility, or between comprehensive coverage and ease of use, ChartMath delivers a platform that excels at all of them.
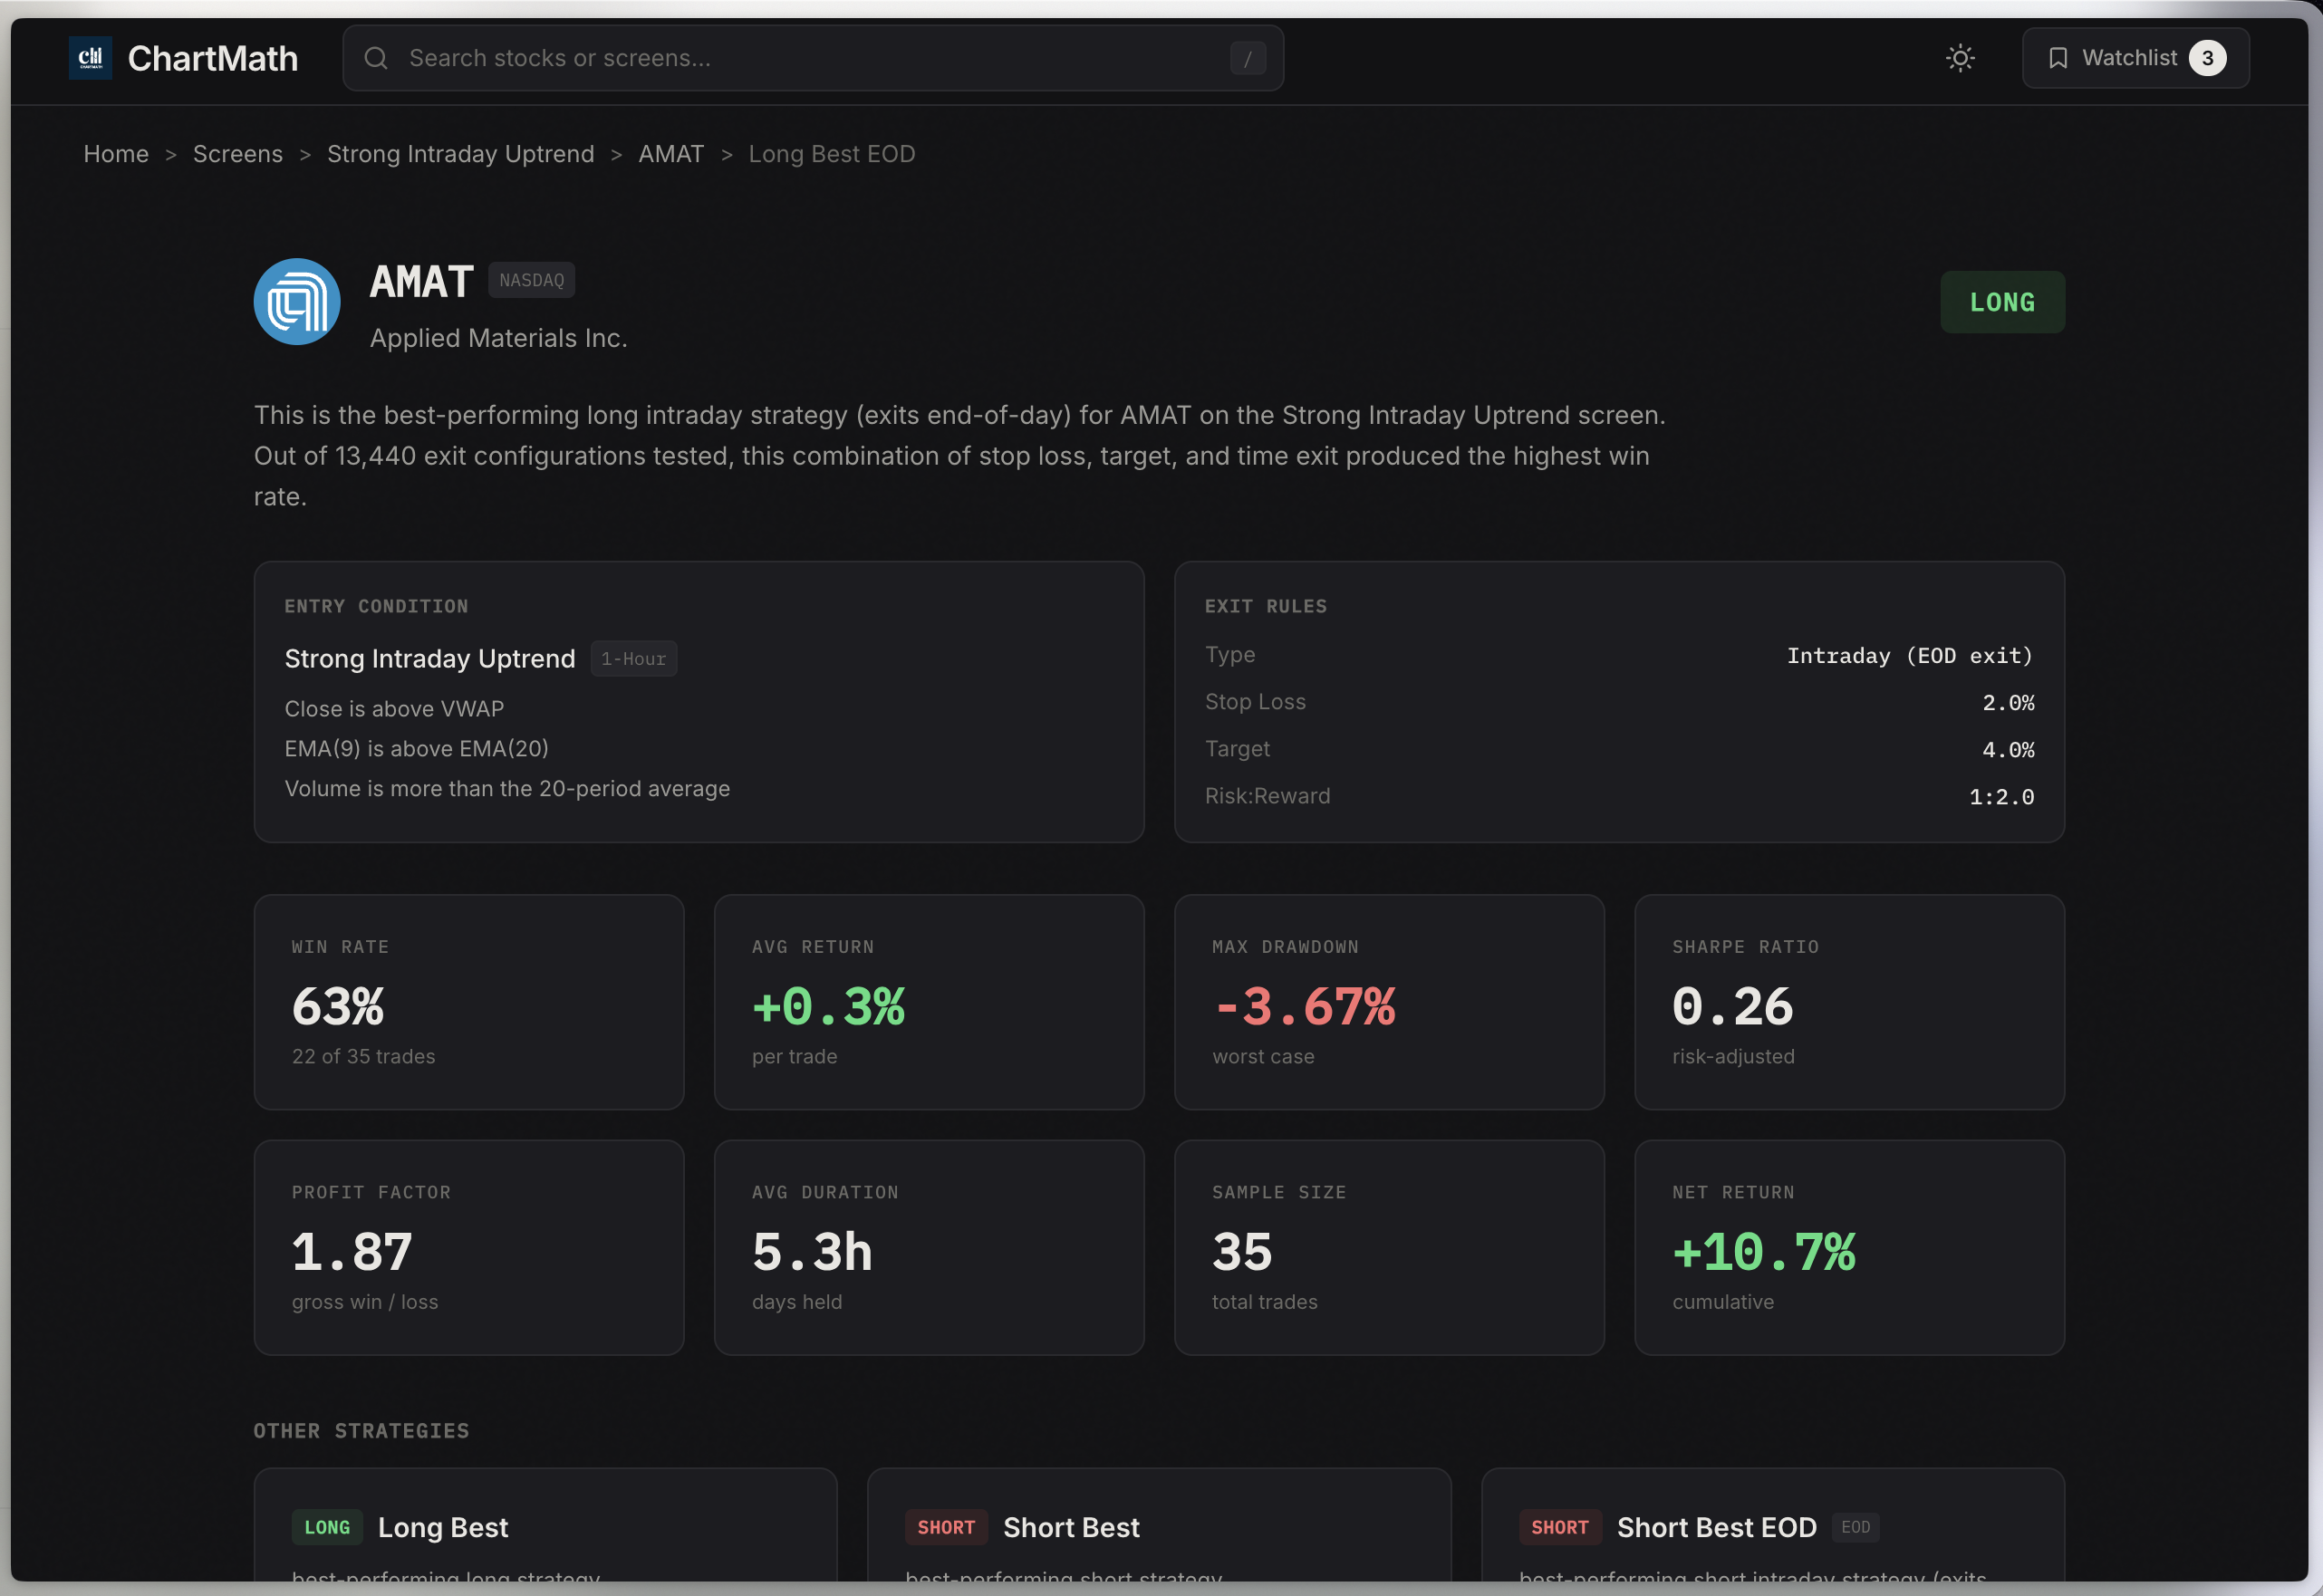
The platform offers 200+ pre-built technical screens covering every major setup: ORB breaks, VWAP reclaims, RVOL spikes, momentum breakouts, chart patterns, and reversal signals. Each screen comes with backtested performance data showing historical win rate, average return per trade, sample size, and expected value. You're not blindly following alerts; you're executing strategies with proven statistical edge.
The TikTok-style swipe interface reimagines how traders discover opportunities. Instead of scrolling through spreadsheets, you swipe through ranked setups, one at a time, with all the relevant information in a single view: the chart, the backtest stats, the plain-English explanation of why the alert triggered, and the timeframe. It's fast, intuitive, and designed for mobile-first discovery.
Real-time push alerts ensure you never miss a high-probability setup, even when you're away from your desk. The alerts include context: "TSLA broke above the opening range high of $245.80 with 3.1x average volume on the 5-minute chart. This setup has a 64% win rate with an average return of 2.1% based on 523 historical occurrences." You understand the setup, the edge, and the historical performance before you even open your charting platform.
ChartMath is designed to complement your existing charting tools, not replace them. You use ChartMath to discover setups, then validate and execute them on TradingView, ThinkorSwim, or your broker's platform. This workflow integration saves time and eliminates the need to manually scan hundreds of charts every day.
The platform offers multi-timeframe coverage from 1-minute charts to monthly charts, so whether you're a scalper, day trader, or swing trader, you can find setups that match your style. Custom watchlist alerts let you track your favorite stocks and get notified the moment they trigger technical patterns.
Perhaps most importantly, ChartMath offers a free tier, making it accessible to traders at every experience level. You can start discovering setups immediately without committing to a subscription, and upgrade when you're ready for advanced features. This removes the barrier to entry that plagues many professional-grade screening platforms.
Ready to see how ChartMath can transform your trade discovery process? Watch a demo to see the platform in action, or download the app and start discovering high-probability setups today. You can also access the web-based screener to explore the full library of 200+ technical screens with backtested performance data.
Making Your Final Decision: A Stock Screening App Checklist
Choosing the right stock screening app is a decision that will impact your trading for years to come. Before you commit to a platform, ask yourself these critical questions:
Does the platform offer a free trial or free tier? You should be able to test the screener with real market data before paying. Free trials let you evaluate the interface, alert quality, and feature set without financial commitment. Platforms that don't offer trials are often hiding limitations.
How good is the mobile app? If you're not at your desk all day, mobile accessibility is essential. Test the push notification reliability, the interface design, and the speed of the app. Does it feel like a mobile-first experience, or is it just a clunky port of a desktop interface?
Is the backtest methodology transparent? Can you see the actual filters, the historical data, and the performance metrics for each screen? Or does the platform use black-box AI scoring without explaining how it works? Transparency builds trust and helps you understand which setups actually have edge.
What kind of customer support and educational resources are available? When you have questions about a setup or need help configuring alerts, can you get answers quickly? Look for platforms with responsive support teams, comprehensive documentation, and educational content that helps you improve as a trader.
What's the pricing structure, and does it offer value for money? Compare the cost to the features you're actually getting. A $100/month desktop screener might be overkill if you only trade a few times per week. A $20-40/month mobile-first platform with backtested screens and real-time alerts might deliver better ROI for your specific needs.
Does it cover the technical setups you actually trade? If you're a VWAP trader, the platform should have multiple VWAP screens across different timeframes. If you trade chart patterns, it should identify triangles, flags, and cup-and-handle formations automatically. Make sure the screener aligns with your strategy, not the other way around.
How does it fit into your existing workflow? Will the screener integrate smoothly with your charting platform and broker, or will it create friction and redundant steps? The best tools enhance your workflow, not complicate it.
Use this checklist as a framework for evaluating platforms. The right stock screening app should feel like a natural extension of your trading process, surfacing high-probability setups efficiently so you can focus on what matters: making informed trading decisions and managing risk.
The stock screening landscape has evolved dramatically in 2026, and the platforms that prioritize mobile accessibility, transparent backtest data, and intelligent filtering are winning. Whether you're a day trader executing intraday plays or a swing trader preparing for the next session, the right screening tool can be the difference between catching opportunities and watching them slip away. Choose wisely, test thoroughly, and remember: the best stock screening app is the one that helps you find better trades, faster, without overwhelming you with noise.
Take the first step toward smarter trade discovery. Download ChartMath and start exploring 200+ backtested technical screens designed for active traders who refuse to miss high-probability setups. Your next winning trade is waiting to be discovered.
Ankush Jindal
Co-Founder, ChartMath
Ankush Jindal is the Co-Founder of ChartMath, a real-time trade discovery platform that monitors 200+ technical screens across the market to surface actionable setups for technical traders. He holds a B.Tech in Computer Science from IIT Mandi. Before ChartMath, he co-founded two successful technology ventures spanning hundreds of thousands of users. This experience building data-intensive, real-time systems directly shaped his approach to technical analysis tooling. At ChartMath, Ankush leads product vision, designing intuitive interfaces that translate complex price action into clear, backtested signals. His philosophy: trading decisions should be backed by data, not gut feeling.
LinkedInSee these setups live in ChartMath
200+ curated screens with backtest data. Free to use.
Related Articles
How to Use an RSI Divergence Screener to Find Reversals
Learn how to use an RSI divergence screener to automatically identify bullish and bearish divergence patterns that signal high-probability trend reversals.
Premarket Trading: 7 Strategies to Find High-Probability Setups
Master premarket trading with proven strategies using RVOL, gap scanners, and momentum signals. Learn to identify high-probability setups before the bell.
Volume Analysis for Day Traders: How to Use RVOL and Volume Spikes
Master volume analysis with RVOL and volume spikes to predict price moves. Learn how day traders use volume indicators to confirm breakouts in 2026.