How to Use an RSI Divergence Screener to Find Reversals
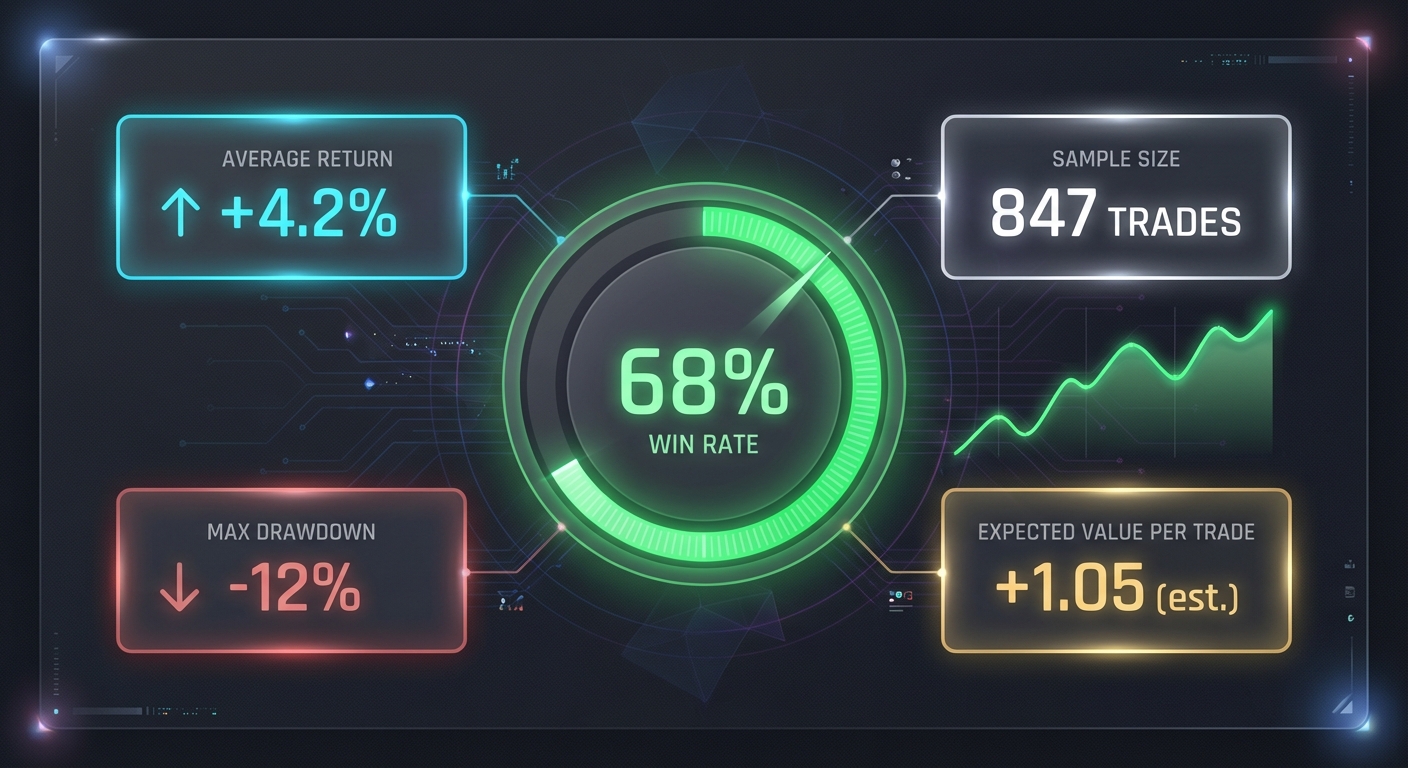
Table of Contents
You've been staring at charts for hours, manually drawing trendlines on price action and RSI indicators, trying to spot that perfect divergence setup before everyone else sees it. By the time you find one promising candidate, the market has already moved. Sound familiar?
An RSI divergence screener automates this entire process, scanning hundreds or thousands of stocks simultaneously to identify bullish and bearish divergence patterns the moment they form. Instead of spending your evening analyzing charts one by one, you get instant alerts when high-probability reversal setups appear, complete with backtest data showing you exactly how these patterns have performed historically.
In this guide, you'll learn how to set up and use an RSI divergence screener to catch trend reversals before they happen, interpret backtest metrics to validate your setups, and combine divergence signals with other technical indicators for higher win rates. Whether you're a day trader looking for intraday reversals or a swing trader hunting multi-day position entries, the right screening approach can transform how you discover trading opportunities.
What Is RSI Divergence and Why Does It Matter?
The Relative Strength Index (RSI) is a momentum oscillator that measures the speed and magnitude of price movements on a scale from 0 to 100. Developed by J. Welles Wilder in 1978, RSI helps traders identify overbought conditions (typically above 70) and oversold conditions (typically below 30).
But the real power of RSI isn't just in these threshold levels. It's in divergence patterns that reveal when momentum is shifting before price action confirms the reversal.
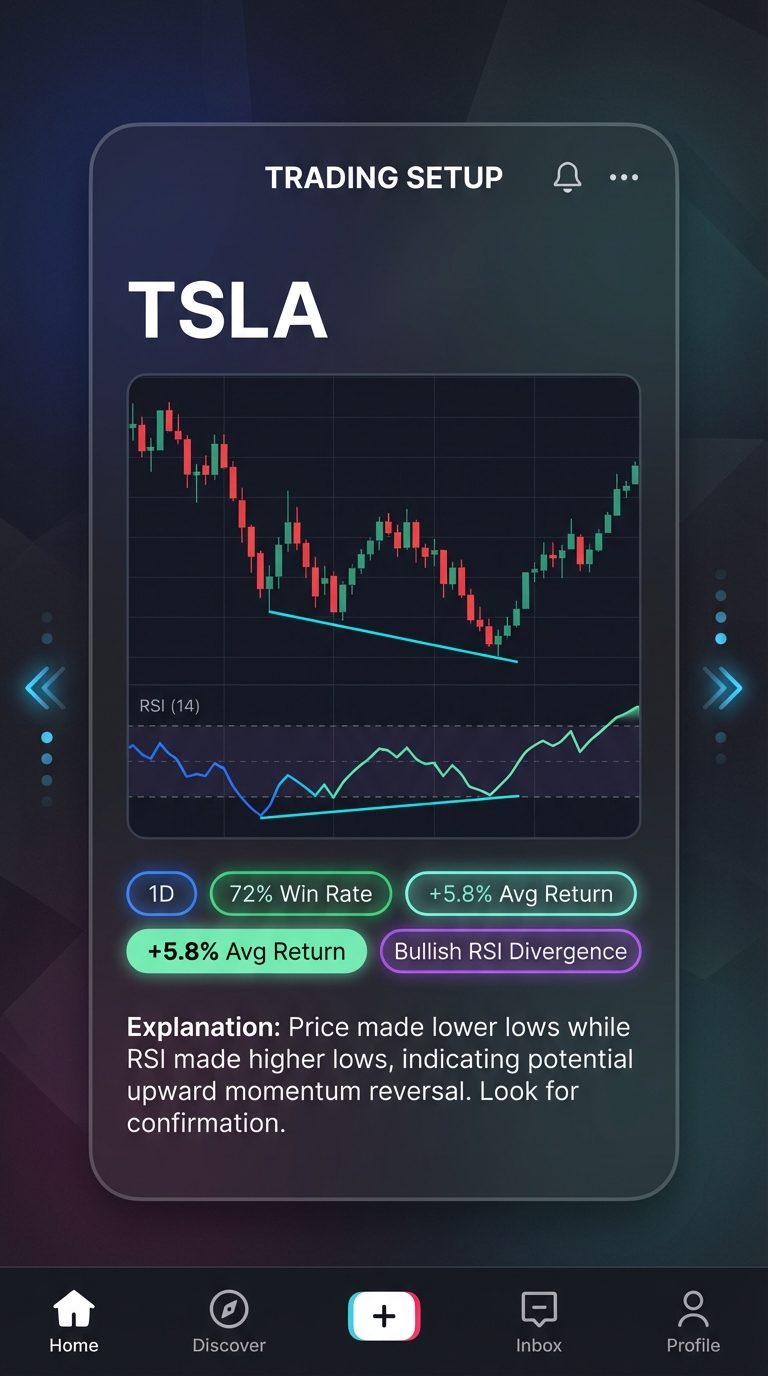
Bullish divergence occurs when price makes lower lows while RSI makes higher lows. This pattern suggests that selling pressure is weakening even though price continues to decline. The momentum indicator is telling you that the downtrend is losing steam, often preceding a reversal to the upside.
Bearish divergence happens when price makes higher highs while RSI makes lower highs. Despite price pushing to new peaks, the momentum behind those moves is deteriorating. This warns that the uptrend may be exhausted and vulnerable to a reversal.
Why does divergence matter so much? Because it identifies potential trend reversals before they're obvious on the price chart. By the time a reversal is clear to everyone watching, the best entry opportunity has already passed. Divergence gives you an edge by spotting momentum shifts early.
The challenge? Manually scanning for divergence across hundreds of stocks and multiple timeframes is incredibly time-consuming. You'd need to open each chart, draw trendlines on both price and RSI, compare the slopes, and verify the pattern meets your criteria. For active traders monitoring dozens of potential setups, this approach simply doesn't scale.
That's exactly where an RSI divergence screener becomes essential. It automates the pattern recognition process, continuously monitoring the entire market and alerting you only when valid divergence setups appear. Instead of hunting for needles in a haystack, the screener delivers the needles directly to you.
1. Choose the Right RSI Divergence Screener for Your Trading Style
Not all screeners are created equal. The right tool depends on your trading approach, technical skill level, and how much time you can dedicate to market analysis.
When evaluating an RSI divergence screener, look for these essential features:
- Real-time scanning capabilities: For day traders, delayed data means missed opportunities. Your screener should identify divergence patterns as they form, not 15 minutes after the fact.
- Multi-timeframe support: Divergence on a 5-minute chart has different implications than divergence on a daily chart. Your screener should let you filter by timeframe to match your trading horizon.
- Backtest data integration: This is critical. Knowing that a divergence pattern appeared is useful. Knowing that this specific pattern has a 68% win rate with an average return of 4.2% over 847 historical occurrences? That's actionable intelligence.
- Pre-built screens vs custom coding: Some platforms require you to write Pine Script or other code to create divergence scans. Others provide ready-to-use screens. If you're not a programmer, pre-built options save enormous time.
- Mobile accessibility: Can you receive alerts and review setups from your phone? For traders who can't sit at a desktop all day, mobile access is non-negotiable.
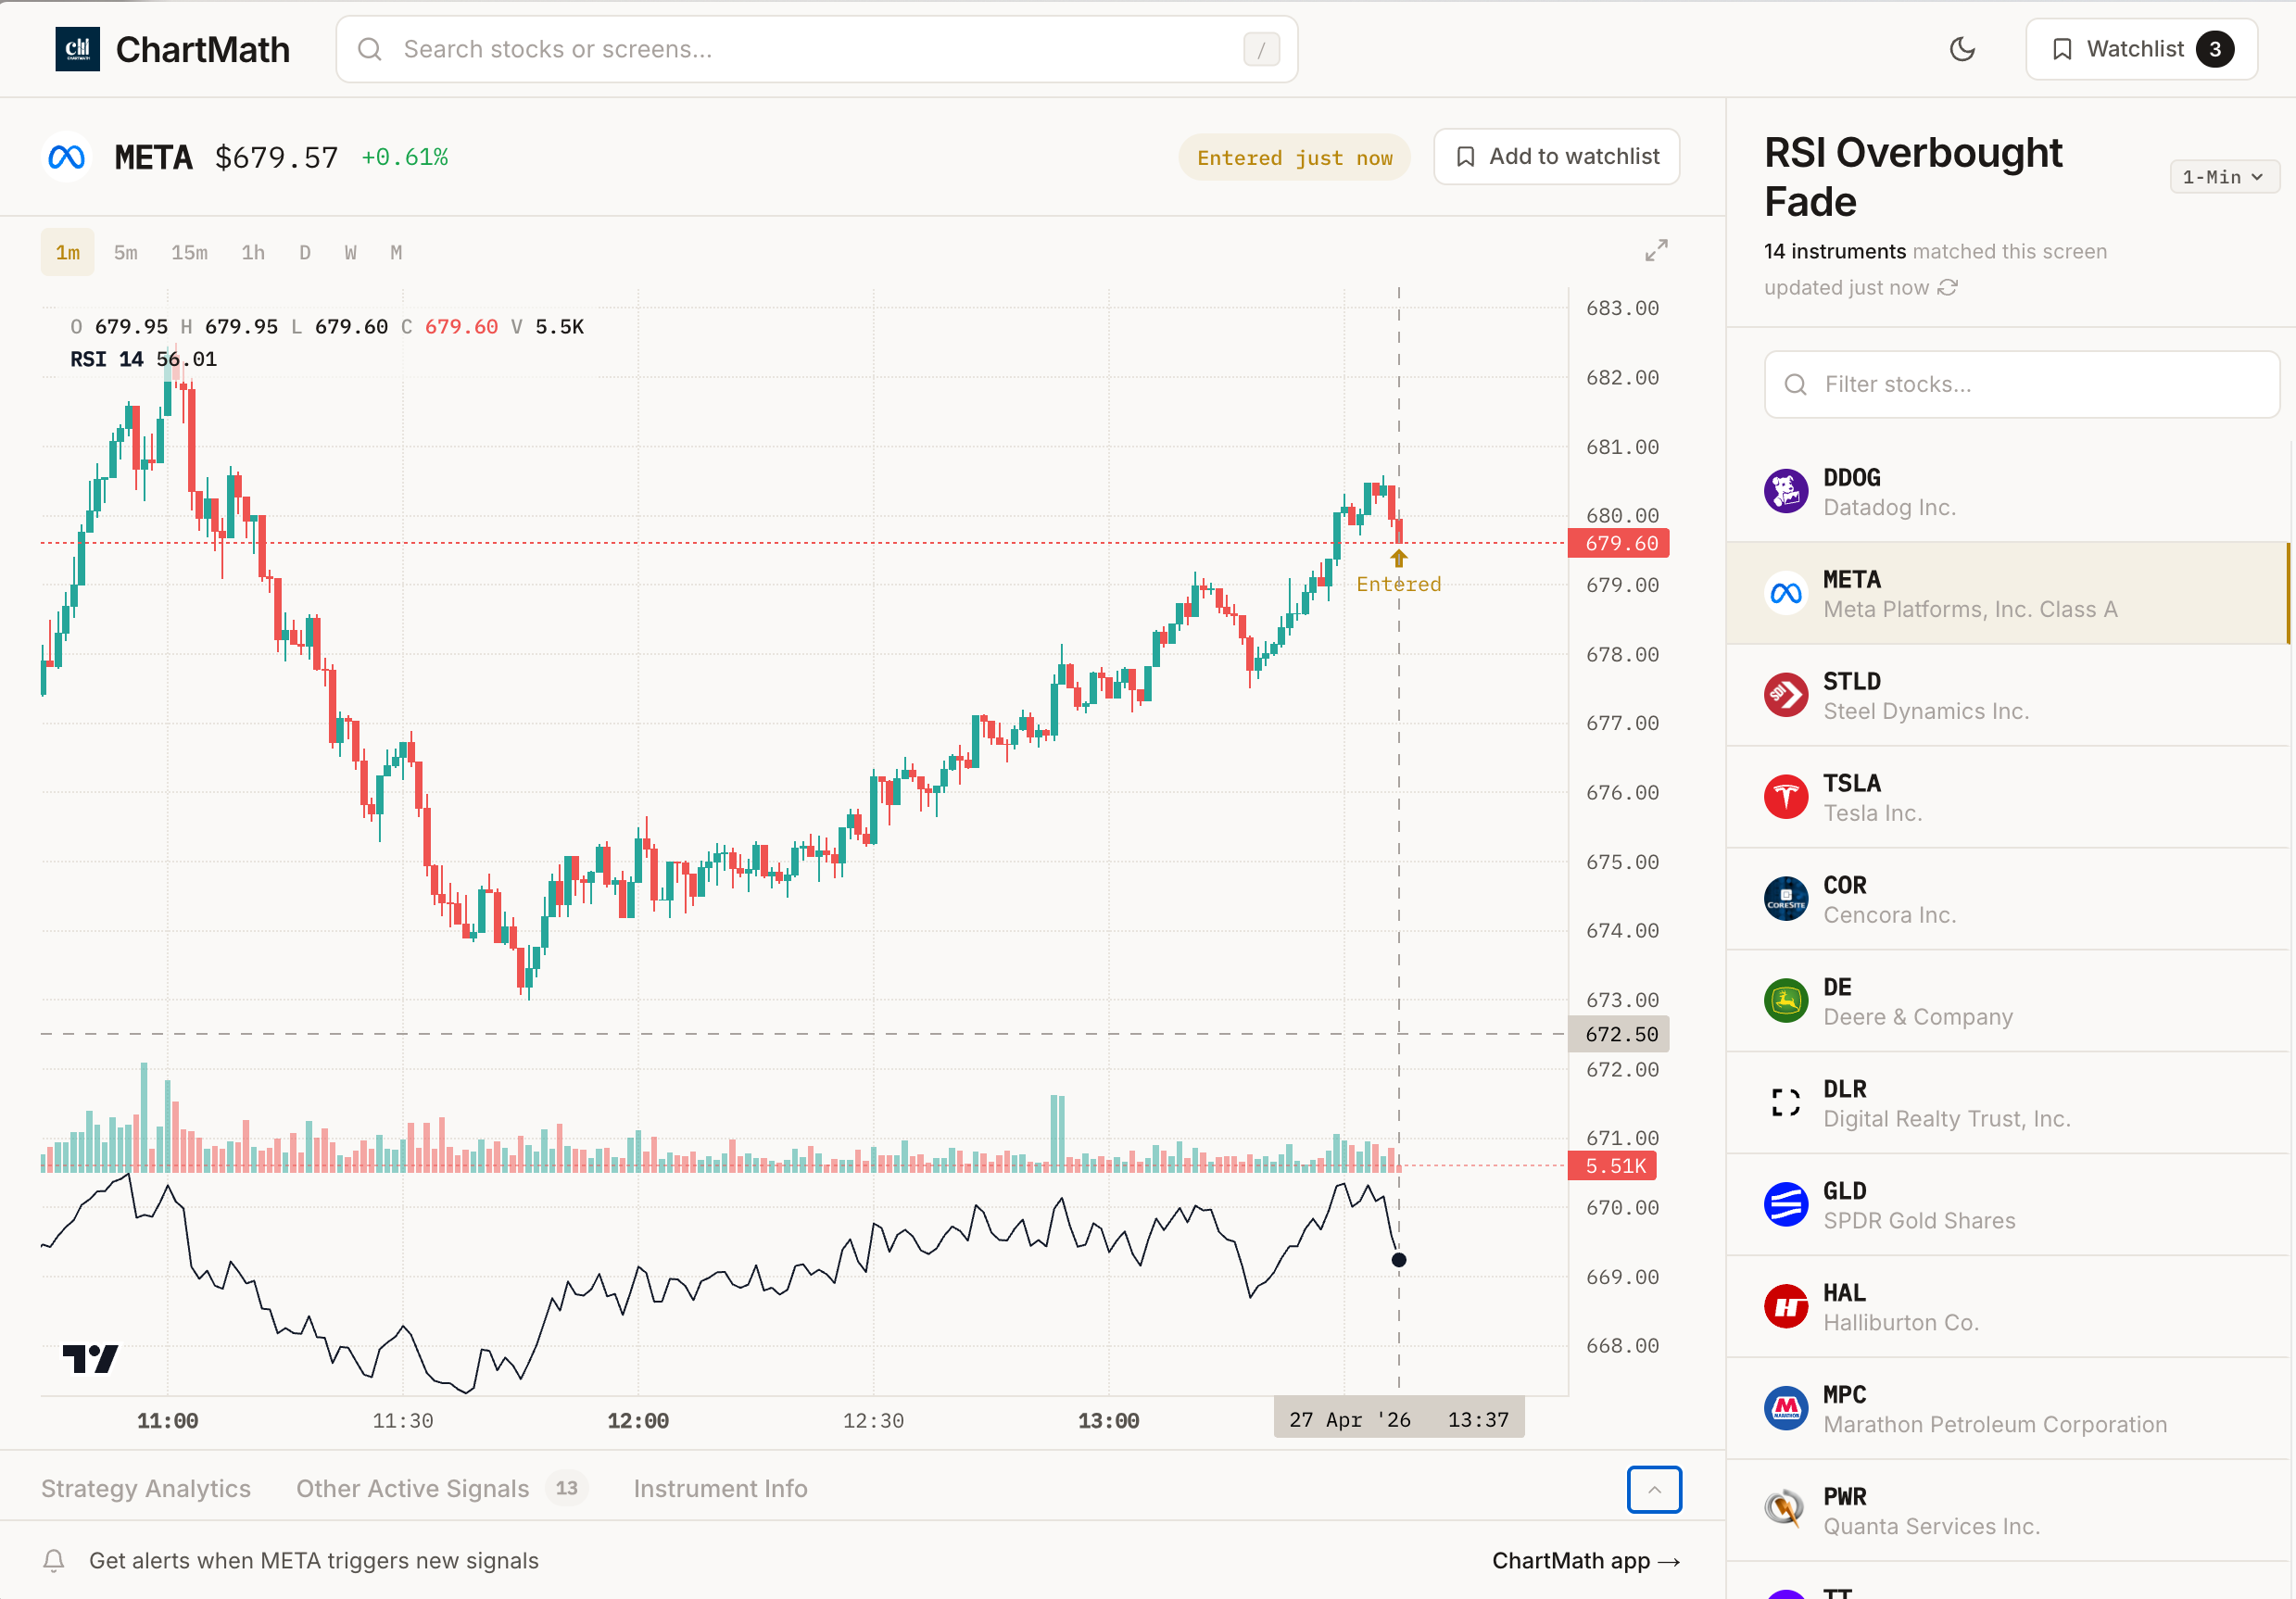
ChartMath addresses all these requirements with 200+ pre-built technical screens, including RSI divergence patterns across multiple timeframes. Every screen comes with historical backtest data showing win rates, average returns, and sample sizes. The mobile-first interface delivers real-time alerts with plain-English explanations of why each setup triggered, no coding knowledge required.
The platform scans the market continuously and presents opportunities through a swipe-based discover feed, ranked by quality and freshness. This means you're not just getting alerts; you're getting prioritized alerts based on which setups have the strongest historical performance and most recent formation.
For traders just starting with stock screeners for day trading, the learning curve matters. A screener that requires weeks of setup and configuration will sit unused. Look for tools that deliver value immediately while allowing you to customize as you gain experience.
2. Set Up Your RSI Divergence Screener Parameters
Once you've chosen your screening platform, proper configuration determines whether you get high-quality signals or a flood of false positives that waste your time and capital.
RSI Period Settings
The standard RSI calculation uses a 14-period lookback, which works well across most timeframes. However, you can adjust this based on your trading style:
- Shorter periods (9-11): More sensitive, generating more signals but also more false positives. Useful for very short-term day trading.
- Standard period (14): The Goldilocks setting that balances sensitivity with reliability. Recommended for most traders.
- Longer periods (21-25): Less sensitive, fewer signals, but potentially more reliable. Better for swing trading and position trading.
Divergence Lookback Period
This parameter defines how many bars back the screener should look when comparing price swings to RSI swings. A lookback of 20-50 bars typically captures meaningful divergence patterns without going so far back that the signal becomes stale.
For day trading on 5-minute charts, a 20-30 bar lookback covers about 2-3 hours of price action. For swing trading on daily charts, a 30-50 bar lookback covers roughly 6-10 weeks, which aligns well with typical swing trade holding periods.
Overbought and Oversold Thresholds
Traditional RSI thresholds are 70 (overbought) and 30 (oversold). For divergence screening, these levels help filter for setups where momentum extremes are reversing:
- 70/30 thresholds: Standard settings that work in most market conditions
- 80/20 thresholds: More extreme levels that reduce signal frequency but may identify stronger reversals
- 60/40 thresholds: More permissive settings that catch divergence earlier but with more false signals
Timeframe Selection
Your trading style dictates which timeframes matter most:
- 1-minute and 5-minute charts: For active day traders executing scalps and momentum plays throughout the session
- 15-minute and 1-hour charts: For swing traders looking for intraday entries on multi-day positions
- Daily and weekly charts: For position traders and swing traders with limited screen time
The beauty of a comprehensive RSI divergence screener is that you can run multiple scans simultaneously across different timeframes. ChartMath's multi-timeframe analysis lets you see when divergence appears on both the daily chart (for the broader setup) and the 15-minute chart (for precise entry timing).
Additional Filters to Reduce Noise
Raw divergence signals can generate too many alerts. Layer in these filters to focus on the highest-quality setups:
Minimum volume: Require average daily volume above 500K or 1M shares to ensure liquidity
Price range: Filter for stocks above $5 or $10 to avoid low-quality penny stocks
Relative volume (RVOL): Require current volume to be 1.5x or 2x the average, indicating institutional interest
Market cap: Focus on small-cap, mid-cap, or large-cap stocks based on your risk tolerance
These additional criteria ensure your screener surfaces divergence patterns on liquid, actively traded stocks where your orders can be filled efficiently.
3. Configure Real-Time Alerts to Catch Divergence as It Forms
A screener is only valuable if you actually see the signals when they matter. Real-time alerts bridge the gap between pattern detection and trading execution.
The key challenge is balancing responsiveness with alert fatigue. Too many notifications and you'll start ignoring them. Too few and you'll miss opportunities. Here's how to find the right balance:
Alert Delivery Methods
- Push notifications: Instant delivery to your phone, ideal for time-sensitive day trading setups
- Email alerts: Better for swing traders who check opportunities once or twice daily
- SMS alerts: For critical setups only, when you absolutely can't miss the signal
ChartMath delivers right-time alerts via push notification with plain-English explanations of why each signal triggered. Instead of a cryptic "AAPL RSI DIV" notification, you get context: "AAPL showing bullish RSI divergence on the daily chart. Historical win rate: 72%. Price making lower lows while RSI making higher lows, suggesting weakening downside momentum."
This context helps you make faster decisions without opening multiple charts to verify the setup.
Alert Frequency Settings
Configure how often you want to be notified about the same stock:
- Once per setup: Get alerted when divergence first forms, then no more alerts for that stock until a new pattern appears
- Daily digest: Receive a summary of all divergence setups at a specific time (e.g., 9:00 AM before market open or 4:30 PM after close)
- Continuous: Get alerted every time the pattern strengthens or additional confirmation appears
For most traders, the "once per setup" approach prevents notification overload while ensuring you don't miss new opportunities.
Watchlist-Specific Alerts
If you already track a core group of stocks, configure your RSI divergence screener to prioritize alerts on your watchlist. This creates a two-tier system:
- Tier 1: Immediate push notifications when divergence appears on your watchlist stocks
- Tier 2: Daily digest of divergence setups on the broader market
This approach ensures you never miss setups on stocks you're already familiar with, while still discovering new opportunities across the market. ChartMath's custom watchlist tracking makes this configuration straightforward, letting you create multiple watchlists for different strategies or sectors.
The goal is to integrate alerts into your existing trading workflow rather than creating a separate process you need to remember to check.
4. Interpret Backtest Data to Validate RSI Divergence Setups
Here's where most traders make a critical mistake: they see a divergence pattern, recognize it from a trading book or YouTube video, and immediately take the trade. But not all divergence setups are created equal.
Backtest data transforms divergence from a subjective pattern into a quantifiable edge. Instead of hoping the pattern works, you know exactly how it has performed historically under similar conditions.
Key Backtest Metrics That Matter
When evaluating an RSI divergence setup, focus on these performance indicators:
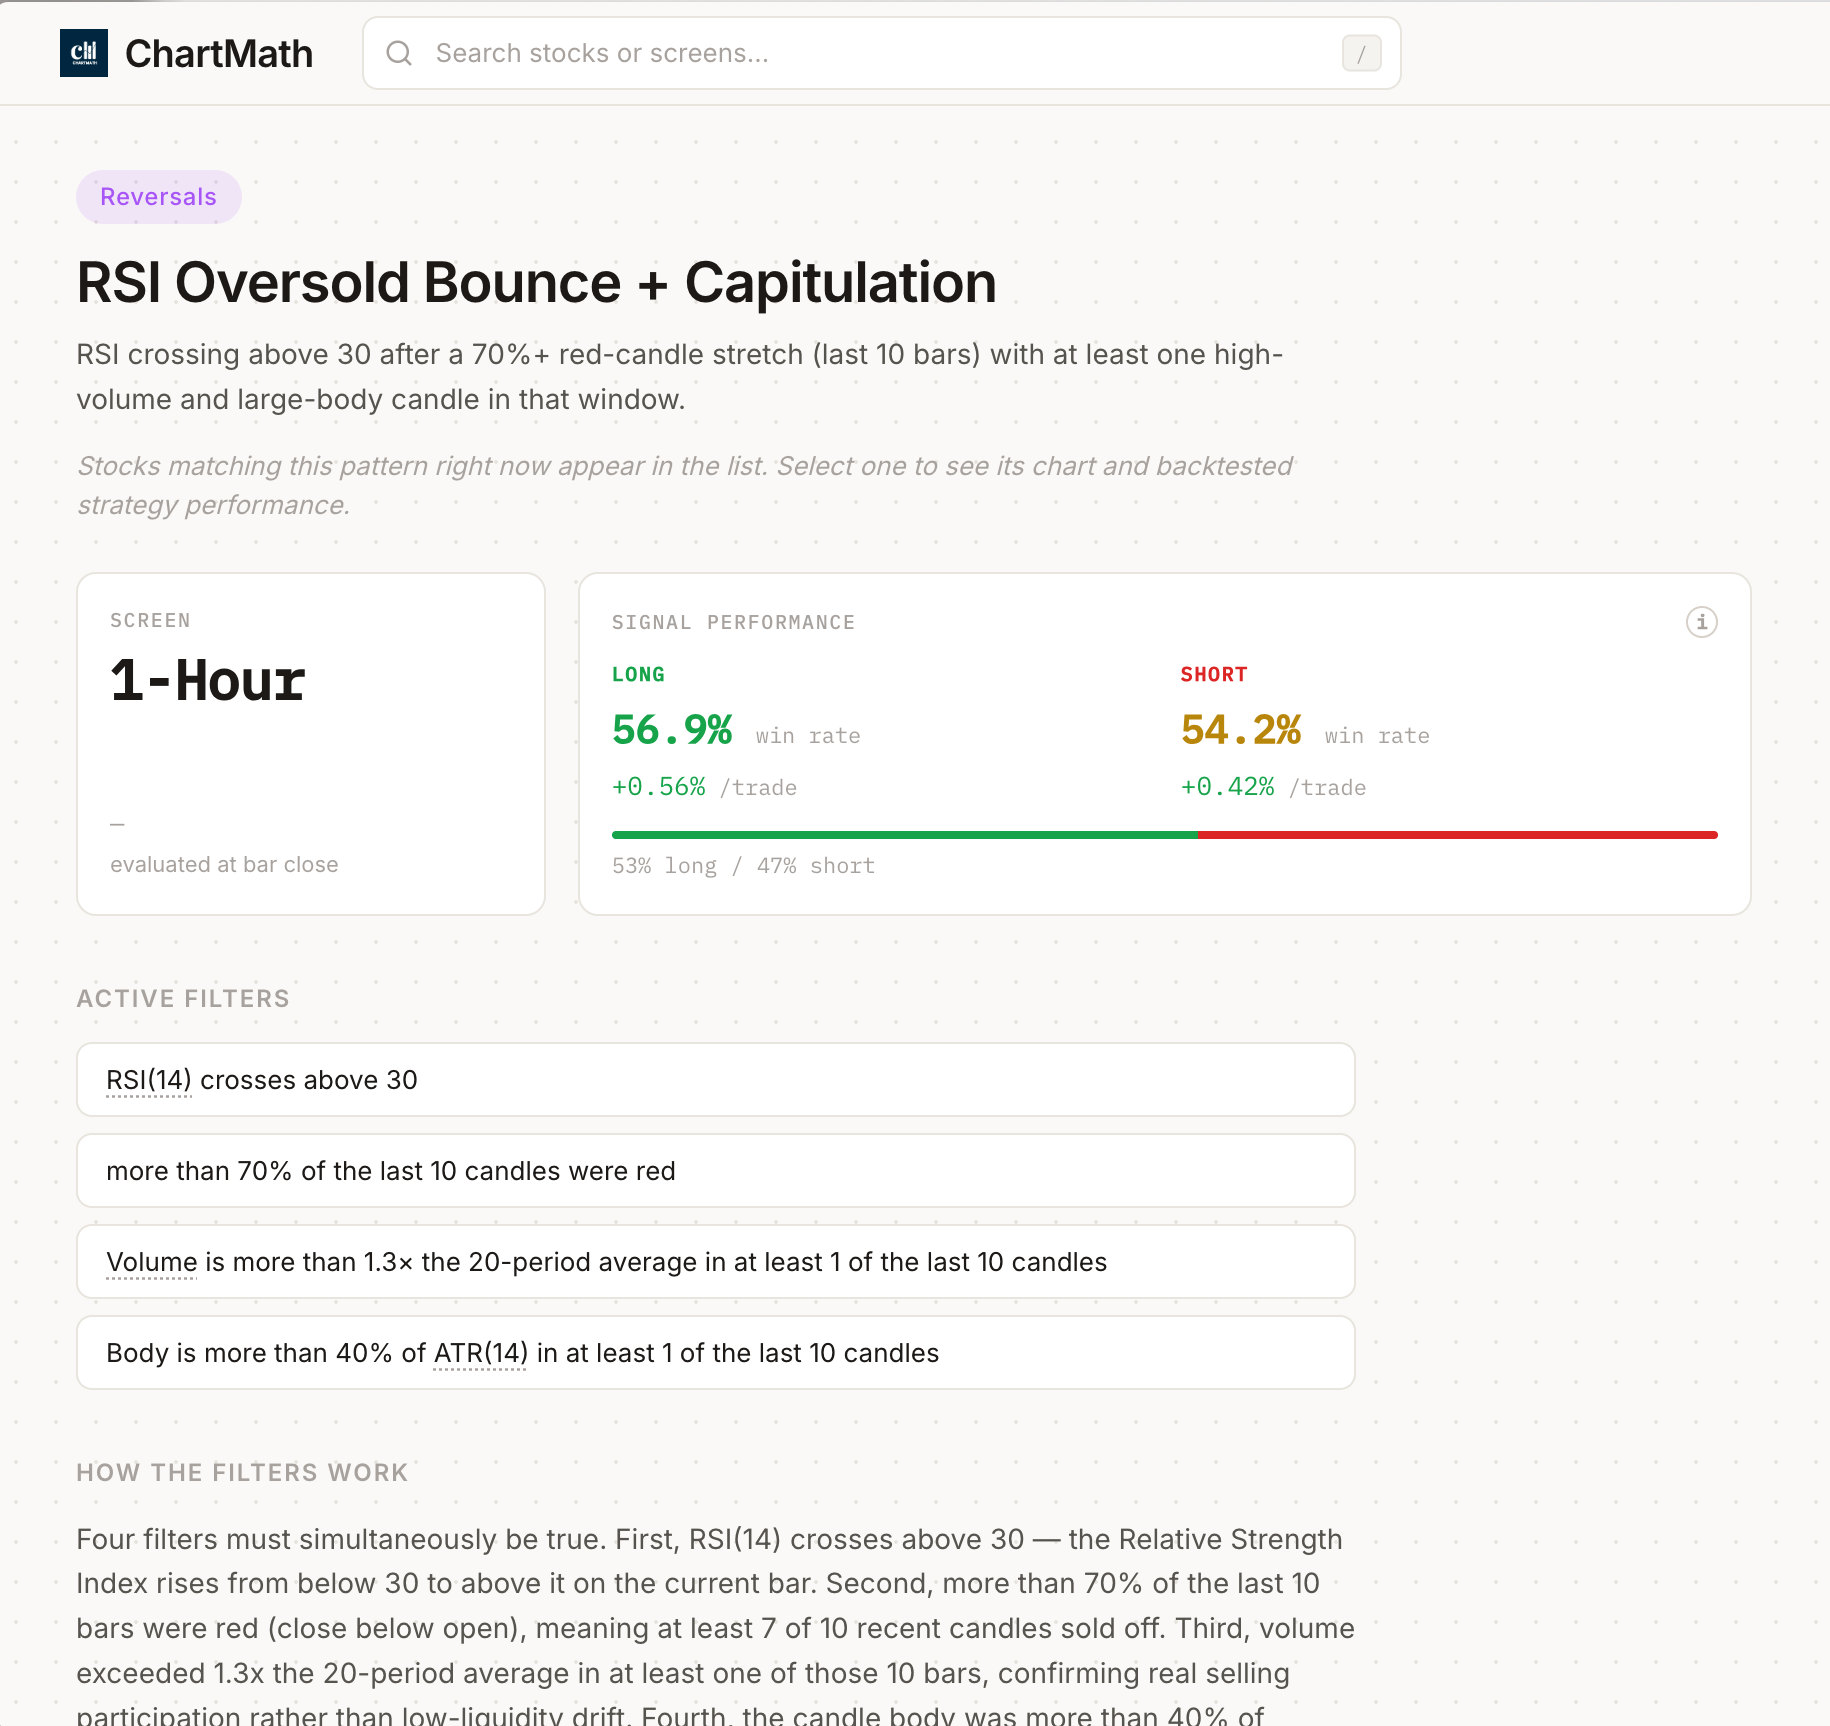
Win Rate: The percentage of historical trades that closed profitably. A 60% win rate means 6 out of 10 trades were winners. For divergence patterns, win rates between 55-70% are typical. Anything above 70% deserves scrutiny (might be overfitted or have insufficient sample size).
Average Return: The mean profit or loss per trade, usually expressed as a percentage. A pattern with a 65% win rate but only 1.2% average return might not be worth trading after commissions and slippage. Look for average returns of at least 3-5% for swing trades, 1-2% for day trades.
Sample Size: How many historical occurrences were tested. This is crucial. A pattern with a 90% win rate based on only 10 trades is statistically meaningless. You want sample sizes of at least 100 occurrences, preferably 200+, to have confidence in the data.
Maximum Drawdown: The largest peak-to-trough decline if you traded this pattern consistently. This tells you the worst-case scenario and helps with position sizing. A pattern with a 15% max drawdown requires different risk management than one with a 5% max drawdown.
Expected Value (EV) Per Trade: The average amount you can expect to make per trade over the long run, calculated as (Win Rate × Avg Win) - (Loss Rate × Avg Loss). Positive EV means the pattern has a statistical edge. The higher the EV, the better.
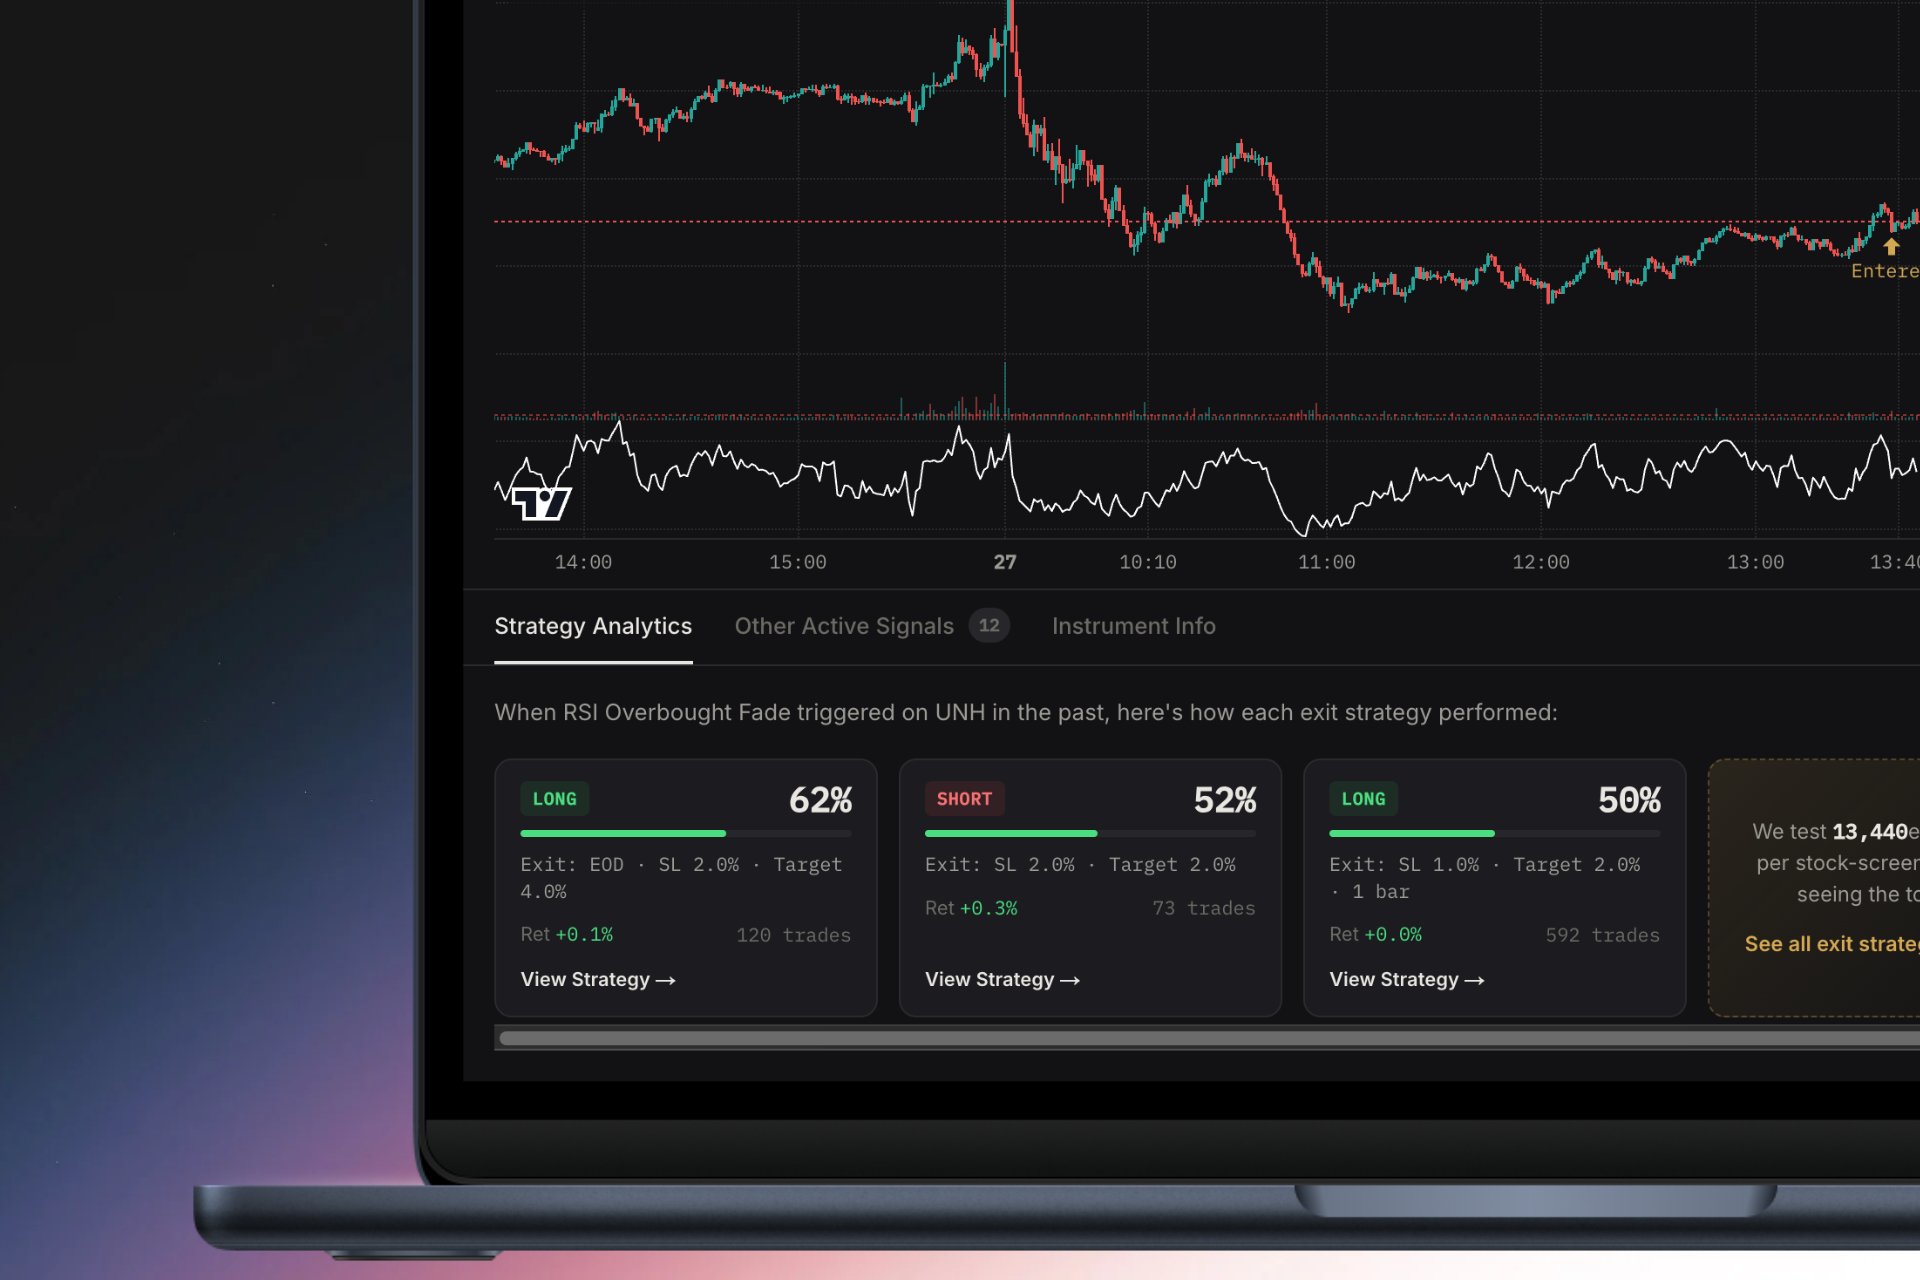
How ChartMath Presents Backtest Data
ChartMath shows these metrics for every technical setup, including RSI divergence patterns. When you receive an alert, you immediately see:
- Historical win rate for this specific pattern on this timeframe
- Average return based on different exit strategies (fixed %, trailing stop, time-based)
- Sample size so you know if the data is statistically significant
- Performance across different market conditions (bull markets, bear markets, high volatility, low volatility)
This transparency lets you make informed decisions. If you see a bullish RSI divergence setup with a 72% win rate, 5.8% average return, and 847 historical occurrences, you have objective evidence that this pattern has worked consistently in the past.
Compare that to a generic alert that just says "RSI divergence detected" with no context about whether this pattern actually makes money.
Understanding Context and Market Conditions
Backtest data becomes even more powerful when you can filter by market conditions. RSI divergence patterns may perform differently in trending vs. ranging markets, or during high volatility vs. low volatility periods.
Advanced screeners let you see how the pattern performed:
- During the last bull market vs. the last bear market
- When VIX was above 20 vs. below 20
- On stocks with high relative volume vs. average volume
- In different sectors (tech, healthcare, energy, etc.)
This granular analysis helps you understand when to trust the pattern and when to be more cautious. For a comprehensive guide on validating trading setups with data, check out our article on building winning backtesting strategies.
5. Combine RSI Divergence with Other Technical Indicators
While RSI divergence is powerful on its own, the highest-probability setups occur when multiple technical factors align. This concept, called confluence trading, dramatically improves your win rate by requiring several independent signals to confirm before you enter a trade.
RSI Divergence + VWAP Reclaim
The Volume Weighted Average Price (VWAP) acts as a dynamic support and resistance level. When you spot bullish RSI divergence and price reclaims VWAP from below, you have two independent signals suggesting upside momentum:
- RSI divergence indicates weakening selling pressure
- VWAP reclaim shows buyers stepping in at institutional average prices
This combination is particularly powerful for intraday reversals. ChartMath's screens can identify when both conditions occur simultaneously, filtering for only the highest-conviction setups. Learn more about how VWAP compares to other technical indicators.
RSI Divergence + Volume Spikes (RVOL)
Relative Volume (RVOL) measures current volume compared to the average. When RSI divergence appears alongside a volume spike (RVOL > 2.0), it suggests institutional money is entering the position, not just retail traders reacting to a chart pattern.
For example, a bullish divergence setup with RVOL of 3.5 means volume is 3.5 times the normal level. This unusual activity often precedes significant price moves, as institutions don't accumulate positions quietly for no reason.
RSI Divergence + Support/Resistance Levels
Divergence near key support or resistance levels carries more weight than divergence in the middle of nowhere. When you see:
- Bullish divergence at a major support level: The combination of technical support and weakening downside momentum creates a high-probability long entry
- Bearish divergence at a major resistance level: Price struggling at resistance while momentum deteriorates suggests a failed breakout and potential short opportunity
Your RSI divergence screener should let you layer in price-based filters to identify these confluence zones automatically.
RSI Divergence + Chart Patterns
Classic chart patterns like double bottoms, head and shoulders, or ascending triangles become even more reliable when confirmed by RSI divergence:
- Double bottom + bullish divergence: The second bottom shows weakening selling pressure, increasing the probability of a successful reversal
- Head and shoulders + bearish divergence: The right shoulder forms with deteriorating momentum, confirming the pattern's validity
ChartMath scans for both divergence patterns and chart patterns simultaneously, alerting you when multiple technical setups align on the same stock. This multi-factor approach is how professional traders achieve win rates above 65%.
Avoiding Over-Optimization
While confluence is powerful, requiring too many conditions can result in analysis paralysis and missed opportunities. A good rule of thumb:
- 2-3 confirming factors: Optimal balance between selectivity and opportunity frequency
- 4+ confirming factors: Too restrictive; you'll rarely find setups that meet all criteria
- 1 factor only: Too many false signals; win rate will suffer
Start with RSI divergence as your primary signal, then add one or two confirming factors based on your trading style and the current market environment.
6. Execute Your RSI Divergence Trading Strategy
Finding the setup is only half the battle. Proper execution determines whether your edge translates into actual profits.
Entry Timing: Confirmation vs. Early Entry
You have two main approaches when trading RSI divergence:
Wait for confirmation: Enter after price action confirms the reversal (e.g., a bullish engulfing candle, break above a short-term resistance level). This approach has a higher win rate but smaller profit potential since you're entering after the move has started.
Early entry: Enter as soon as divergence forms, before price confirms. This maximizes profit potential but increases the risk of false signals. Your win rate will be lower, but your average winner will be larger.
Most traders find success with a hybrid approach: enter a partial position when divergence forms, then add to the position if price confirms the reversal. This balances risk and reward while ensuring you don't miss the entire move waiting for perfect confirmation.
Stop-Loss Placement
For bullish divergence setups, place your stop-loss just below the most recent swing low (the lower low that created the divergence). For bearish divergence, place it just above the most recent swing high.
This placement makes logical sense: if price breaks through the level that created the divergence pattern, the setup is invalidated and you want to exit immediately.
Add a small buffer (0.5-1% beyond the swing point) to avoid getting stopped out by brief wicks or shakeouts before the reversal occurs.
Profit Targets and Risk-Reward Ratios
Use the backtest data from your RSI divergence screener to set realistic profit targets. If historical data shows the pattern averages a 5% move, don't set your target at 15% and wonder why you rarely hit it.
A common approach is to use risk-reward ratios:
- 1:2 ratio: If you're risking 2% to your stop-loss, target a 4% gain. Conservative but achievable.
- 1:3 ratio: Risk 2% to make 6%. More aggressive but still reasonable for strong divergence setups.
- Trailing stops: Once the trade moves in your favor by 1.5x your initial risk, move your stop to breakeven and let the trade run with a trailing stop.
Position Sizing Based on Backtest Data
Not all divergence setups deserve the same position size. Use the backtest metrics to scale your risk:
- High-conviction setups: Win rate above 65%, sample size above 200, multiple confirming factors → Risk 1-2% of your account
- Medium-conviction setups: Win rate 55-65%, decent sample size, one confirming factor → Risk 0.5-1% of your account
- Low-conviction setups: Win rate below 55% or small sample size → Skip or risk only 0.25% as a learning trade
This dynamic position sizing ensures you're betting more on your best setups and less on marginal opportunities.
Common Execution Mistakes to Avoid
- Chasing the signal: If you miss the initial alert and price has already moved 3-4%, wait for a pullback rather than chasing
- Ignoring broader market context: Even the best divergence setup can fail if the overall market is in a strong trend against your position
- Moving your stop-loss: If price approaches your stop, honor it. Moving stops to "give the trade more room" is how small losses become large losses
- Taking profits too early: If your backtest data shows an average 5% move, don't panic and exit at 2% just because the trade moved quickly
For more on integrating these setups into your broader trading approach, see our guide on integrating trading alerts with your charting platform.
Real-World Example: Scanning for Bullish RSI Divergence
Let's walk through a concrete example of how an RSI divergence screener works in practice.
It's 10:30 AM on a Tuesday. You're in a meeting, phone in your pocket. You feel a vibration—a push notification from ChartMath:
"XYZ Corp showing bullish RSI divergence on the 15-minute chart. Win rate: 68%. Avg return: +4.7%. Sample size: 523 trades. Price making lower lows while RSI making higher lows."
You open the app during a break. The swipe interface shows the setup card:
- Ticker: XYZ
- Pattern: Bullish RSI Divergence
- Timeframe: 15-minute
- Current price: $47.85
- Recent swing low: $47.20 (your stop-loss reference)
You review the backtest data displayed on the card:
- Win rate: 68%
- Average return: +4.7%
- Sample size: 523 historical occurrences
- Max drawdown: -8.2%
- Expected value: +2.8% per trade
You check for confluence factors. The app shows:
- RVOL: 2.3 (volume is 2.3x normal—institutional interest)
- Price just reclaimed VWAP at $47.75
- No major resistance until $50.50
This is a high-conviction setup: RSI divergence + VWAP reclaim + volume spike. Three independent confirming factors.
You decide to enter:
- Entry: $47.90 (current price)
- Stop-loss: $47.00 (below the swing low at $47.20, with a buffer)
- Risk per share: $0.90
- Target: $50.60 (based on 1:3 risk-reward ratio)
- Position size: 1% account risk = 111 shares (assuming $10,000 account)
You place the order from your phone. The entire process—from alert to execution—took 90 seconds.
By 2:00 PM, XYZ has moved to $50.20. You move your stop to breakeven. By 3:30 PM, it hits your target at $50.60. You exit with a $300 profit (2.7% return on the position, 1% account gain).
This is exactly how an RSI divergence screener is supposed to work: it finds the setup, provides the data to validate it, and delivers the alert at the right time for you to act. No hours of chart analysis. No missed opportunities because you were away from your desk.
Common Mistakes to Avoid with RSI Divergence Screeners
Even with the best screening tools, traders make predictable mistakes that undermine their results. Here's what to watch out for:
Trading Every Divergence Signal Without Context
Just because your screener identifies a divergence pattern doesn't mean you should trade it. Always check:
- Is the broader market trending strongly against this setup?
- Is there a major news event or earnings announcement coming that could override technical patterns?
- Does the backtest data support this specific variation of the pattern?
Selective trading based on context and confluence will always outperform mechanical trading of every signal.
Ignoring the Broader Trend
RSI divergence works best when it signals a reversal of an exhausted trend, not when it appears in the middle of a strong, healthy trend. Bearish divergence in a powerful bull market often results in brief consolidations rather than meaningful reversals. Bullish divergence in a strong downtrend may produce only temporary bounces.
Check the higher timeframe trend before trading divergence on lower timeframes. A bullish divergence on the 15-minute chart is more reliable if the daily chart shows an overall uptrend that's merely pulling back.
Using Divergence in Choppy, Sideways Markets
Divergence patterns are trend-reversal signals. In sideways, range-bound markets with no clear trend, divergence signals produce more false positives. The pattern works best when there's an established trend to reverse.
If your screener is generating lots of divergence signals but your win rate is suffering, check if the market has entered a low-volatility, choppy phase. During these periods, consider pausing divergence trading and focusing on range-bound strategies instead.
Not Validating with Backtest Data Before Trading
This bears repeating: never trade a pattern just because it looks good on a chart. Always check the historical performance data. A screener that doesn't provide backtest metrics is forcing you to trade blind.
ChartMath's approach of showing win rate, average return, and sample size for every alert ensures you're making data-driven decisions, not emotional ones.
Alert Fatigue from Too Many Notifications
If you're getting 50 divergence alerts per day, you'll start ignoring them. This defeats the entire purpose of automated screening. Fix this by:
- Tightening your filter criteria (higher volume requirements, specific price ranges, etc.)
- Focusing on specific watchlists rather than the entire market
- Using daily digest mode instead of real-time alerts if you're a swing trader
- Requiring confluence factors (divergence + VWAP + RVOL) to reduce signal frequency
Quality over quantity. Ten high-conviction alerts per week will serve you better than 100 mediocre ones per day.
Forgetting to Adjust Parameters for Different Market Volatility
The RSI parameters that work during low-volatility periods may generate too many false signals during high-volatility periods. When VIX spikes above 25-30, consider:
- Widening your RSI thresholds (85/15 instead of 70/30)
- Requiring larger divergence angles (more pronounced momentum shifts)
- Adding volume filters to ensure institutional participation
Adaptive screening, adjusting your parameters based on current market conditions, separates consistently profitable traders from those who struggle when market character changes.
Start Finding High-Probability Reversals Today
An RSI divergence screener transforms how you discover trading opportunities. Instead of manually analyzing hundreds of charts hoping to spot divergence patterns before they play out, you get instant alerts when high-probability setups form, complete with backtest data showing exactly how these patterns have performed historically.
The key is choosing a screener that provides real-time scanning, multi-timeframe analysis, and transparent backtest metrics. ChartMath delivers all three through a mobile-first platform designed for traders who need to catch opportunities without spending hours glued to screens.
With 200+ pre-built technical screens including RSI divergence patterns, you can start identifying reversal setups immediately. Every alert comes with historical win rates, average returns, and sample sizes, so you're trading with data-driven confidence rather than hope.
Ready to stop missing reversal trades and start catching them before the crowd? Watch a demo to see how ChartMath's RSI divergence screener works in real-time, or download the app to start receiving alerts on your phone today. You can also access the web-based screener to explore setups from your desktop.
The next high-probability RSI divergence setup is forming right now. The question is: will you find it manually in three hours, or will your screener alert you in three seconds?
Ankush Jindal
Co-Founder, ChartMath
Ankush Jindal is the Co-Founder of ChartMath, a real-time trade discovery platform that monitors 200+ technical screens across the market to surface actionable setups for technical traders. He holds a B.Tech in Computer Science from IIT Mandi. Before ChartMath, he co-founded two successful technology ventures spanning hundreds of thousands of users. This experience building data-intensive, real-time systems directly shaped his approach to technical analysis tooling. At ChartMath, Ankush leads product vision, designing intuitive interfaces that translate complex price action into clear, backtested signals. His philosophy: trading decisions should be backed by data, not gut feeling.
LinkedInSee these setups live in ChartMath
200+ curated screens with backtest data. Free to use.
Related Articles
How to Choose a Stock Screener with Backtest Data
Learn how to select the best stock screener with backtest capabilities. Discover essential features like win rates, EV metrics, and real-time alerts.

How to Choose the Best Stock Screening App in 2026
Learn how to choose the best stock screening app for technical trading. Compare real-time scanning, backtested strategies, mobile alerts, and more.
Premarket Trading: 7 Strategies to Find High-Probability Setups
Master premarket trading with proven strategies using RVOL, gap scanners, and momentum signals. Learn to identify high-probability setups before the bell.