Market Scanners for Day Trading: Ultimate 2026 Guide
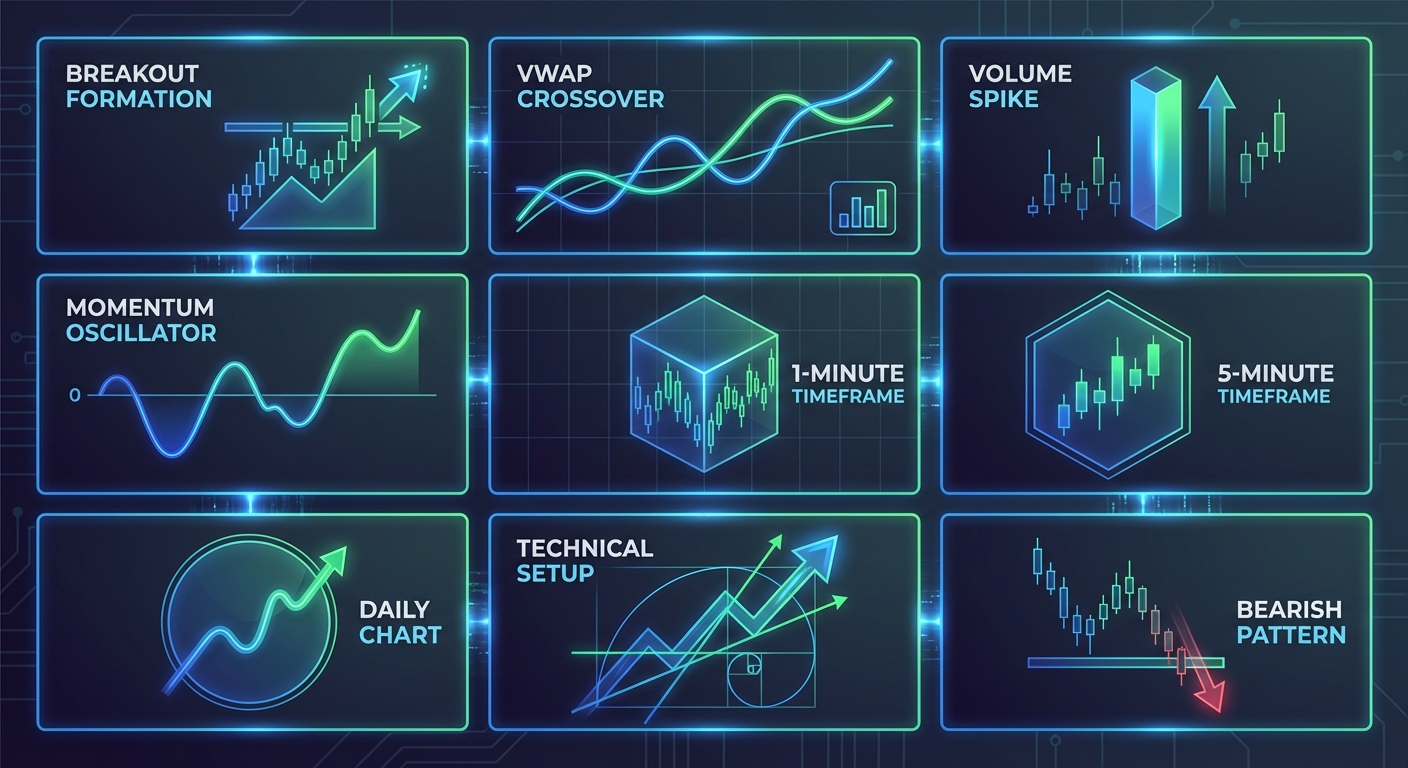
Table of Contents
You've been staring at charts for three hours, manually flipping through tickers, refreshing your screener every five minutes, and somehow you still missed that perfect VWAP reclaim on the stock you've been watching all week. Sound familiar? If you're a day trader in 2026, you already know the frustration: thousands of stocks are moving every second, and your human eyes can only track a handful at a time.
This is exactly why market scanners have become essential tools for modern day traders. These real-time scanning platforms continuously monitor the entire market, filtering through thousands of stocks to surface high-probability technical setups the moment they form. Instead of manually hunting for opportunities, market scanners bring validated trade ideas directly to you, complete with the data you need to make confident decisions.
In this comprehensive guide, we'll explore how market scanners work, which technical setups they should detect, how to evaluate backtest data, and how to choose the right scanning platform for your trading style. Whether you're executing rapid-fire scalps or building swing positions, understanding market scanners will transform how you discover and capture trading opportunities.
What Are Market Scanners and Why Day Traders Need Them
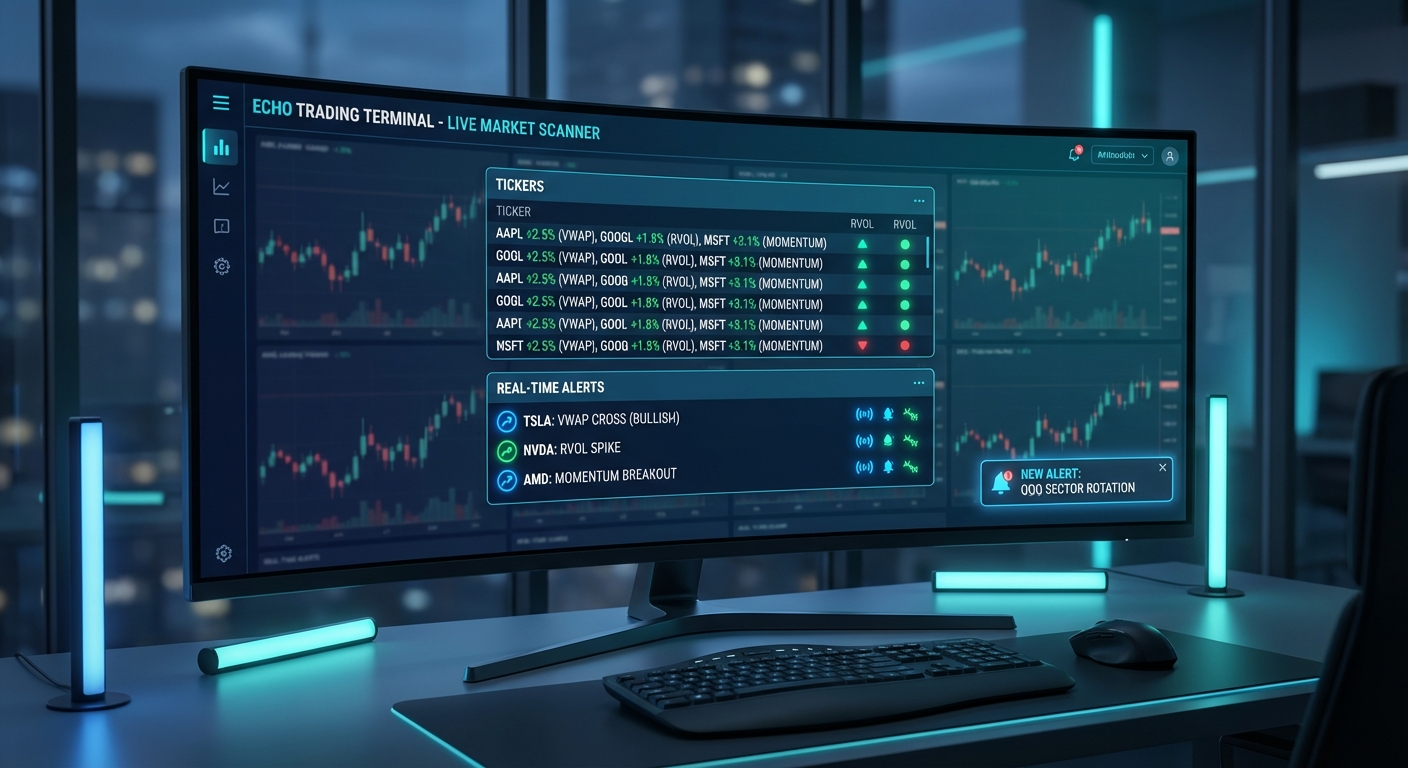
A market scanner is a software tool that continuously monitors stock price action, volume, and technical indicators across the entire market in real-time. When specific conditions are met (like a stock breaking above its opening range or reclaiming VWAP with strong volume), the scanner immediately alerts you to the opportunity.
Think of market scanners as your tireless research assistant who never blinks, never takes breaks, and can simultaneously watch every stock on every timeframe. While you're in a meeting, grabbing lunch, or analyzing a single chart, your scanner is monitoring thousands of potential setups across multiple technical criteria.
The math is simple and sobering: there are over 5,000 actively traded stocks in the U.S. market. Even if you could analyze one stock every 30 seconds (which is unrealistically fast), it would take you over 40 hours to scan the entire market once. By the time you finished, the opportunities you found at the beginning would be long gone. Manual scanning simply doesn't scale in modern markets.
This is where real-time market scanners create their value. They process market data instantly, applying complex technical filters across thousands of stocks simultaneously. When a high-quality setup forms, you receive an alert within seconds, giving you time to review the chart, confirm the setup, and execute your entry before the move happens.
For day traders specifically, market scanners solve three critical problems:
- Time efficiency: Instead of spending hours manually reviewing charts, you focus only on stocks that meet your exact criteria right now.
- Opportunity capture: You never miss a setup on your watchlist or across the broader market because you were looking at the wrong chart at the wrong time.
- Decision confidence: Modern scanners provide backtest data showing historical win rates and expected returns, so you know which setups actually have an edge before risking capital.
The shift from manual chart analysis to automated market scanning represents one of the most significant workflow improvements in retail trading over the past decade. Traders who embrace this technology gain a measurable advantage in both time management and opportunity identification.
How Market Scanners Work: The Technology Behind Real-Time Trade Discovery
Understanding how market scanners function helps you evaluate different platforms and use them more effectively. At their core, market scanners operate through a continuous four-step process: data ingestion, calculation, pattern matching, and alert delivery.
Data ingestion is the foundation. Professional market scanners connect to real-time market data feeds that deliver price, volume, and order book information with minimal latency. This data streams continuously during market hours, updating multiple times per second for actively traded stocks. The quality and speed of this data feed directly impacts how quickly you receive alerts.
Once data arrives, the scanner performs technical calculations across multiple indicators simultaneously. For each stock, the system calculates metrics like VWAP (Volume Weighted Average Price), relative volume compared to historical averages, moving averages, RSI, and dozens of other technical indicators. These calculations happen in real-time as new price bars form across different timeframes (1-minute, 5-minute, 15-minute, hourly, daily).
The pattern matching engine then compares current market conditions against predefined criteria. For example, an Opening Range Breakout scanner might look for stocks that: (1) have traded above average volume in the first 15 minutes, (2) are now breaking above the high of that opening range, (3) are above VWAP, and (4) show increasing momentum. When all conditions align, the scanner flags the setup.
Finally, the alert delivery system notifies you through your preferred channel—push notifications to your phone, desktop alerts, email, or SMS. The best market scanners prioritize alerts by quality and freshness, ensuring you see the most actionable setups first rather than drowning in notification noise.
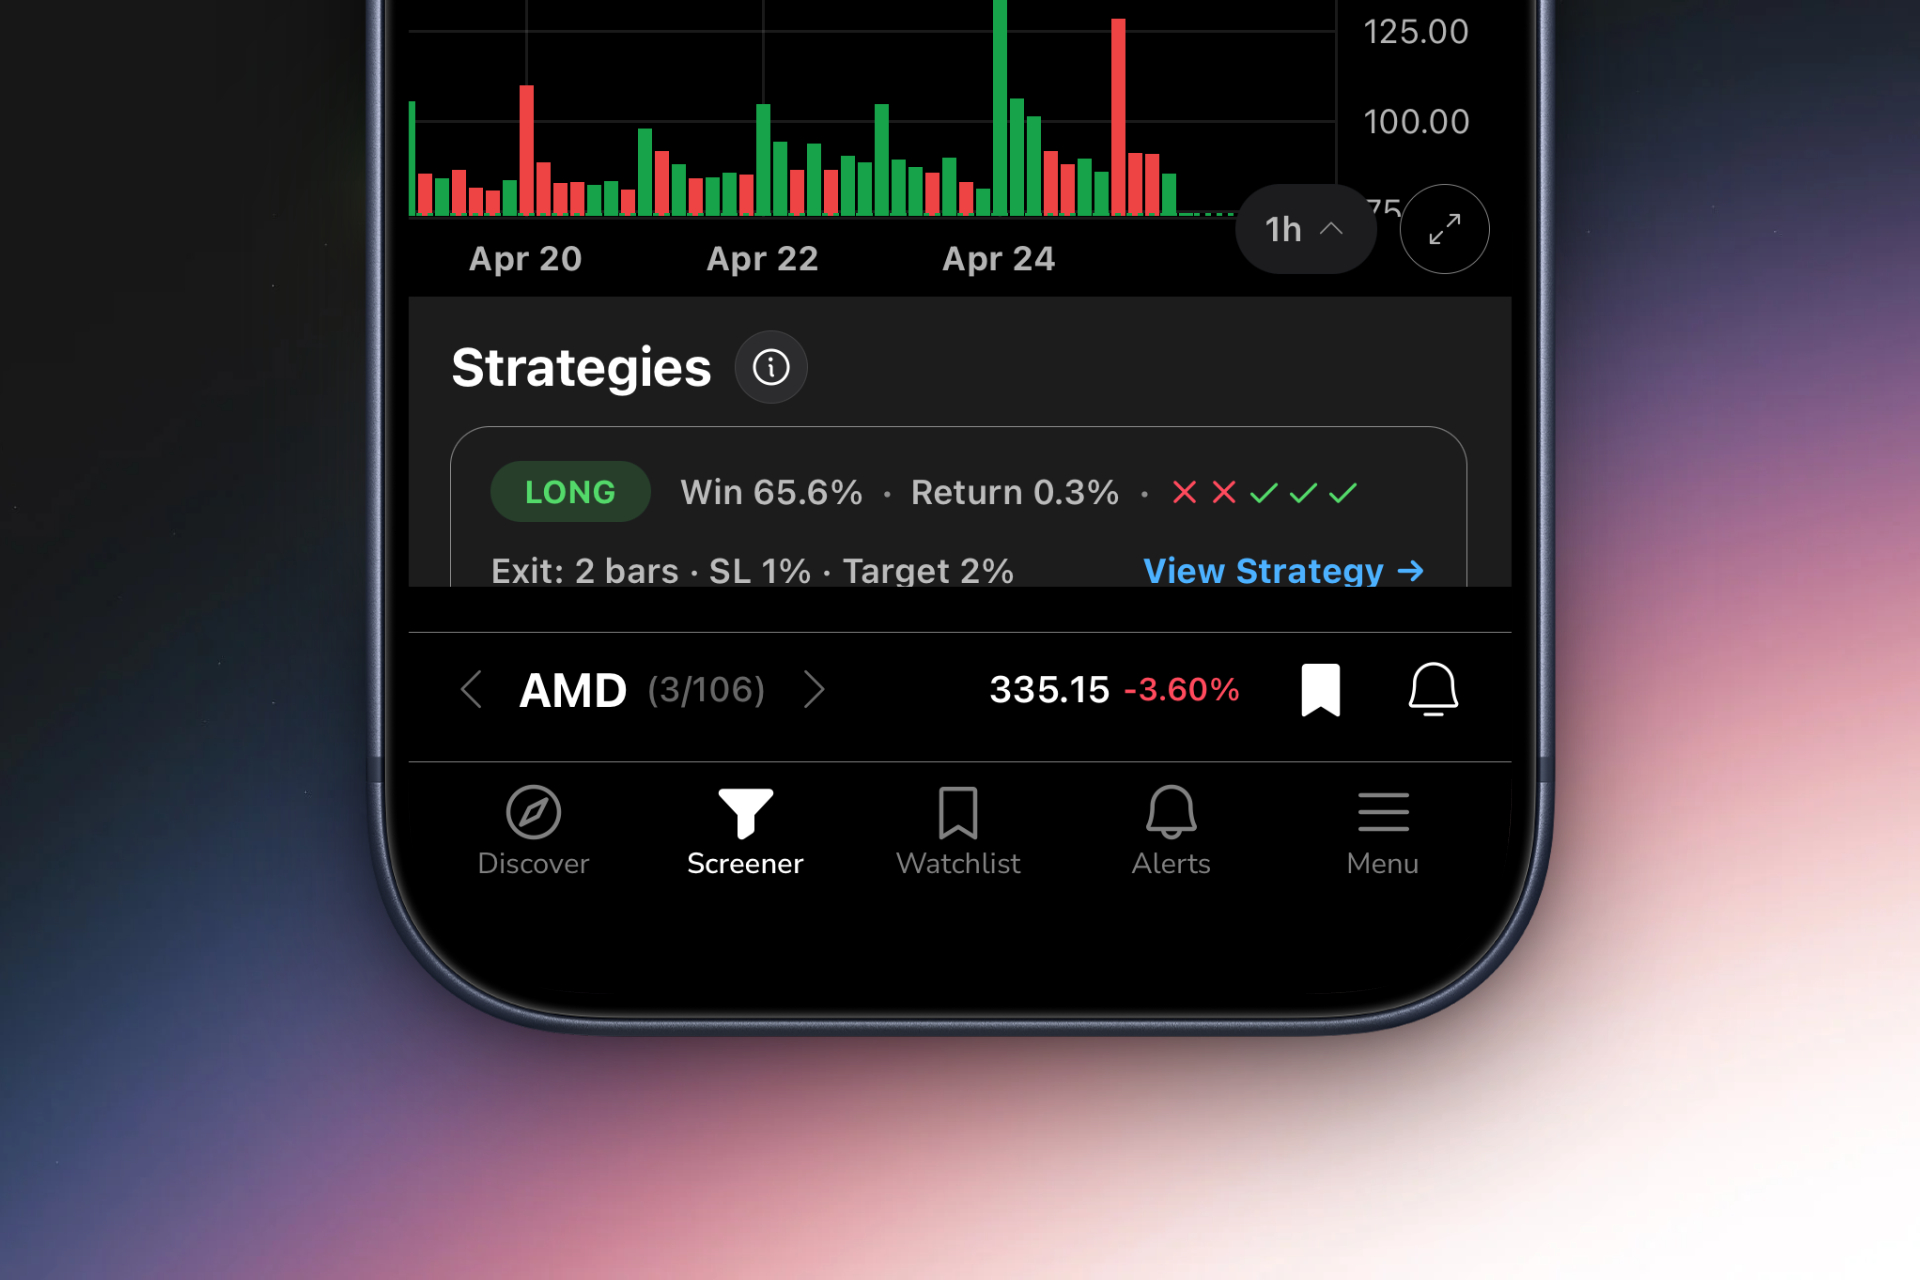
Modern platforms like ChartMath take this a step further by adding a discovery layer on top of traditional scanning. Instead of just receiving alerts, you can swipe through a curated feed of the highest-quality setups currently forming across the market, ranked by technical strength and backed by historical performance data. This mobile-first approach transforms market scanning from a passive alert system into an active discovery experience.
The technical architecture matters because it determines three critical factors: speed (how quickly you're notified after a setup forms), accuracy (whether the scanner correctly identifies valid setups without false positives), and coverage (how many stocks and timeframes the system can monitor simultaneously).
Essential Technical Setups Market Scanners Should Detect
Not all market scanners are created equal. The value of a scanning platform depends heavily on which technical setups it can identify. Here are the essential patterns and signals that professional-grade market scanners should detect in real-time:
Opening Range Breakout (ORB)
The Opening Range Breakout is one of the most reliable intraday patterns for day traders. This setup identifies stocks that break above (or below) the high (or low) of the first 5, 15, or 30 minutes of trading with strong volume. ORB setups work because the opening range often represents a battle between buyers and sellers; when one side wins decisively, momentum tends to continue.
Your market scanner should detect ORB patterns across multiple timeframes and alert you the moment the breakout occurs, ideally with volume confirmation and VWAP positioning context.
VWAP Reclaims and Rejections
VWAP (Volume Weighted Average Price) serves as a dynamic support and resistance level that institutional traders watch closely. When a stock that's been trading below VWAP crosses back above it with strong volume, this VWAP reclaim often signals a shift in momentum. Conversely, rejections at VWAP can signal continuation of the existing trend.
Effective market scanners monitor VWAP relationships continuously and alert you to reclaims, rejections, and holds across different timeframes. For more details on how to trade this powerful indicator, check out our guide on VWAP trading strategies.
Relative Volume (RVOL) Spikes
Volume is the fuel that drives price movement. Relative volume compares current trading volume to the stock's historical average at the same time of day. When RVOL spikes above 2x or 3x normal levels, it indicates unusual interest—often preceding significant price moves.
Your scanner should identify RVOL spikes early, before the price move is complete, giving you time to analyze the catalyst and position accordingly. The best scanners combine RVOL alerts with other technical factors like price position relative to key levels.
Momentum Breakouts and Breakdowns
Momentum setups capture stocks making strong directional moves with increasing velocity. These include breakouts above resistance levels, breakdowns below support, and continuation patterns where strong trends accelerate. Market scanners should identify these moves across multiple timeframes, from 1-minute scalp opportunities to daily swing setups.
The key differentiator is whether your scanner can distinguish between low-quality breakouts (weak volume, poor structure) and high-probability momentum plays (strong volume, clean technical setup, favorable risk/reward). Learn more about capturing these opportunities in our article on real-time breakout trading.
Chart Pattern Recognition
Classic chart patterns like bull flags, ascending triangles, cup and handle formations, and head and shoulders patterns continue to provide edge in modern markets. Advanced market scanners use pattern recognition algorithms to identify these formations as they develop, not just after they've completed.
The challenge with pattern scanning is balancing sensitivity (catching all valid patterns) with specificity (avoiding false positives). The best platforms show you the pattern, explain why it triggered, and provide historical data on how similar setups have performed.
Multi-Timeframe Confluence Signals
The highest-probability setups often show alignment across multiple timeframes. For example, a stock might be breaking out on the 5-minute chart while simultaneously holding above VWAP on the 15-minute chart and respecting an uptrend on the daily chart. This multi-timeframe confluence significantly increases the odds of success.
Sophisticated market scanners analyze relationships across timeframes and highlight setups where multiple technical factors align. This is where platforms like ChartMath excel, running 200+ curated screens that combine multiple technical criteria to surface only the highest-quality opportunities.
For a deeper dive into which specific indicators provide the most edge, read our comparison of VWAP vs RVOL vs ORB performance.
The Critical Role of Backtest Data in Validating Scanner Alerts
Here's an uncomfortable truth: most market scanner alerts lose money. Just because a stock crosses above VWAP or breaks its opening range doesn't automatically mean you should trade it. The difference between profitable scanning and expensive noise comes down to one critical factor: backtest data.
Backtesting applies a trading strategy to historical market data to see how it would have performed in the past. When a market scanner shows you an alert, the essential question is: "How have similar setups performed historically?" Without this data, you're trading blind.
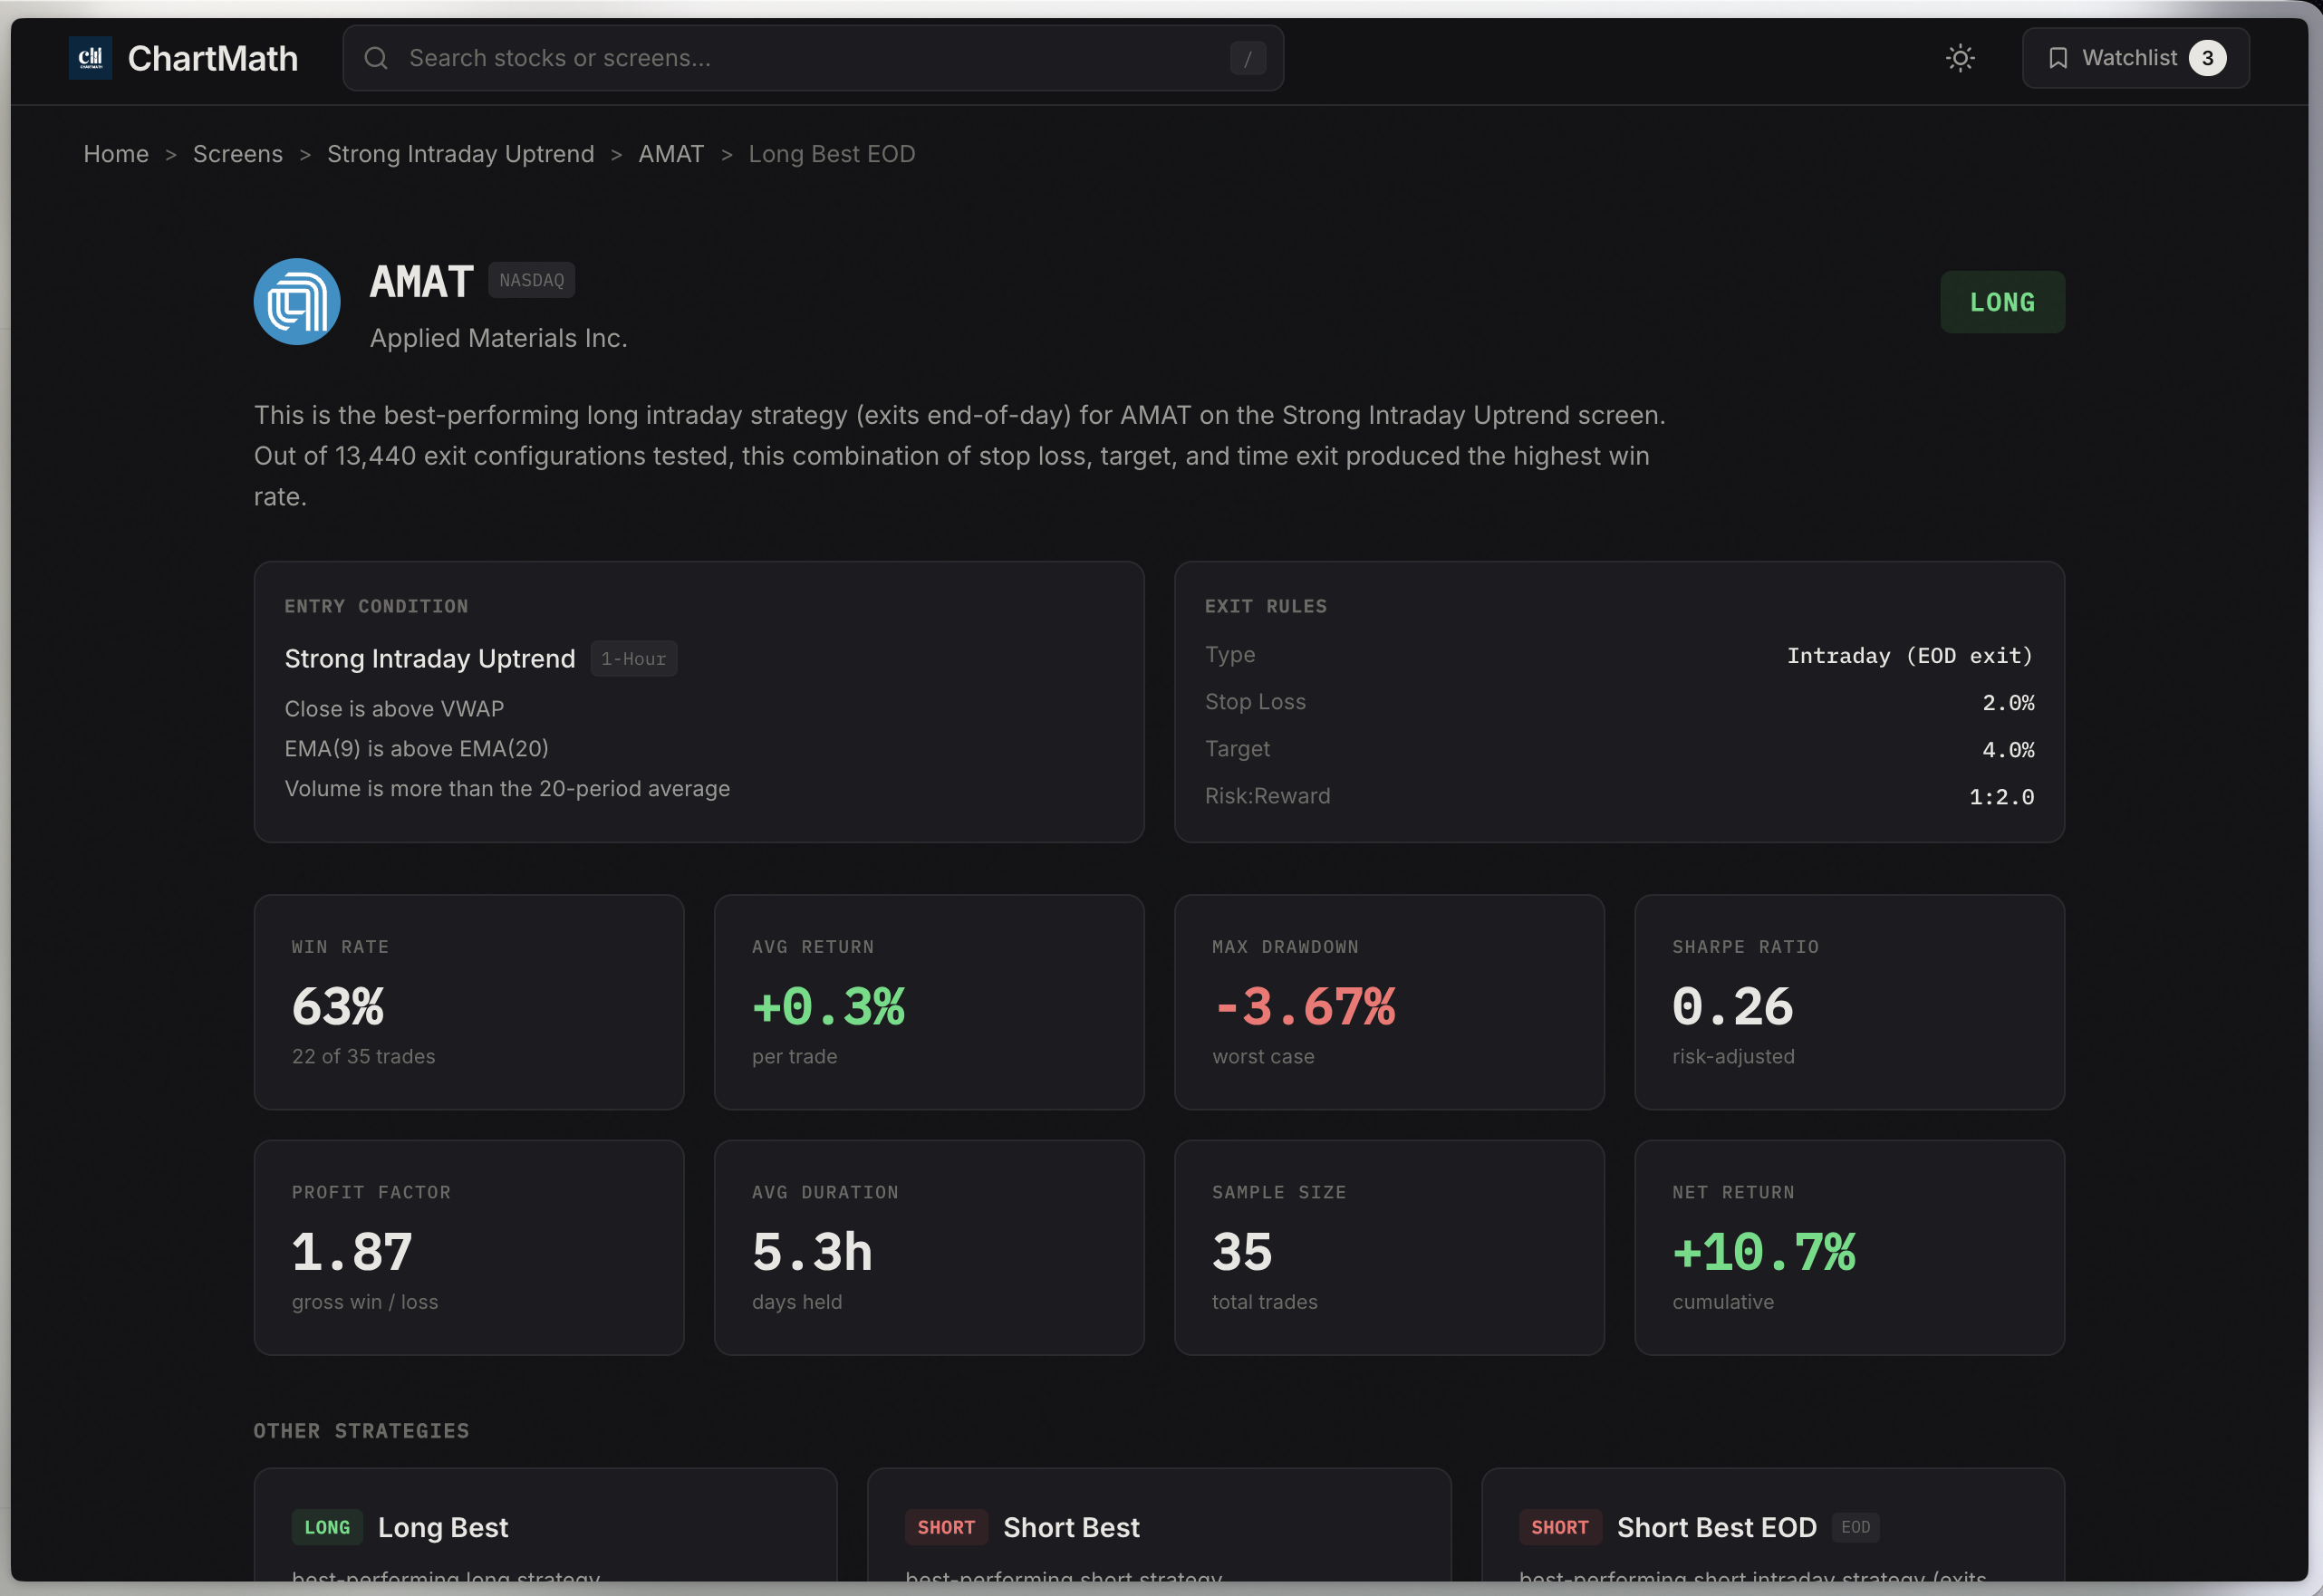
Professional market scanners provide transparency into the historical performance of every screen they offer. This typically includes:
Win rate: What percentage of historical signals resulted in profitable trades?
Average return per trade: When you win, how much do you make? When you lose, how much do you lose?
Expected value (EV): The average profit or loss per trade when you account for both wins and losses.
Sample size: How many historical trades does this data represent? (Larger samples are more reliable.)
Maximum drawdown: What's the worst losing streak this strategy has experienced?
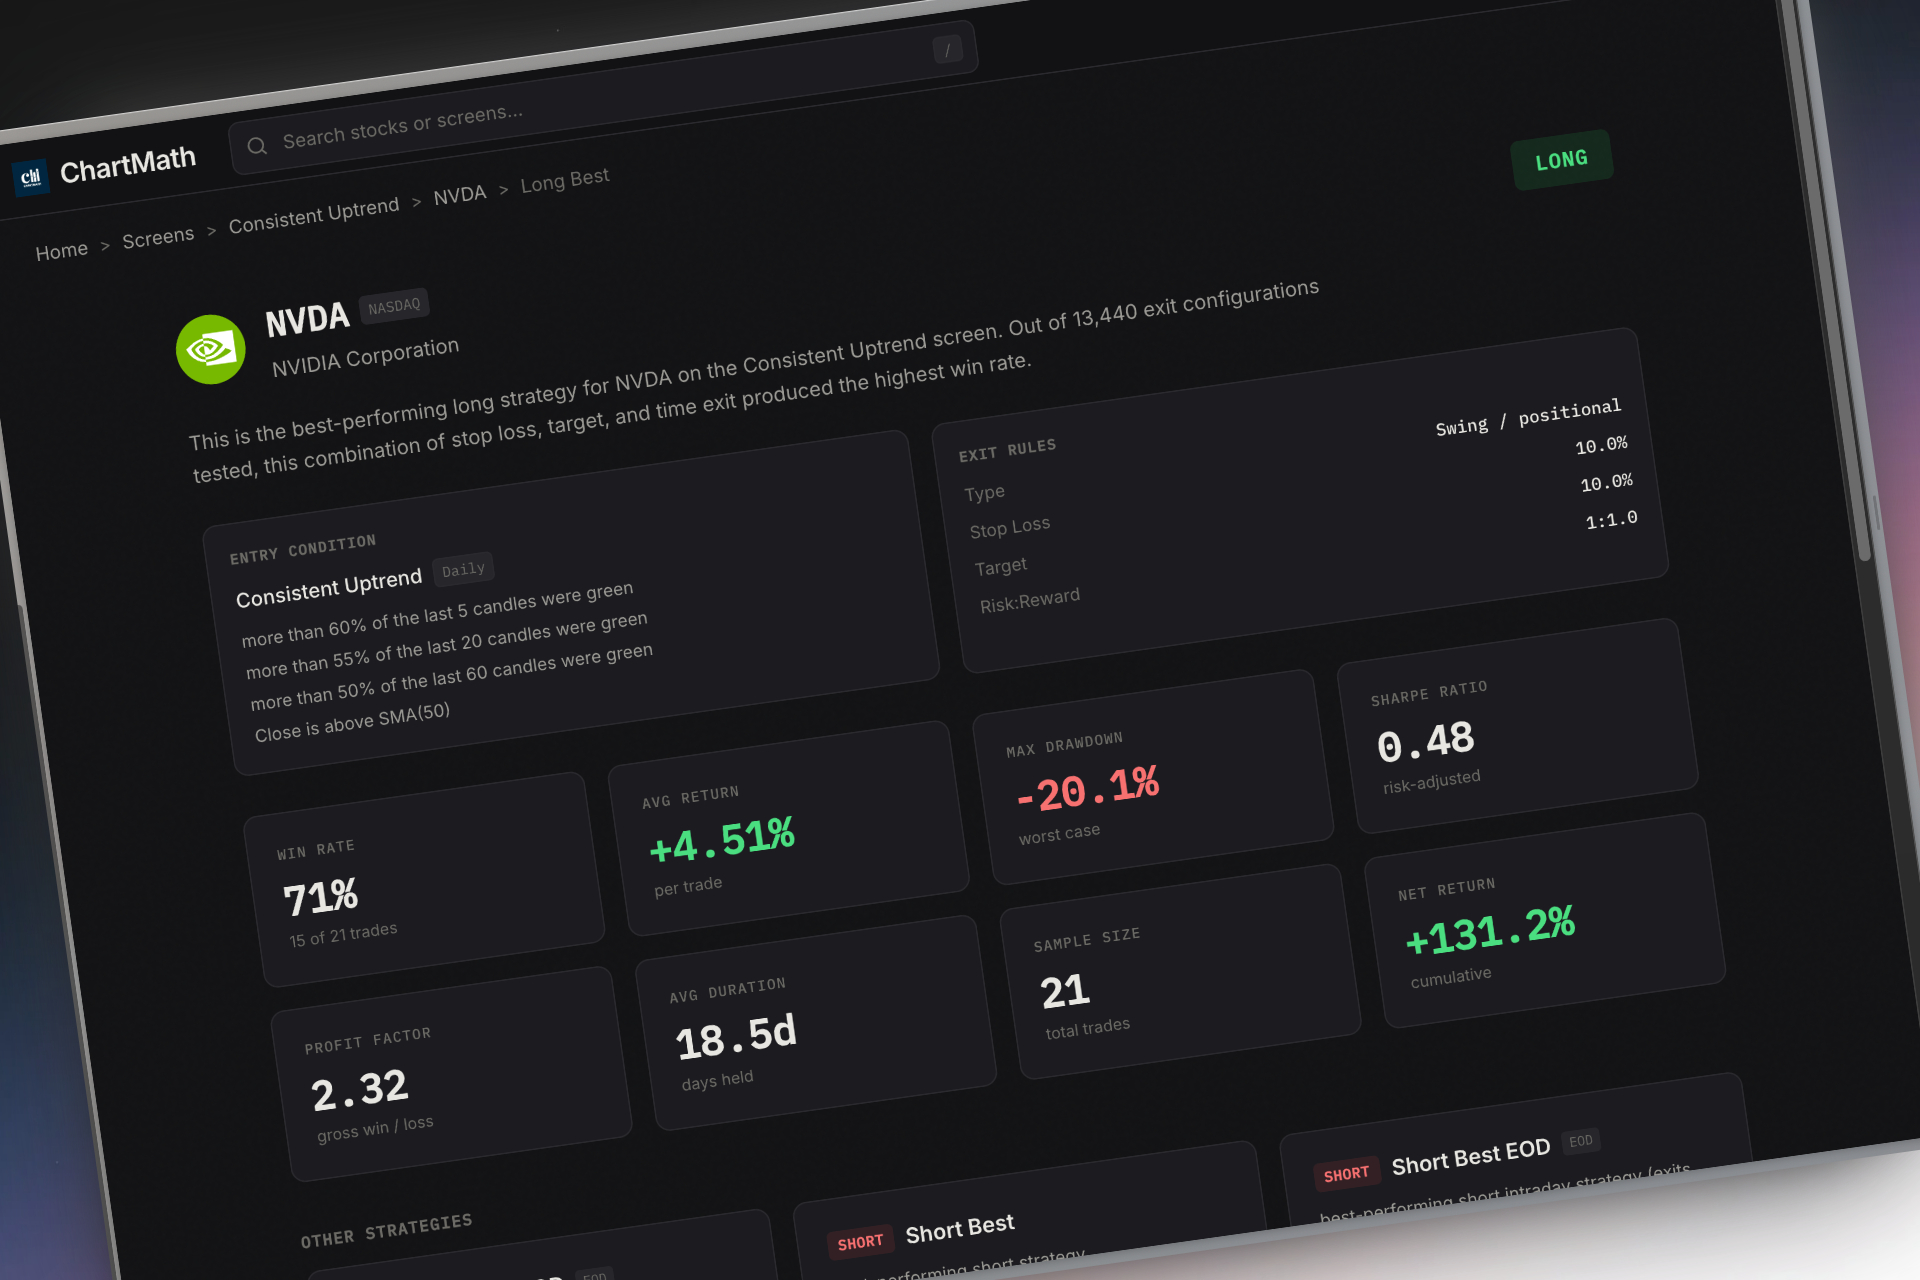
This data transforms market scanning from guesswork into evidence-based trading. When ChartMath alerts you to an ORB setup, you can see that this specific pattern has historically won 62% of the time with an average return of 1.8% per trade over 1,247 historical instances. That's actionable intelligence.
The difference between scanners with and without backtest data is stark. Without performance data, you receive dozens of alerts daily with no way to prioritize them. You don't know which setups actually work, which timeframes are most reliable, or what exit strategy to use. You're essentially paying for noise.
With transparent backtest data, you can build a systematic approach: focus on screens with positive expected value, size positions according to historical win rates, and set profit targets based on average winning trade size. You're trading with an edge, not hope.
When evaluating market scanners, ask these questions: Does the platform show historical performance for each screen? Is the backtest methodology transparent? Can you see sample sizes and time periods? Are results updated regularly as new data becomes available? If the answer to any of these is "no," you're using a tool that can't validate its own value.
For traders serious about building data-driven strategies, our comprehensive guide on building winning backtesting strategies provides the framework for validating any trading setup.
Desktop vs Mobile Market Scanners: Which Approach Works Best
The traditional approach to market scanning involves desktop software with multiple monitors, complex interfaces, and the requirement that you remain physically present at your trading station. This model made sense 10 years ago, but it's increasingly misaligned with how modern traders actually work.
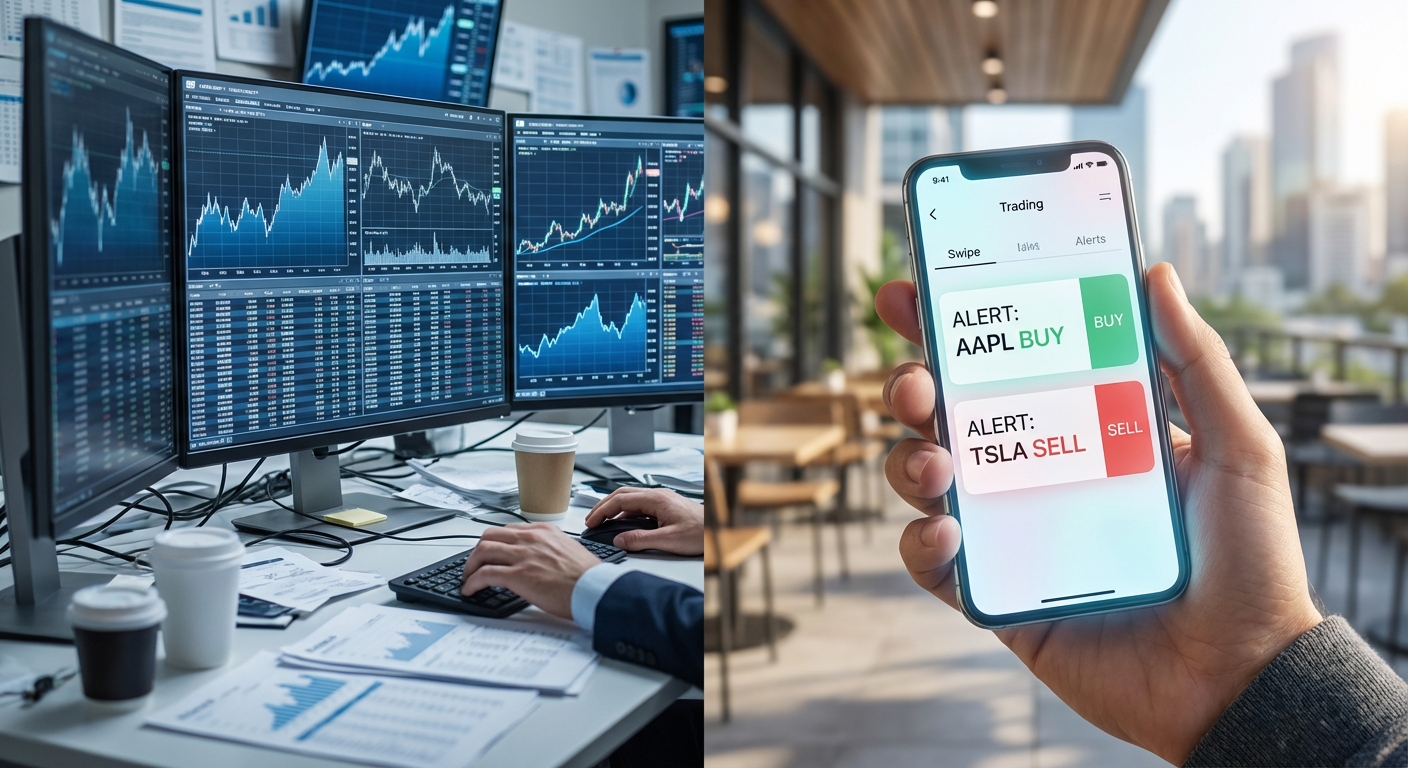
Desktop scanning limitations are significant in 2026. You're tethered to a specific location, which means you miss opportunities whenever you're away from your screens. If a perfect setup forms while you're in a meeting, commuting, or grabbing lunch, you simply don't see it until it's too late. Desktop scanners also tend toward complexity, with dozens of customization options that require significant time investment to configure properly.
The mobile-first approach to market scanning solves these problems by delivering curated, high-quality alerts directly to your phone with push notifications. You're no longer location-dependent. Whether you're at your desk, in a meeting, or away from home, you receive instant notifications when high-probability setups form.
The benefits of mobile market scanners extend beyond simple portability:
- Push notifications ensure you never miss entries: Your phone alerts you the moment a setup forms, regardless of what you're doing.
- Simplified interfaces reduce decision fatigue: Instead of 50 customization options, you get curated screens designed by experienced traders.
- Swipe-based discovery feels natural: Modern mobile scanners use familiar interfaces (similar to social media) to let you quickly browse and evaluate opportunities.
- Faster decision-making: Mobile interfaces prioritize essential information, helping you evaluate setups in seconds rather than minutes.
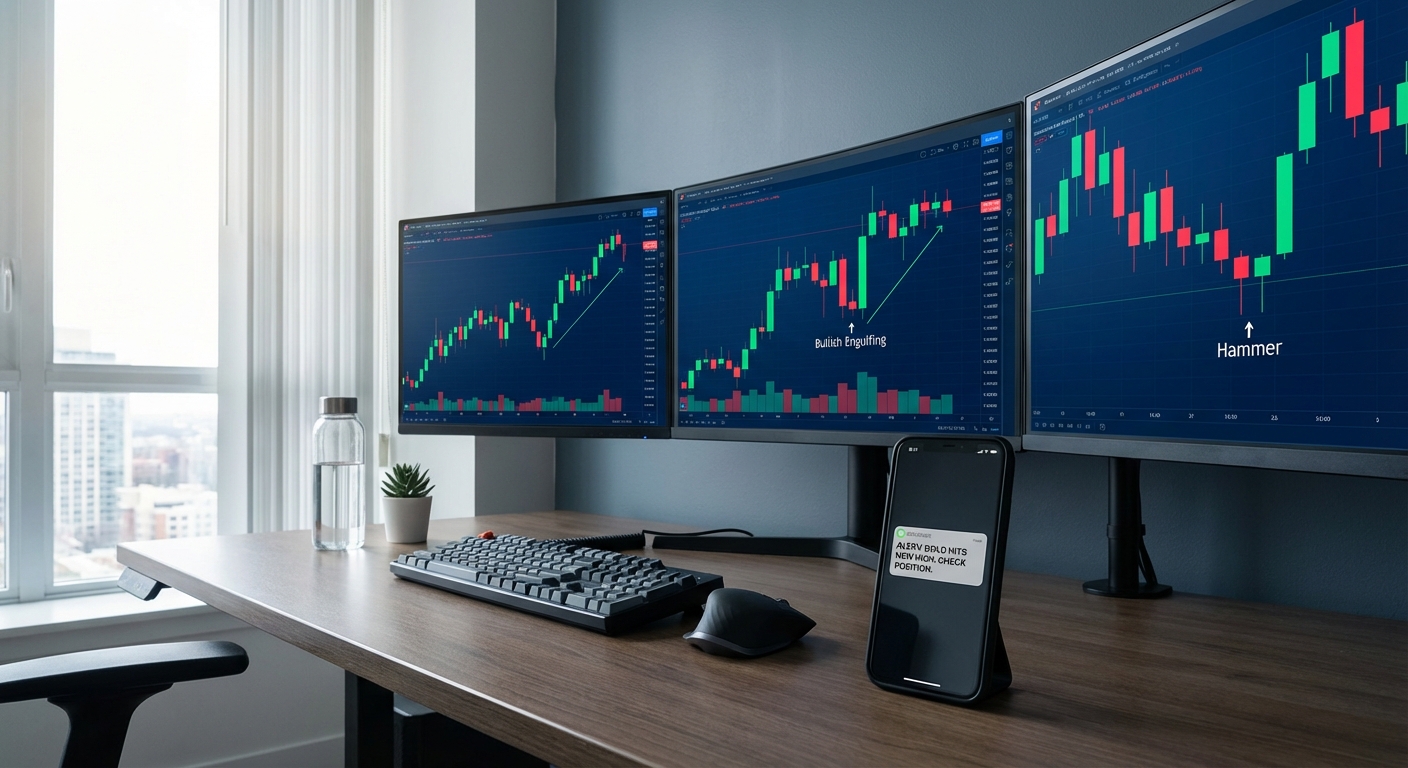
The most effective approach in 2026 is the companion app model. This means using a mobile market scanner to discover and monitor opportunities, then switching to your preferred charting platform (TradingView, Thinkorswim, etc.) when you're ready to analyze and execute. Your scanner finds the setups; your charting platform provides the detailed analysis.
ChartMath exemplifies this approach with a mobile-first platform that delivers 200+ pre-built technical screens to your phone. You receive push alerts when high-quality setups form, swipe through a ranked feed of current opportunities, and tap through to your charting platform when you want to execute. The scanner handles discovery; you handle execution.
This doesn't mean desktop scanning is obsolete. Professional day traders who spend entire sessions at their trading stations may prefer desktop platforms with extensive customization. But for the majority of traders who have other responsibilities, need flexibility, or trade part-time, mobile-first market scanners provide superior opportunity capture without requiring constant screen presence.
Solving Alert Fatigue: Quality Over Quantity in Market Scanning
One of the biggest complaints about market scanners is alert fatigue—the overwhelming flood of notifications that makes it impossible to identify which opportunities actually matter. When your scanner sends 50 alerts per day, you either ignore most of them (missing good setups) or try to evaluate all of them (wasting time on low-quality signals).
The problem isn't scanning technology itself; it's the lack of intelligent filtering and prioritization. Early-generation scanners operated on simple logic: if conditions A, B, and C are met, send an alert. This binary approach generates massive noise because it treats all alerts equally, regardless of quality, timing, or historical performance.
Modern market scanners solve alert fatigue through several key innovations:
Quality filtering applies multiple layers of technical criteria to ensure only high-probability setups trigger alerts. Instead of alerting on every VWAP cross, the scanner might require: VWAP cross + above-average volume + bullish price structure + favorable risk/reward ratio. This multi-factor approach dramatically reduces false positives.
Ranking systems prioritize alerts based on technical strength and freshness. When you open your scanner, you see the best opportunities first—setups that meet multiple criteria, show strong technical alignment, and are forming right now. Lower-quality or older setups appear further down the feed or don't appear at all.
Customization options let you align scanner behavior with your personal trading style. If you only trade momentum breakouts on the 5-minute timeframe, you can filter out everything else. If you prefer swing setups on daily charts, you can focus exclusively on those. Customization reduces noise by eliminating setups you'd never trade anyway.
Plain-English explanations help you quickly evaluate whether an alert deserves your attention. Instead of raw technical data ("RSI: 67.3, RVOL: 2.4x, Price/VWAP: 1.02"), modern scanners explain: "This stock just broke above its opening range with 2.4x normal volume while holding above VWAP—a bullish momentum setup that historically wins 64% of the time."
Context matters enormously. When you understand why an alert triggered and what the historical edge is, you can make faster, more confident decisions about which setups to pursue.
ChartMath addresses alert fatigue through its TikTok-style discovery feed, which ranks setups by quality and freshness. Instead of receiving 50 undifferentiated alerts, you swipe through a curated feed where the best opportunities appear first. Each setup includes plain-English explanations and backtest data, so you immediately understand the edge. This transforms scanning from overwhelming to actionable.
The key principle: more alerts don't equal more profit. In fact, the opposite is often true. A scanner that sends you five high-quality, well-explained alerts per day is far more valuable than one that sends 50 random signals. Quality filtering and intelligent prioritization are what separate professional-grade market scanners from noise generators.
Choosing the Right Market Scanner: Key Features to Evaluate
With dozens of market scanners available in 2026, choosing the right platform requires evaluating several critical features. Here's what to look for when comparing options:
Real-Time vs Delayed Data Feeds
For day trading, real-time data is non-negotiable. Delayed data (even by 15 minutes) makes intraday scanning essentially useless, by the time you see the alert, the opportunity has passed. Verify that any scanner you consider provides real-time market data during trading hours. Some platforms charge extra for real-time feeds; factor this into your total cost.
Number and Variety of Pre-Built Screens
Unless you want to spend weeks building custom scans, you need a platform with comprehensive pre-built screens. Look for scanners offering dozens or hundreds of curated setups covering different strategies (momentum, breakouts, reversals, VWAP plays, ORB patterns) and timeframes (1-minute through daily).
ChartMath provides 200+ pre-built technical screens, eliminating the need for coding or manual configuration. This breadth ensures you can find setups that match your specific trading style without building everything from scratch.
Backtesting Capabilities and Transparency
As discussed earlier, backtest data is critical for validating which setups actually work. Evaluate whether the platform shows historical performance for each screen, including win rates, average returns, sample sizes, and drawdown statistics. Transparency in methodology matters, you should understand how the backtest was conducted and what assumptions were made.
Mobile Accessibility and User Experience
If you need to monitor markets while away from your desk, mobile accessibility is essential. Evaluate the mobile app's interface, notification system, and ease of use. Can you quickly evaluate setups on a small screen? Are push notifications reliable and timely? Does the app feel responsive and well-designed?
The best mobile scanners prioritize simplicity and speed, recognizing that you're making quick decisions on a phone rather than conducting deep analysis.
Customization and Watchlist Features
While pre-built screens handle most needs, you should be able to create custom watchlists of stocks you're tracking. When a technical setup forms on one of your watchlist stocks, you want immediate notification. Look for platforms that let you combine watchlist monitoring with technical screening.
Pricing Models and Free Tier Availability
Market scanner pricing varies dramatically, from free platforms with limited features to professional tools costing $100+ per month. Evaluate what you're getting for the price: data quality, number of screens, mobile access, backtest data, and support.
Platforms offering free tiers let you test functionality before committing. ChartMath provides a free tier so you can experience the mobile-first interface and curated screens before deciding whether to upgrade for additional features.
Integration with Existing Charting Platforms
Your market scanner doesn't need to replace your charting platform, it should complement it. Look for scanners that integrate smoothly with TradingView, Thinkorswim, or whatever charting software you already use. The ideal workflow: scanner discovers the opportunity, charting platform provides detailed analysis, broker executes the trade.
For more guidance on building an efficient multi-tool workflow, see our article on building an efficient trading workflow in 2026.
Market Scanner Comparison: Finding Your Best Fit in 2026
Understanding the market scanner landscape helps you identify which platform aligns with your needs. Here's how different approaches compare:
Code-Required Platforms vs Pre-Built Solutions
Platforms like TradingView offer powerful customization through Pine Script, but require coding knowledge to build custom alerts. This works well for technically-inclined traders willing to invest time in development. However, most traders prefer pre-built solutions that deliver proven setups immediately without requiring programming skills.
ChartMath takes the pre-built approach, offering 200+ curated screens with backtested performance data. No coding required, just select the setups that match your strategy and start receiving alerts.
Fundamental Screeners vs Technical Scanners
Tools like Finviz excel at fundamental screening (P/E ratios, earnings growth, sector filters) but provide limited real-time technical scanning. If you're a technical trader focused on price action, volume, and chart patterns, you need a scanner built specifically for technical analysis.
Technical scanners like ChartMath focus exclusively on price action, volume, and technical indicators, providing real-time alerts when chart-based setups form.
Desktop-Only vs Mobile-First Platforms
Traditional desktop scanners like TC2000 and Trade Ideas offer extensive features but require you to be at your computer. Mobile-first platforms prioritize accessibility and push notifications, ensuring you never miss opportunities regardless of location.
The mobile-first approach suits traders who have other responsibilities, travel frequently, or simply want the flexibility to monitor markets from anywhere. ChartMath's TikTok-style mobile interface exemplifies this approach, making market scanning as accessible as checking social media.
Transparent Backtest Data vs Black-Box AI
Some platforms use AI to generate pattern confidence scores without explaining the methodology. While this sounds sophisticated, it creates a black-box problem, you don't know why the AI assigned a particular score or how it performed historically.
Transparent platforms show actual backtest statistics (win rate, average return, sample size) and explain the technical criteria behind each screen. This transparency lets you make informed decisions based on data rather than trusting opaque algorithms.
Price Points and Value Propositions
Market scanner pricing ranges from free (Finviz basic) to $200+/month (professional Trade Ideas subscriptions). Evaluate value based on what you actually need: real-time data, mobile access, backtest transparency, number of screens, and ease of use.
Mid-tier platforms often provide the best value for retail traders, offering professional-grade features without enterprise pricing. ChartMath positions itself in this space with a free tier for basic access and affordable paid plans for advanced features.
ChartMath's Approach to Modern Market Scanning
ChartMath differentiates itself through three core principles: mobile-first accessibility, transparent backtest data, and curated quality over raw quantity. Instead of overwhelming you with alerts, it delivers a ranked feed of high-probability setups with plain-English explanations and historical performance data.
The platform runs 200+ technical screens continuously, covering everything from ORB patterns to VWAP plays to momentum breakouts across multiple timeframes. When a setup forms, you receive a push notification and can swipe through the discovery feed to evaluate opportunities in seconds.
This approach works particularly well for traders who want professional-grade scanning without desktop complexity, who value data-driven decision-making, and who need flexibility to monitor markets while managing other responsibilities. Watch a demo to see the mobile-first interface in action.
Building Your Market Scanner Workflow for Maximum Efficiency
Having the right market scanner is only half the equation. The other half is building an efficient workflow that integrates scanning into your daily trading routine. Here's how to structure your day for maximum effectiveness:
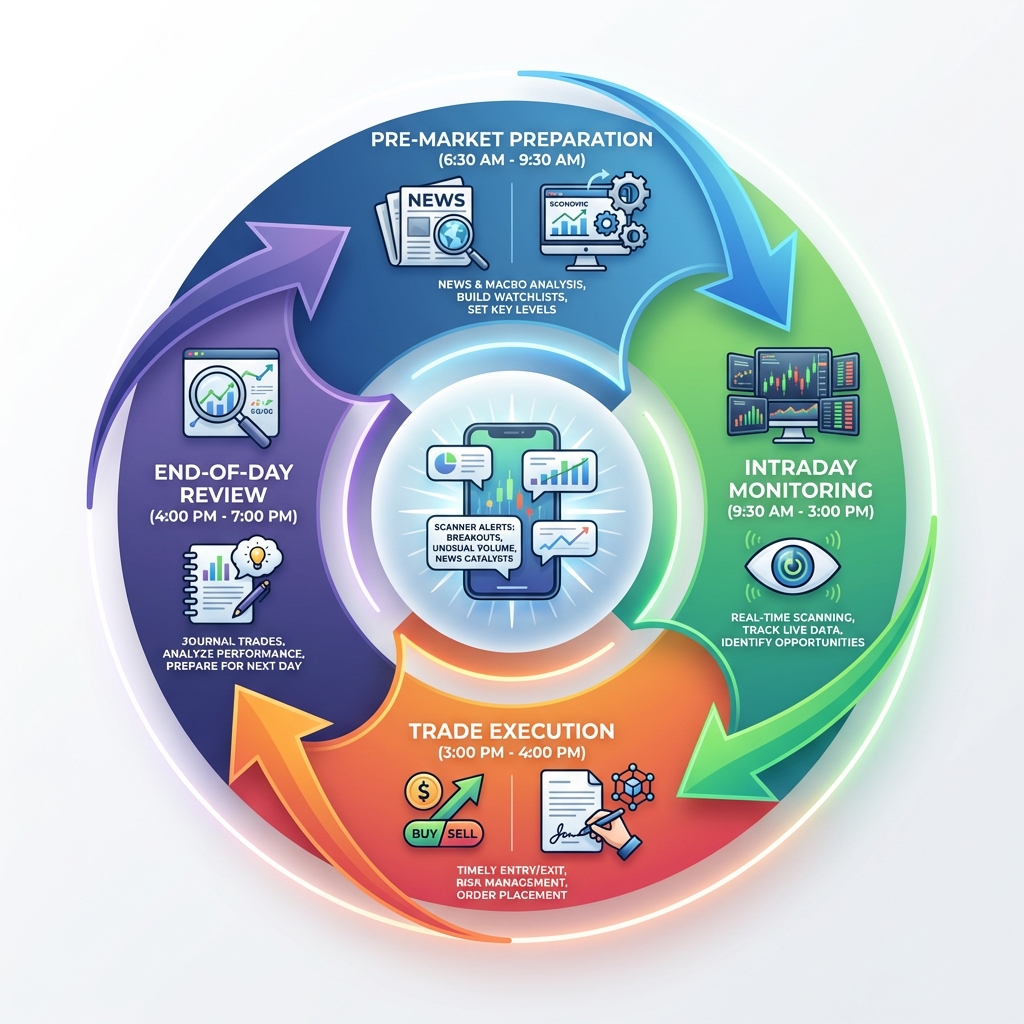
Pre-Market Preparation and Scanner Setup
Start your day 30-60 minutes before the market opens. Review overnight news, check futures, and identify stocks with catalysts (earnings, news, unusual pre-market volume). Add these to your watchlist so your scanner monitors them for technical setups throughout the day.
Configure your scanner settings based on current market conditions. In high-volatility environments, you might focus on breakout and momentum screens. In choppy, range-bound markets, you might emphasize reversal and VWAP plays. Adapting your scanner focus to market conditions improves signal quality.
Intraday Monitoring Strategies
During market hours, let your scanner do the heavy lifting. Instead of manually flipping through charts, focus on your current positions and respond to scanner alerts when high-quality setups form. This reactive approach is far more efficient than proactive chart-surfing.
When you receive an alert, follow a quick evaluation process: (1) Check the backtest data, does this setup have positive expected value? (2) Review the chart on your preferred platform, does the setup look clean? (3) Verify the risk/reward ratio, is there a clear stop and target? (4) Execute if all factors align.
This systematic approach takes 30-60 seconds per alert and ensures you're only trading setups with documented edge.
Managing Multiple Timeframes Simultaneously
One of the biggest advantages of market scanners is the ability to monitor multiple timeframes at once. Your scanner can simultaneously watch for 1-minute scalp setups, 5-minute momentum plays, and daily swing opportunities, alerting you to whichever forms first.
Organize your scanner by timeframe if you trade different strategies on different timeframes. For example, you might actively trade 5-minute setups during the first hour of the market, then switch to monitoring daily setups for swing positions in the afternoon. Your scanner adapts to your schedule.
For detailed guidance on executing rapid intraday plays, read our guide on intraday trading across 1-minute to 15-minute timeframes.
Integrating Scanner Alerts with Charting Platforms
Your market scanner and charting platform should work together seamlessly. When you receive a scanner alert, you should be able to pull up the chart in your preferred platform with a single tap or click. Many modern scanners provide direct links to TradingView, Thinkorswim, or other charting tools.
This integration creates a smooth workflow: scanner discovers → you verify on charts → you execute through your broker. Each tool does what it does best. For more on connecting these pieces, see our article on integrating trading alerts with your charting platform.
End-of-Day Review and Watchlist Updates
After the market closes, spend 15-30 minutes reviewing the day's scanner alerts. Which setups worked? Which failed? Are there patterns in what's working in the current market environment? This review process helps you refine which screens you prioritize.
Update your watchlist based on end-of-day scans. Look for stocks setting up for potential moves tomorrow, stocks approaching key levels, forming chart patterns, or showing unusual volume. Add these to your watchlist so your scanner monitors them for entry signals the next day.
Tracking Performance of Scanner-Generated Trades
Maintain a trading journal that tracks which scanner screens generated your trades. Over time, you'll identify which setups work best for your execution style and risk tolerance. You might discover that ORB setups on the 5-minute chart consistently perform well for you, while VWAP reversals don't. This data lets you focus on your highest-edge opportunities.
The combination of scanner backtest data (how setups perform historically) and your personal performance data (how you execute those setups) creates a powerful feedback loop for continuous improvement.
Common Market Scanner Mistakes and How to Avoid Them
Even with the best market scanner, traders make predictable mistakes that undermine their results. Here are the most common pitfalls and how to avoid them:
Chasing Every Alert Without Strategy
The biggest mistake is treating every scanner alert as a trade signal. Just because your scanner identifies a setup doesn't mean you should trade it. You need a strategy that defines which setups you trade, under what conditions, with what position sizing, and with what exit plan.
Solution: Define your trading strategy first, then configure your scanner to support that strategy. If you only trade momentum breakouts in the first hour, filter out everything else. Discipline beats opportunity volume.
Ignoring Backtest Data and Historical Performance
Many traders receive scanner alerts without checking whether those setups actually have positive expected value. Trading setups with negative historical performance is a guaranteed way to lose money over time.
Solution: Before trading any scanner signal, verify the backtest data. What's the win rate? What's the average return? Is the sample size large enough to be meaningful? Only trade setups with documented edge.
Over-Customizing Filters Without Testing
Some traders spend hours tweaking scanner parameters, adding more and more filters in pursuit of the "perfect" setup. This over-optimization often leads to filters so narrow that they rarely trigger, or filters that worked in backtests but fail in live markets.
Solution: Start with proven pre-built screens and only customize if you have a specific, tested reason. Simplicity often outperforms complexity in market scanning.
Relying Solely on Scanners Without Chart Confirmation
Market scanners identify potential setups, but you should always confirm on the chart before executing. Sometimes a setup that looks good on paper shows poor structure, unfavorable context, or problematic risk/reward when you examine the actual chart.
Solution: Use a two-step process: scanner identifies → you confirm. Never execute based solely on an alert without visual chart verification.
Not Adapting Scanner Settings to Market Conditions
Setups that work in trending markets often fail in choppy markets, and vice versa. Traders who use the same scanner settings regardless of market environment experience inconsistent results.
Solution: Adjust your scanner focus based on current conditions. In strong trends, emphasize momentum and breakout screens. In range-bound markets, focus on reversal and mean-reversion setups. Flexibility improves signal quality.
The Future of Market Scanners: What's Coming in 2026 and Beyond
Market scanning technology continues to evolve rapidly. Here are the trends shaping the future of trade discovery:
AI-Enhanced Pattern Recognition
Artificial intelligence is improving pattern recognition accuracy, identifying complex setups that traditional rule-based scanners miss. However, the key is transparent AI, systems that explain why they identified a pattern and show historical performance data, rather than black-box scoring.
Improved Mobile Experiences and Interfaces
Mobile-first design will continue to improve, with interfaces that make complex technical analysis accessible on small screens. Expect more swipe-based discovery feeds, better visualization of technical setups, and faster decision-making tools optimized for mobile.
Greater Transparency in Backtesting Methodologies
As traders become more sophisticated, demand for transparent backtest data will increase. Future platforms will provide more detailed performance breakdowns, including results across different market conditions, time periods, and exit strategies.
Integration with Social Trading and Community Insights
Some platforms are beginning to integrate community features, showing which setups other traders are watching or trading. This social layer adds context to scanner alerts, though it's important to maintain independent analysis rather than blindly following the crowd.
Predictive Analytics and Probability Scoring
Advanced platforms are moving beyond simple pattern detection toward predictive analytics that estimate the probability of success for each setup based on current market conditions, volatility, and historical context. This helps traders prioritize the highest-probability opportunities.
The overarching trend is toward more accessible, more transparent, and more mobile-friendly market scanning. The platforms that win will be those that combine sophisticated technology with simple, intuitive interfaces and transparent performance data.
Take Your Trading to the Next Level with Smart Market Scanning
Market scanners have fundamentally changed how day traders discover and capture opportunities. Instead of manually analyzing thousands of stocks, you can leverage real-time scanning technology to surface high-probability setups the moment they form, backed by backtest data that validates your edge.
The key is choosing a market scanner that aligns with your trading style, provides transparent performance data, and fits into your daily workflow. Whether you're executing rapid-fire scalps or building swing positions, the right scanning platform saves time, improves opportunity capture, and increases decision confidence.
For traders ready to move beyond manual chart analysis, ChartMath offers a mobile-first approach to market scanning with 200+ curated technical screens, transparent backtest data, and a TikTok-style discovery feed that makes finding high-quality setups as simple as swiping through your phone. You'll never miss a trade entry while away from your desk, and you'll trade with the confidence that comes from data-driven decision-making.
Ready to experience the future of market scanners? Download the ChartMath app and start discovering high-probability setups in real-time, or explore the web-based screener to see how 200+ technical screens can transform your trading workflow. Stop refreshing screeners manually and start letting proven market scanners do the heavy lifting for you.
Ankush Jindal
Co-Founder, ChartMath
Ankush Jindal is the Co-Founder of ChartMath, a real-time trade discovery platform that monitors 200+ technical screens across the market to surface actionable setups for technical traders. He holds a B.Tech in Computer Science from IIT Mandi. Before ChartMath, he co-founded two successful technology ventures spanning hundreds of thousands of users. This experience building data-intensive, real-time systems directly shaped his approach to technical analysis tooling. At ChartMath, Ankush leads product vision, designing intuitive interfaces that translate complex price action into clear, backtested signals. His philosophy: trading decisions should be backed by data, not gut feeling.
LinkedInSee these setups live in ChartMath
200+ curated screens with backtest data. Free to use.
Related Articles
Best Candlestick Pattern Screener: Complete Buyer's Guide 2026
Find the best candlestick pattern screener for your trading style. Compare features, pricing, and performance data to choose the right screening tool in 2026.
The Ultimate Trading Tools Stack for Data Driven Stock Trading in 2026
Discover the essential trading tools for data driven stock trading. From screeners to charting platforms, learn what you actually need in your stack.
Momentum Trading Software Buyer's Guide: 7 Must-Have Features
Discover the 7 essential features every momentum trading software needs in 2026. Compare platforms, avoid costly mistakes, and find the right tools.