The Ultimate Trading Tools Stack for Data Driven Stock Trading in 2026
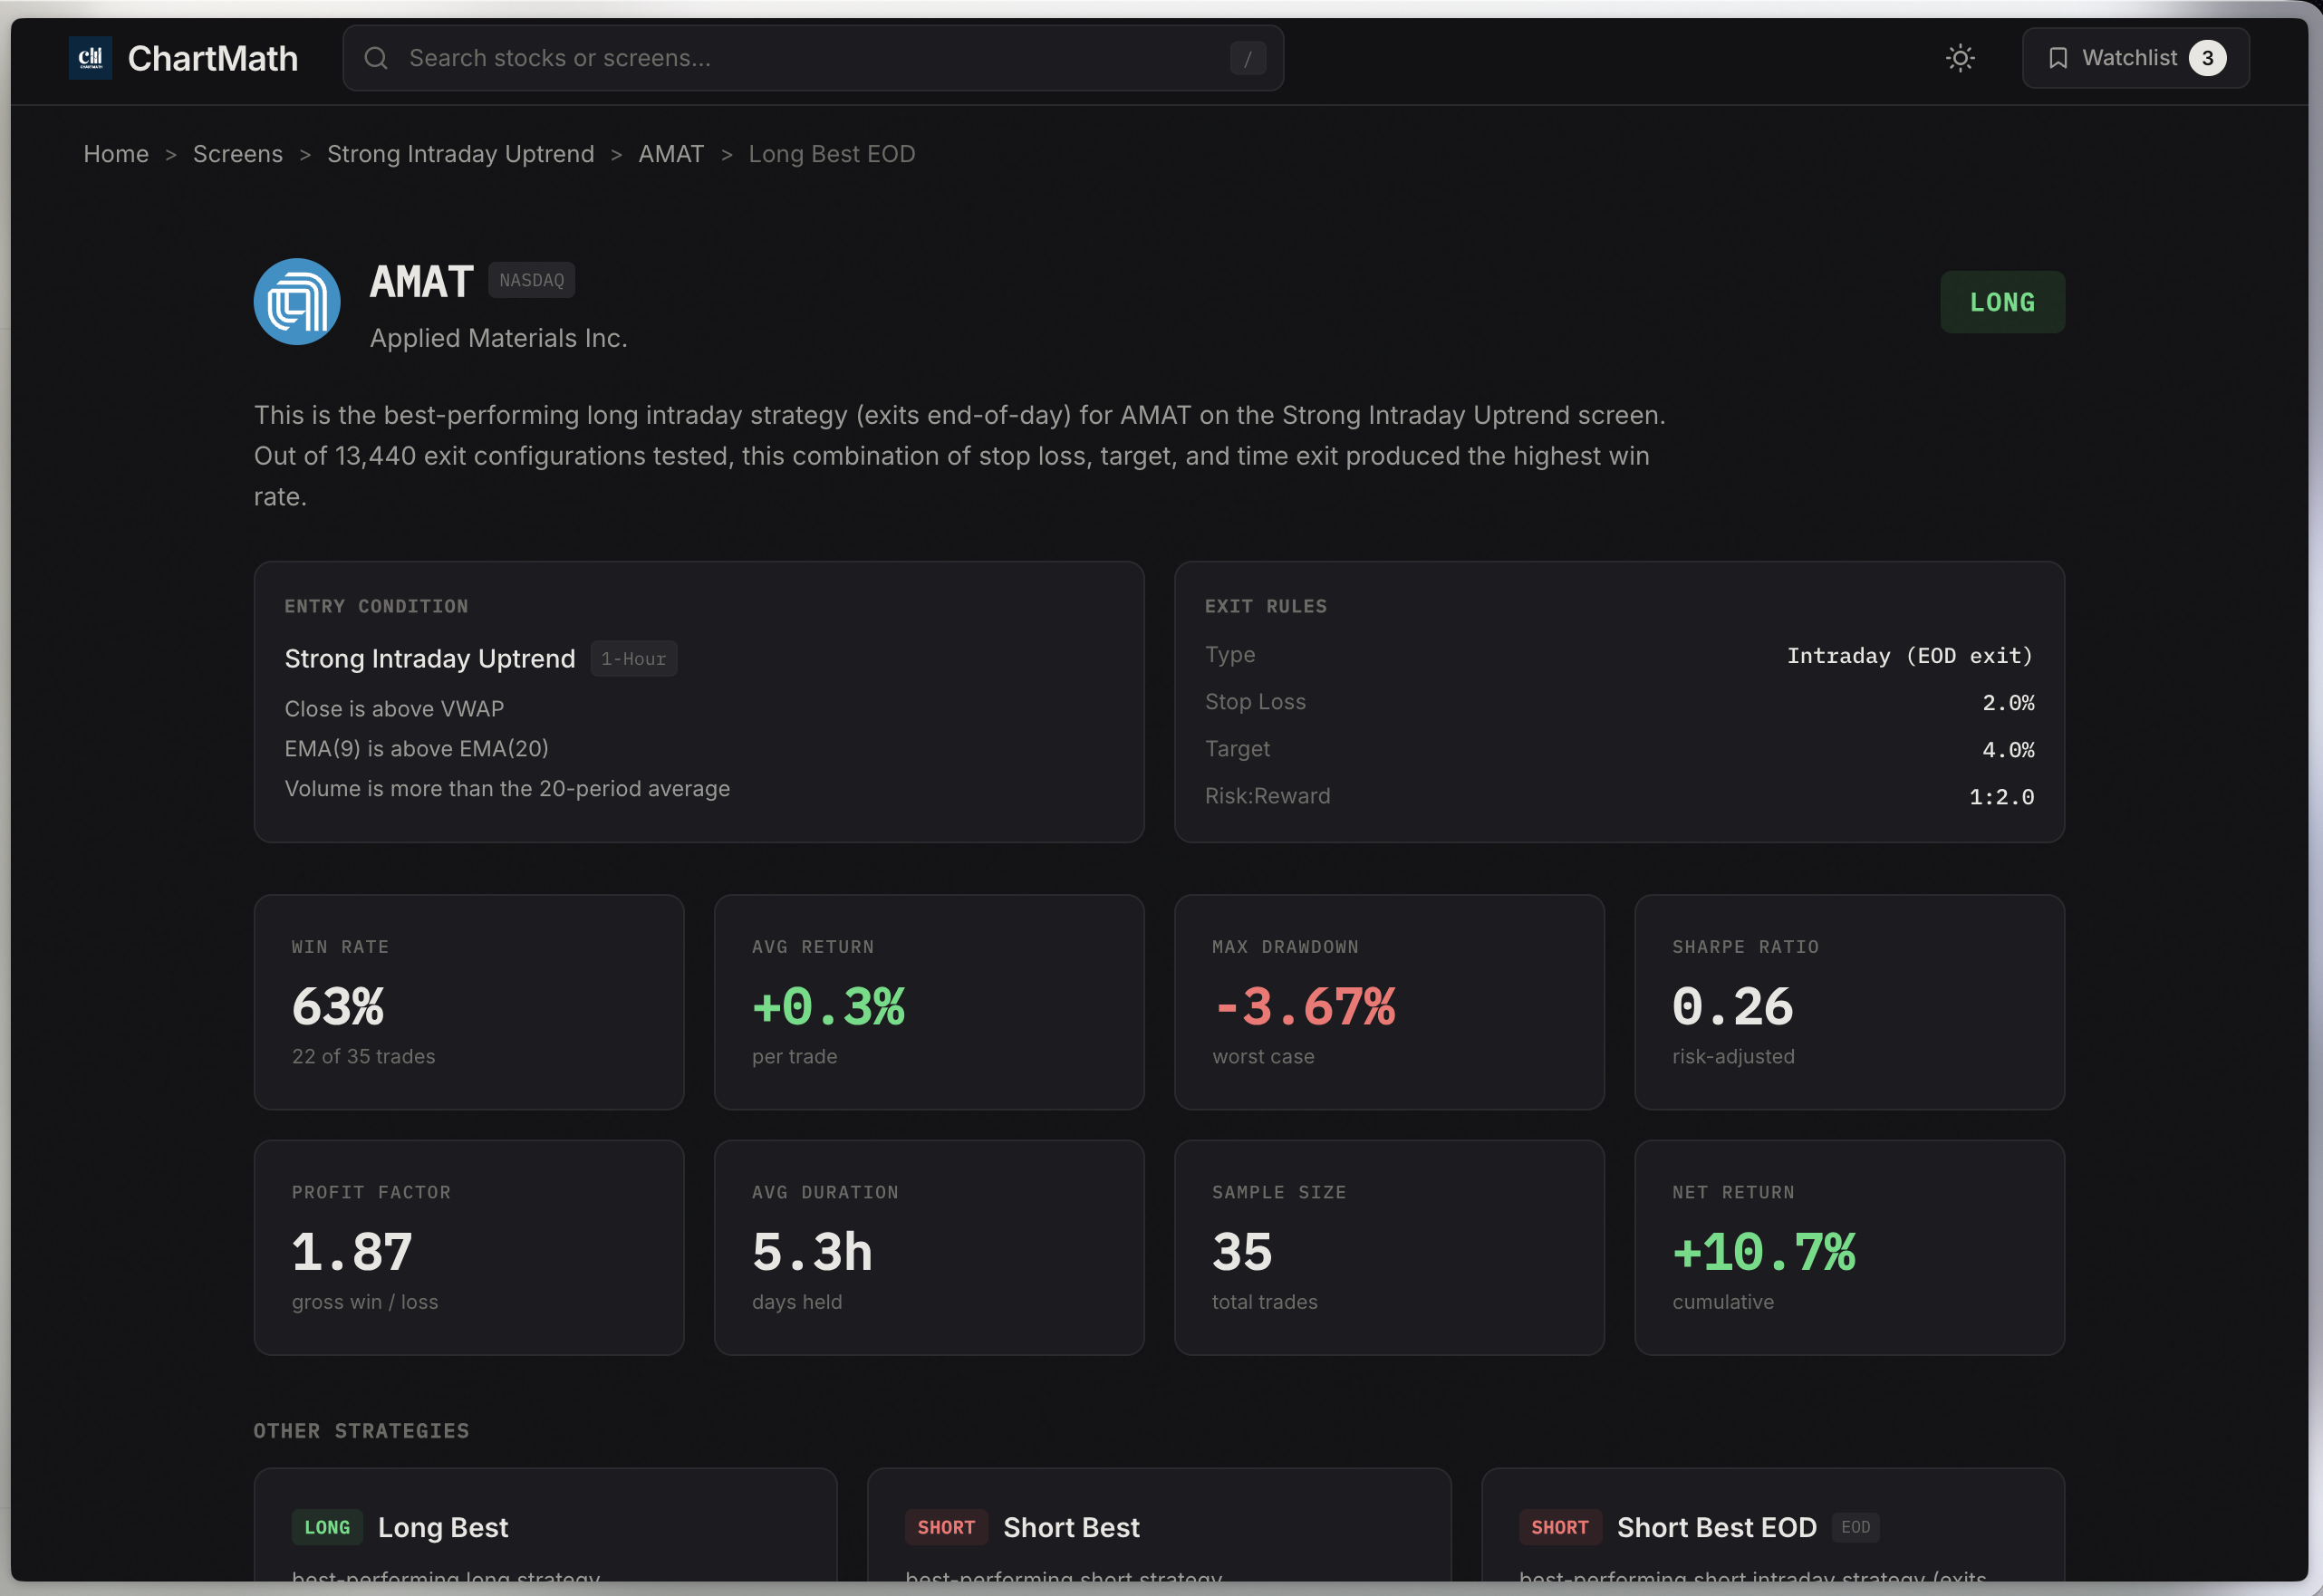
Table of Contents
You've got seventeen browser tabs open. TradingView on one screen, Finviz refreshing on another, three different Discord channels pinging you with "hot setups," and your phone buzzing with alerts that may or may not be worth your attention. Sound familiar?
The problem isn't that you lack information. It's that you're drowning in it. And somewhere between the noise and the FOMO, you're making trading decisions based on gut feel rather than actual data. That ends today.
Welcome to the ultimate guide for building a data driven stock trading stack that actually works in 2026. We're cutting through the marketing hype to show you exactly which tools you need, which ones are wastes of money, and how to configure your setup whether you're a day trader executing scalps or a swing trader with thirty minutes of chart time per day.
This isn't about collecting every shiny trading tool on the market. It's about building a lean, integrated system that helps you find high-probability setups, validate them with historical data, and execute with confidence. Let's get started.
What Makes a Trading Stack 'Data Driven' in 2026?
Let's be clear about what we mean by data driven stock trading. This isn't about having more indicators on your chart or subscribing to more alert services. It's about making every trading decision based on verifiable, backtested evidence rather than hunches, tips, or emotional reactions to price movement.
A truly data driven approach rests on three pillars:
- Backtested strategies: You know the historical win rate, average return, and maximum drawdown of every setup you trade. No guessing.
- Real-time data: You receive alerts when proven setups form, not hours later when the opportunity has passed.
- Performance tracking: You measure what works and what doesn't in your actual trading, then adjust accordingly.
The evolution from discretionary trading to data driven stock trading has accelerated dramatically. Ten years ago, backtesting required coding skills and expensive software. Today, the best platforms deliver backtested performance data alongside every alert, showing you exactly what edge you're trading.
Here's the problem most traders face: they either have too many tools that don't talk to each other, or they're missing critical components entirely. You might have excellent charting software but no systematic way to scan for setups. Or you get hundreds of alerts daily but have no idea which ones actually have positive expected value.
The goal of this guide is to help you build a stack where every tool serves a specific purpose, integrates smoothly with the others, and contributes to better, more profitable trading decisions backed by data.
The 5 Essential Tool Categories Every Technical Trader Needs
Before we dive deep into each category, let's establish the framework. Every complete trading stack needs these five components:
- Market Scanning & Stock Screeners: Your discovery engine that finds trading opportunities across thousands of stocks
- Charting Platforms: Where you conduct detailed technical analysis and confirm setups
- Alert Systems: Real-time notifications when your criteria are met, so you never miss entries
- Backtesting Tools: Validation systems that show historical performance of strategies before you risk capital
- Execution & Brokerage: Fast, reliable order entry with the routing and order types your strategy requires
Not every trader needs the most expensive option in each category. A swing trader working full-time doesn't need the same real-time scanning capabilities as a professional day trader. But every trader needs something in each category, even if it's a basic free tool to start.
The key is understanding which features are must-haves for your specific trading style versus nice-to-haves that sound impressive but won't improve your results. Let's break down each category.
1. Market Scanning & Stock Screeners: Your Discovery Engine
If you're serious about data driven stock trading, your stock screener is the foundation of everything else. This is where opportunities are discovered, before you ever open a chart or place a trade.
The problem? Most traders are using screeners designed for fundamental investors, not technical traders. They're filtering by P/E ratios and market cap when they should be scanning for breakout trading setups, VWAP reclaims, and relative volume spikes.

Here's what separates basic screeners from tools built for serious technical traders:
Real-time vs End-of-Day Scanning: If you're a day trader executing intraday trading strategies, you need real-time scanning. End-of-day data is useless when you're trying to catch an ORB (Opening Range Breakout) at 9:45 AM. Swing traders can often work with end-of-day scans, but even they benefit from real-time alerts when daily setups trigger.
Pre-built Screens vs Custom Filters: This is where most traders waste enormous amounts of time. Platforms like Finviz give you the building blocks to create custom screens, but you need to know exactly what you're looking for. You're essentially building strategies from scratch with no idea if they actually work.
The smarter approach in 2026? Start with platforms that provide pre-built, backtested screens for proven technical setups. You want to see screens for momentum trading patterns, VWAP crosses, relative volume breakouts, and chart pattern completions already configured and validated with historical data.
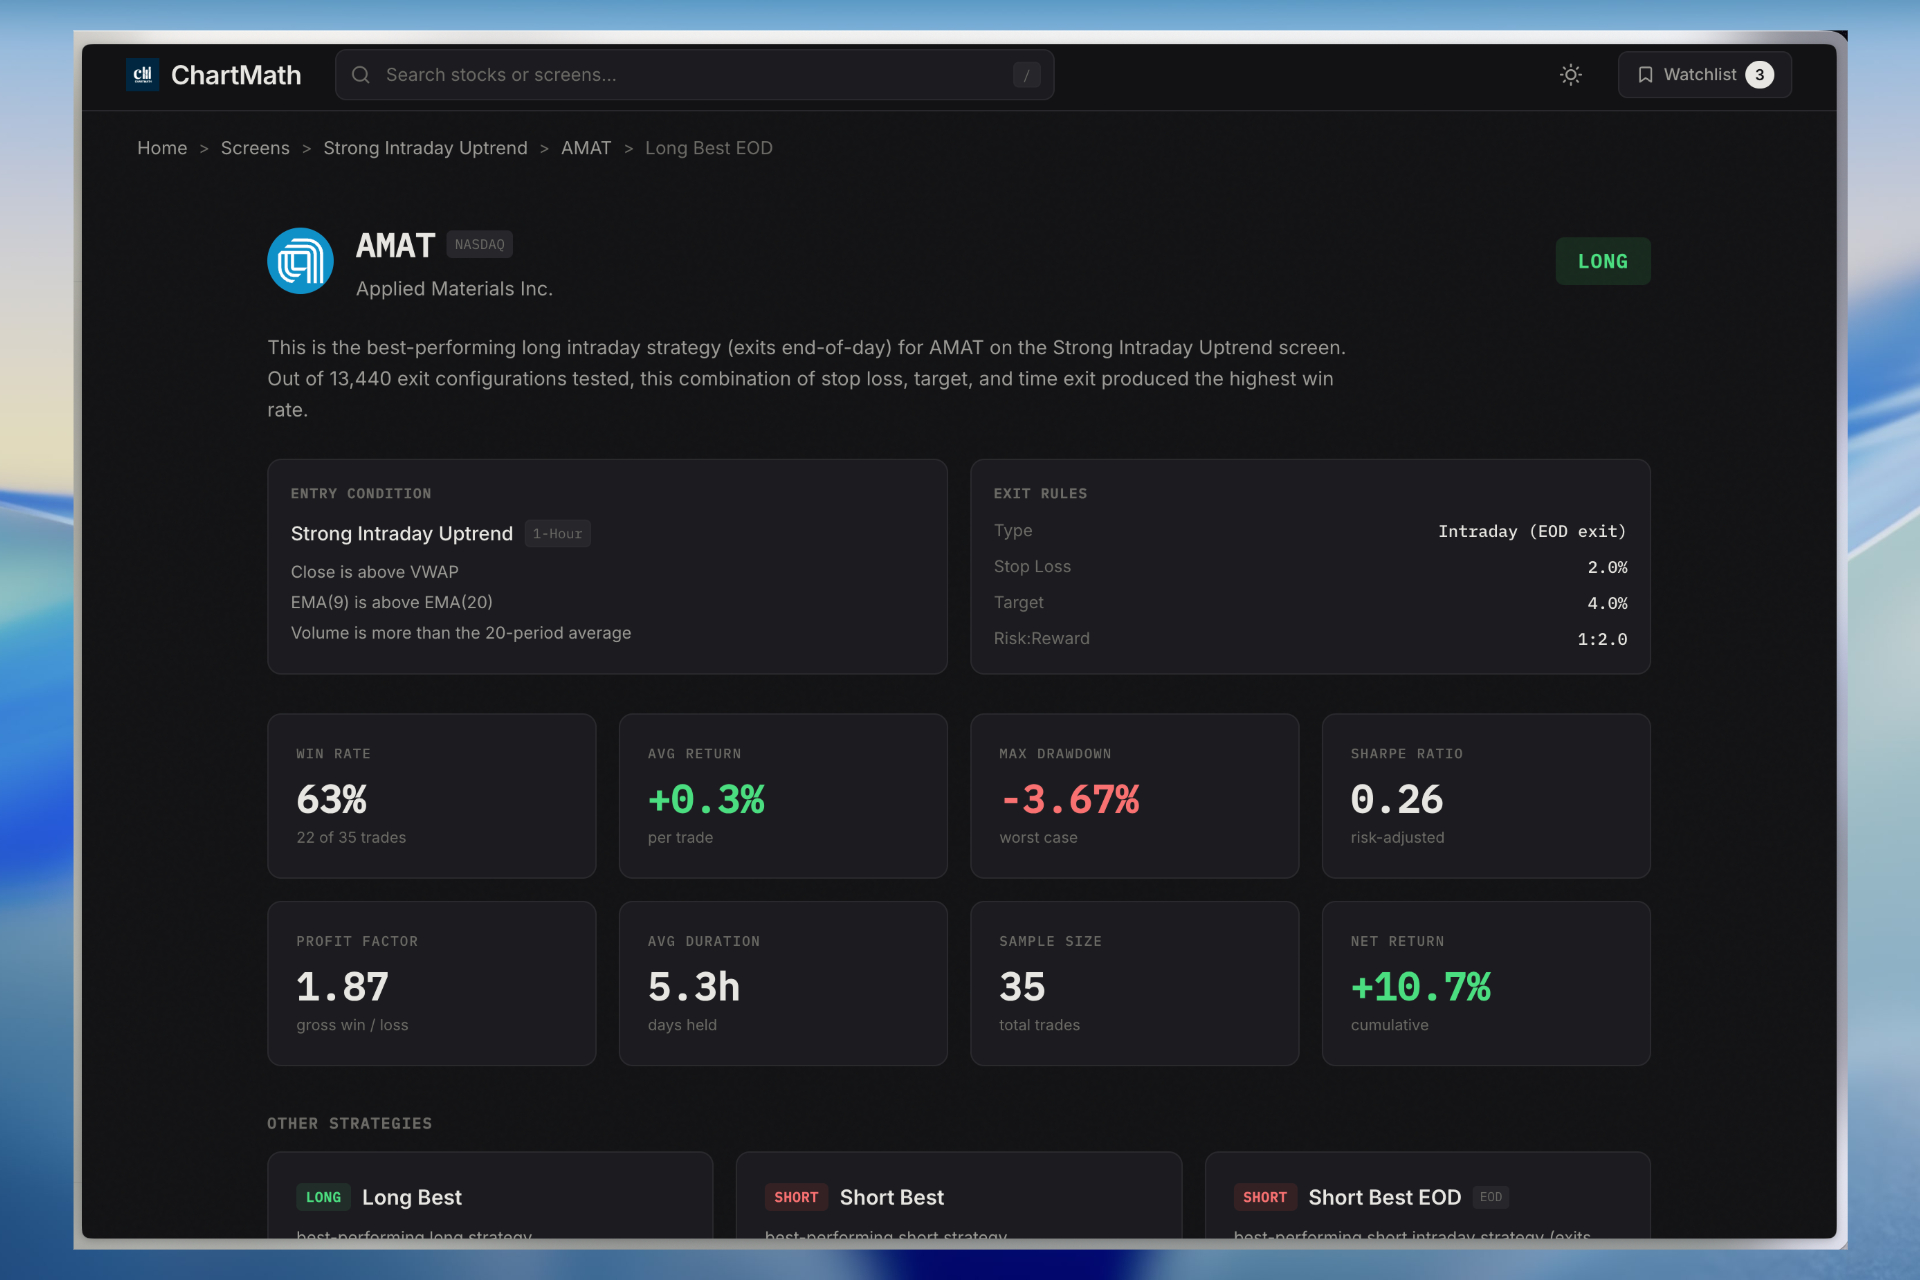
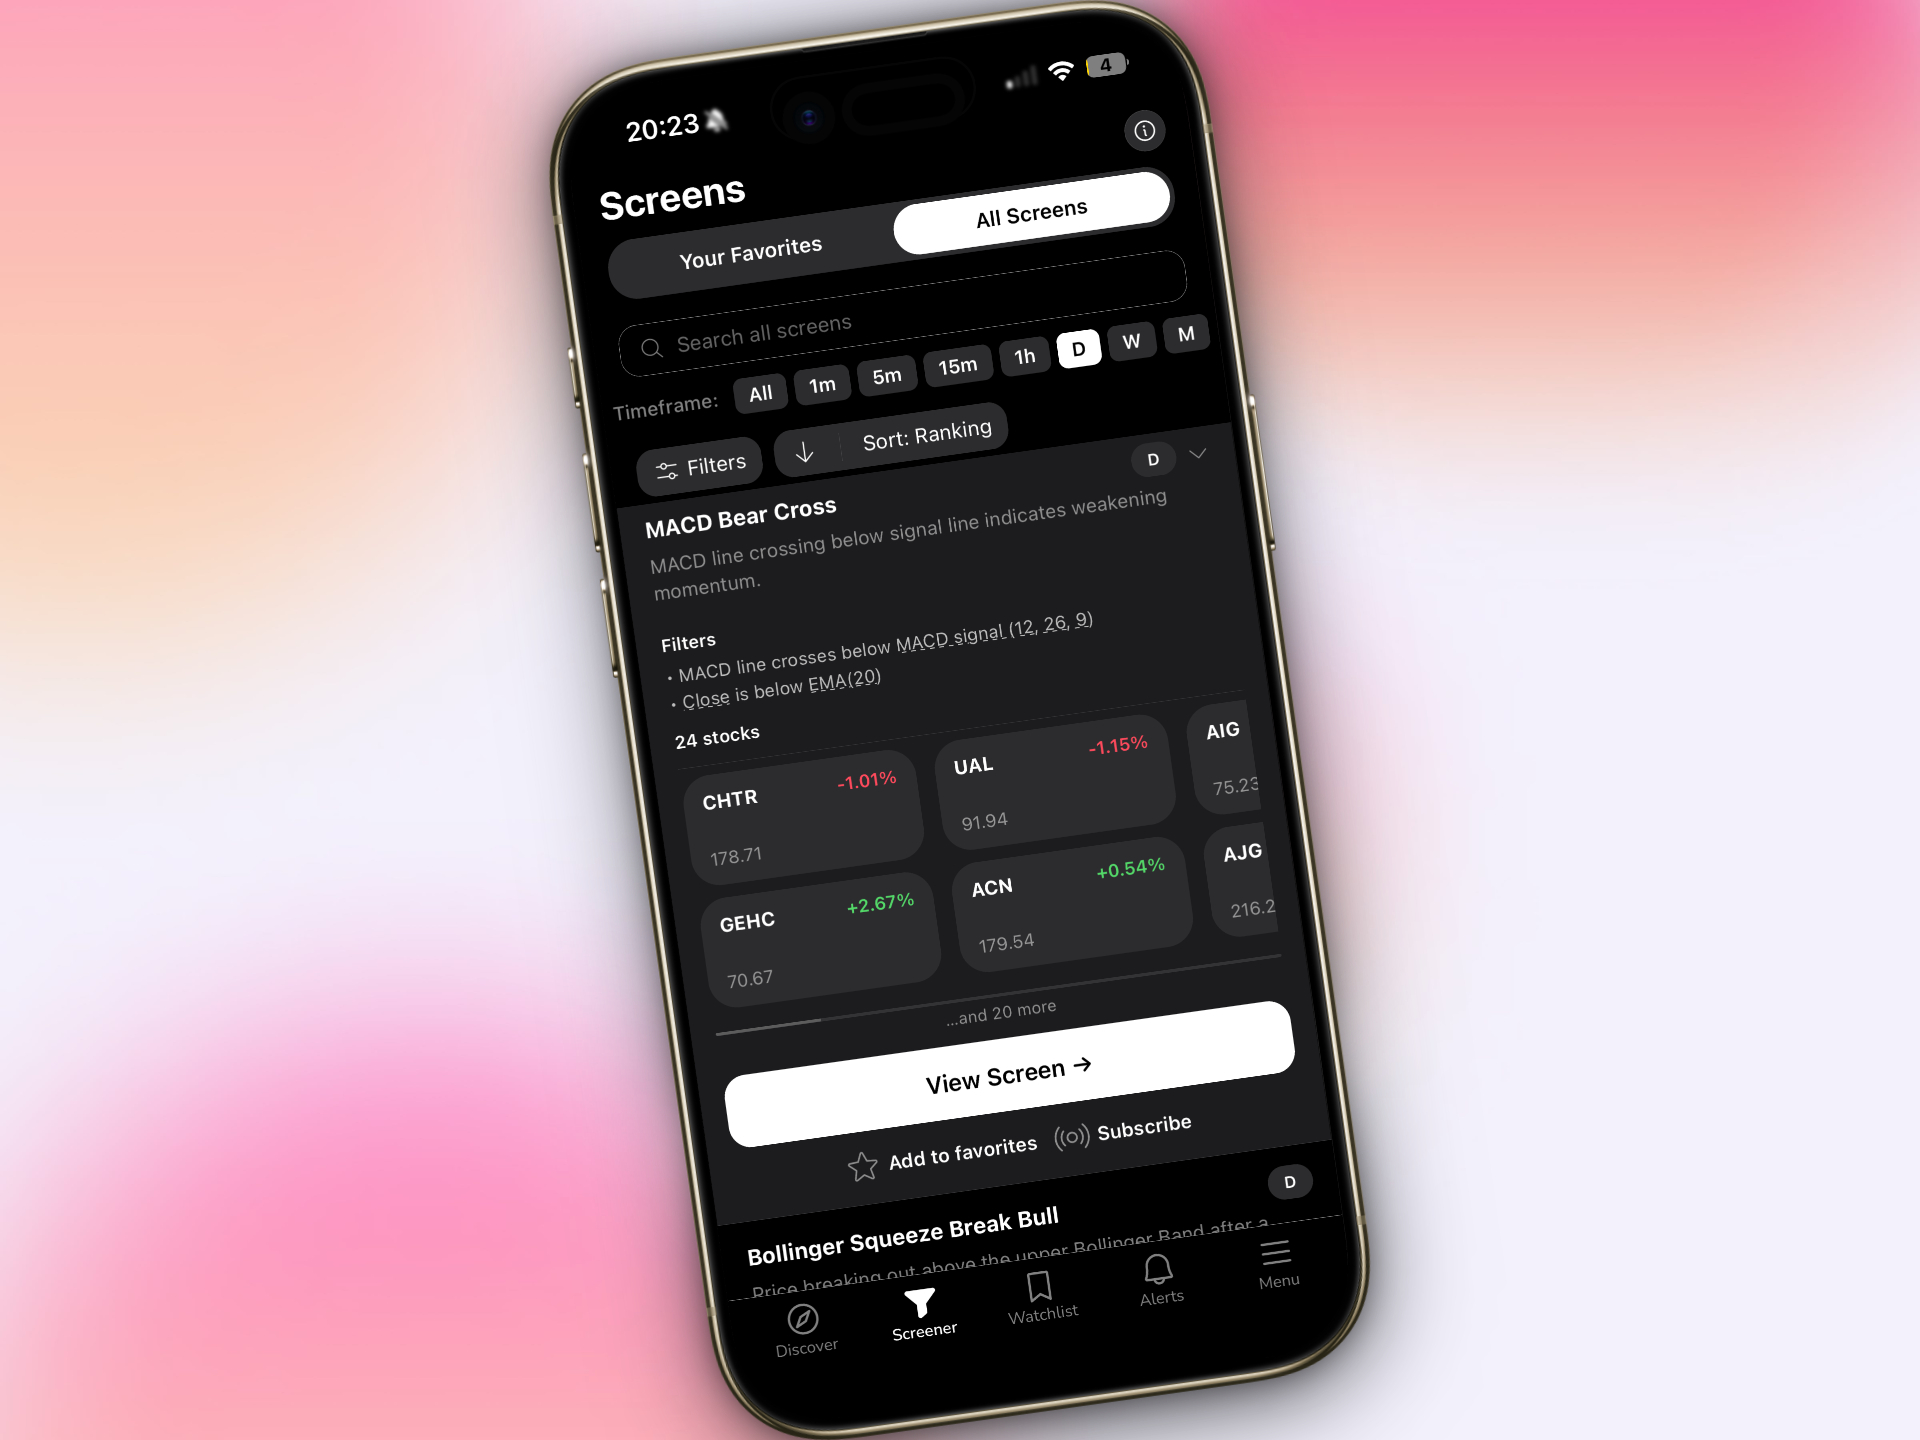
This is where a platform like ChartMath changes the game. Instead of spending hours building custom screens and wondering if they'll work, you get access to 200+ curated technical screens with backtested win rates and average returns already calculated. You can see that a particular ORB setup has a 64% win rate with an average return of 2.3% over the past year before you ever take the trade.
Key Features in Modern Stock Screeners
When evaluating stock screeners for your stack, here are the non-negotiables:
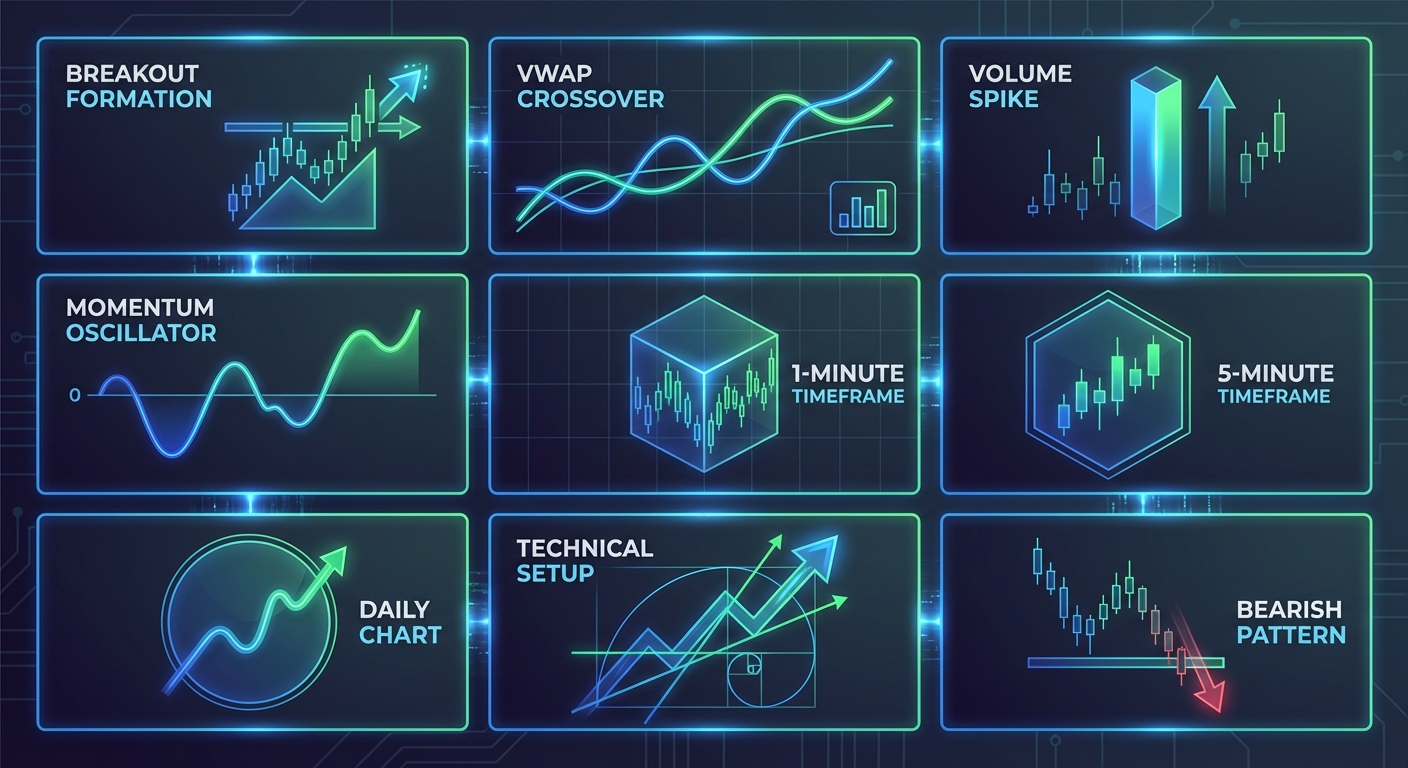
- Multi-timeframe analysis: You need to scan across 1-minute, 5-minute, 15-minute, hourly, daily, and weekly timeframes. Different strategies work on different timeframes, and the best setups often show confluence across multiple periods.
- Technical setup detection: Automated recognition of ORB, VWAP reclaims, RVOL spikes, breakouts, momentum indicators, and proven technical setups. You shouldn't have to manually check every stock.
- Historical performance data: This is the difference between guessing and knowing. Every screen should show backtested win rates, expected value per trade, and maximum drawdown statistics.
- Quality filtering: Not all alerts are created equal. The best screeners rank opportunities by quality and freshness, so you focus on A-grade setups instead of wading through noise.
- Mobile accessibility: Unless you're chained to a desk all day, you need mobile access. The market doesn't wait for you to get home to your desktop setup.
For day traders specifically, look for stock screeners designed for day trading that include premarket scanners and real-time intraday alerts. Missing a premarket gapper because your screener only updates at market open is leaving money on the table.
Budget consideration: Free screeners like Finviz are fine for learning, but they're limited to end-of-day data and lack backtesting integration. Expect to invest $30-100/month for professional-grade real-time scanning with performance data. ChartMath offers a free tier to get started, with premium features available as you scale.
2. Charting Platforms: Where Analysis Happens
Once your screener identifies potential setups, you need a charting platform to confirm the trade, identify entry and exit points, and manage positions. This is where you'll spend significant time, so choosing the right platform matters.
The good news? You probably don't need to spend as much as you think. The bad news? The learning curve on some platforms can eat weeks of your time.
Desktop vs Web vs Mobile: Traditional wisdom says serious traders need desktop software like TC2000 or Thinkorswim. That was true in 2015. In 2026, web-based platforms like TradingView offer nearly identical functionality with zero installation and cross-device syncing. Mobile charting has also matured significantly, though it's still best used as a companion rather than your primary analysis tool.
For most technical traders, TradingView hits the sweet spot. The free version covers basic charting needs. The Pro version ($15/month) adds multiple charts, more indicators, and custom timeframes. Pro+ and Premium ($30-60/month) are overkill unless you're running complex multi-indicator strategies or need extensive historical data.
Essential charting features include:
- Clean candlestick charts with customizable timeframes
- Core technical indicators (moving averages, RSI, MACD, Bollinger Bands, VWAP)
- Drawing tools for trendlines, support/resistance, and pattern recognition
- Multi-chart layouts to monitor multiple stocks or timeframes simultaneously
- Alert creation directly from chart levels
Here's what you probably don't need: 400 exotic indicators, AI pattern recognition that costs $100/month extra, or integrated news feeds that distract you from price action. Keep it simple. The best traders use the same basic tools everyone has access to; they just use them better.
Integration matters: Your charting platform should work seamlessly with your screener and broker. If your screener alerts you to a VWAP reclaim on ticker XYZ, you should be able to pull up that chart in seconds, not fumble through multiple logins and manual symbol entry. Look for platforms that offer API access or direct integrations with your other tools.
One often-overlooked consideration: ChartMath is designed as a mobile-first companion to your existing charting platform, not a replacement. You still use TradingView or your broker's charts for detailed analysis. ChartMath handles the discovery and alerting, delivering setups to your phone with context about why they triggered and what the historical edge is. Then you confirm on your charts and execute through your broker. This division of labor is more efficient than trying to do everything in one tool.
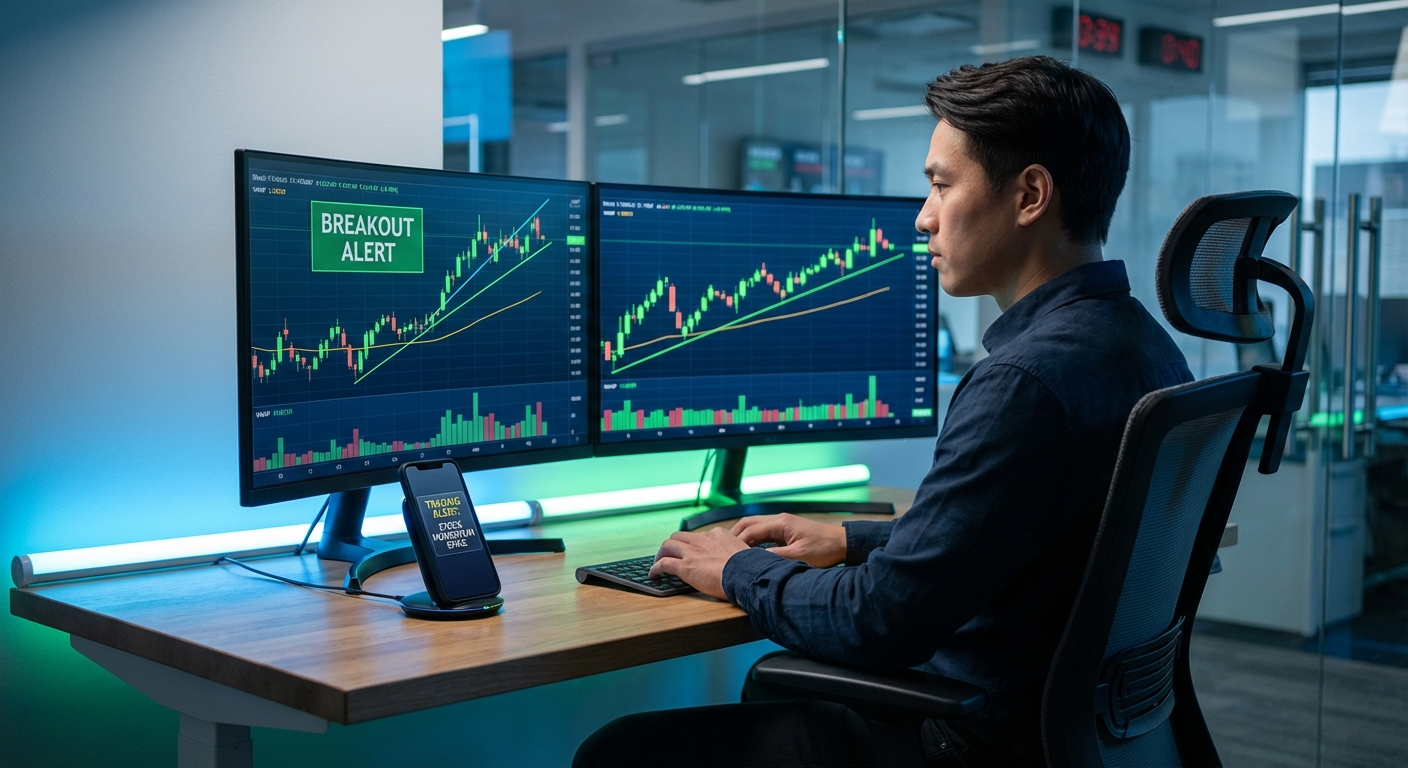
3. Alert Systems: Never Miss Another Setup
You can't watch every stock on every timeframe all day. That's why trading alerts are critical. But here's the problem: most alert systems create more problems than they solve.
Alert fatigue is real. When you're getting 50+ notifications per day and 90% of them are garbage, you start ignoring all of them. Then you miss the one setup that would have been a 5% winner.
The solution isn't fewer alerts. It's better alerts. Here's what that means:
Context-rich notifications: A simple "XYZ crossed above $50" alert is useless. You need to know why that matters. Is it breaking out of a consolidation? Reclaiming VWAP with volume? Hitting a key Fibonacci level? The best alert systems provide plain-English explanations of what triggered and what the setup is.
Quality filtering: Not every VWAP cross is worth trading. The best platforms rank alerts by quality based on multiple confirming factors. You want to know if this is an A-grade setup with strong volume and clean price action, or a C-grade marginal signal you should probably skip.
Customization without complexity: You should be able to set alerts for your watchlist stocks and preferred strategies without learning a programming language. If you're interested in VWAP trading setups on 5-minute charts, configuring that should take seconds, not hours of Pine Script coding.
Mobile-first delivery: Email alerts are too slow. Desktop notifications only work if you're at your computer. Push notifications to your phone are the standard in 2026. You should be able to review and act on setups from anywhere.
ChartMath's approach to alerts solves the fatigue problem by combining quality filtering with backtested performance data. Every alert shows you the historical win rate and average return for that specific setup type. You're not guessing whether it's worth your attention; you can see that this particular pattern has worked 67% of the time historically. That's data driven stock trading in action.
For more on integrating alerts into your workflow, check out our guide on how to integrate trading alerts with your charting platform.
4. Backtesting Tools: Validate Before You Trade
This is where most traders fail. They find a setup that "looks good," take the trade, and hope for the best. That's not data driven stock trading. That's gambling with extra steps.
Backtesting answers the only question that matters: Does this setup actually have a positive expected value over a meaningful sample size?
Here's what you need to know about backtesting in 2026:
Strategy backtesting vs setup validation: These are different things. Strategy backtesting (like you'd do in platforms like Amibroker or TradeStation) tests complete trading systems with entry rules, exit rules, position sizing, and risk management over years of data. That's valuable but complex.
Setup validation is simpler and more immediately useful. It answers: "When this specific pattern forms, what happens next?" For example, when a stock breaks above its opening range in the first 30 minutes with 2x average volume, what's the win rate if you exit at the close? What's the average return? What's the worst drawdown?
Most traders need setup validation more than full strategy backtesting, especially when starting out. You want to know if the technical setups you're trading actually work before you build complex systems around them.
Understanding the metrics: When evaluating backtested data, focus on these key numbers:
- Win rate: Percentage of trades that were profitable. Above 50% is good for most setups, but it's not the only metric that matters.
- Average return: The mean profit/loss per trade. A 45% win rate with an average return of +2% can be more profitable than a 60% win rate with +0.5% average return.
- Expected value (EV): The amount you can expect to make per trade on average. This combines win rate and average return. Positive EV is the only thing that matters long-term.
- Maximum drawdown: The largest peak-to-trough decline. This tells you how much pain you'll endure during losing streaks.
- Sample size: How many historical occurrences were tested. 500+ samples is meaningful. 20 samples is noise.
The challenge? Most backtesting tools require significant technical skill. Platforms like QuantConnect and Backtrader are powerful but demand Python knowledge. TradingView's Strategy Tester requires Pine Script coding.
This is another area where ChartMath differentiates itself. Every one of the 200+ technical screens comes with pre-calculated backtesting data. You don't need to code anything or run your own tests. The platform shows you the historical win rate, average return, and sample size for each setup type across multiple exit strategies (same-day close, next-day open, 2% target, etc.).
For traders who want to build custom backtesting strategies, we have a complete guide that walks through the process step-by-step.
Avoiding overfitting: One warning about backtesting: it's easy to create strategies that worked perfectly in the past but fail in live trading. This happens when you over-optimize, adding so many filters and conditions that you're fitting the strategy to historical noise rather than genuine market patterns.
The solution? Keep strategies simple, use large sample sizes, test across multiple time periods and market conditions, and always validate with out-of-sample data. If a setup only worked during the 2020-2021 bull market, it's not a robust edge.
5. Execution & Brokerage Platforms
You've found a great setup, confirmed it on your charts, and validated it has positive expected value. Now you need to actually execute the trade. This is where your broker comes in.
For technical traders, broker selection comes down to a few key factors:
Speed and reliability: If you're day trading, execution speed matters. The difference between getting filled at your intended price versus slipping 10 cents can be the difference between profit and loss on a scalp trade. Look for brokers with direct market access and quality routing.
Order types: You need more than just market and limit orders. Stop-loss orders, stop-limit orders, trailing stops, and bracket orders are essential for risk management. Some advanced traders also use conditional orders and OCO (one-cancels-other) setups.
Commission structure: Zero-commission trading has become standard for stocks, but watch for other fees. Pattern day trader restrictions, data fees, platform fees, and options commissions can add up. Calculate the total cost based on your actual trading volume.
Platform integration: Some brokers offer excellent standalone platforms (Thinkorswim from TD Ameritrade, TradeStation, Interactive Brokers TWS) while others have basic execution interfaces and expect you to use third-party charting. Neither is wrong; it depends on your workflow.
Popular choices for technical traders in 2026:
- TD Ameritrade (Thinkorswim): Excellent platform, good for beginners and intermediates, zero commissions on stocks
- Interactive Brokers: Best for active traders, lowest margin rates, professional-grade tools, steeper learning curve
- TradeStation: Built for active traders, excellent charting and backtesting, but monthly fees unless you hit volume thresholds
- Webull/Robinhood: Simple interfaces, zero fees, good for small accounts, but limited tools and order types
The key is choosing a broker that matches your trading style and integrates well with your analysis tools. Your broker doesn't need to do everything; it needs to execute trades reliably when your system gives you a signal.
Building Your Stack: Day Trader vs Swing Trader Configurations
Now that we've covered the five essential categories, let's talk about how to configure your stack based on your actual trading style. A day trader and a swing trader need very different tools.
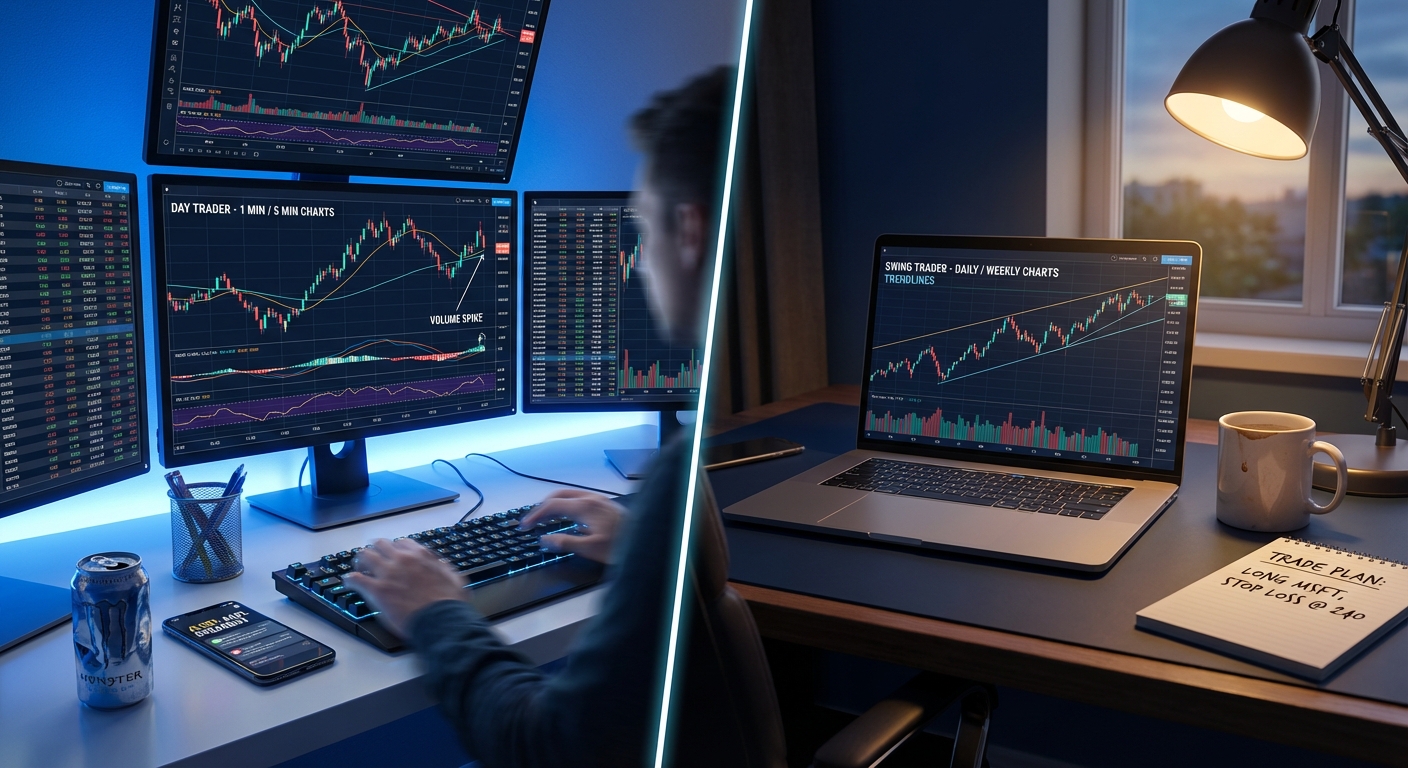
Day Trader Stack (Real-Time Focus):
- Screener: Real-time scanning with premarket scanner, intraday alerts on 1m-15m timeframes, RVOL and momentum filters. ChartMath's mobile app for on-the-go discovery.
- Charting: TradingView Pro for multi-chart layouts, or broker-provided platform like Thinkorswim
- Alerts: Push notifications to mobile for instant awareness of setups forming
- Backtesting: Integrated with screener to validate intraday setups before trading them
- Execution: Fast broker with direct market access (Interactive Brokers, TradeStation, or TD Ameritrade)
- Budget: $50-150/month for tools plus broker costs
Day traders need speed and real-time data. You're making multiple decisions per day, often within minutes of setups forming. Your stack should minimize friction between discovery and execution. For more on optimizing this workflow, see our guide on building an efficient trading workflow.
Swing Trader Stack (End-of-Day Focus):
- Screener: End-of-day scans on daily/weekly timeframes, focus on breakout and momentum setups. ChartMath for curated daily signals with backtested performance.
- Charting: TradingView free or basic broker charts are often sufficient
- Alerts: Daily digest of new setups, alerts when watchlist stocks trigger entry conditions
- Backtesting: Historical performance data for multi-day hold strategies
- Execution: Any reliable broker with good mobile app for position management
- Budget: $20-60/month for tools plus broker costs
Swing traders have the luxury of time. You're not racing to catch 5-minute breakouts. You can review setups in the evening, plan trades for the next day, and execute during market hours without needing to be glued to screens. This style works well for professionals with full-time jobs, as covered in our swing trading guide for busy professionals.
Beginner Stack (Learning Focus):
- Screener: Platform with pre-built, backtested screens and educational explanations (ChartMath free tier)
- Charting: TradingView free version
- Alerts: Basic alerts from screener, focus on understanding why setups trigger
- Backtesting: Use platforms that show historical performance data without requiring coding
- Execution: Zero-commission broker with paper trading (TD Ameritrade, Webull)
- Budget: $0-30/month while learning, scale up as you prove profitability
If you're new to technical trading, resist the urge to buy every tool immediately. Start with free or low-cost options, focus on learning one or two proven setups, and upgrade your stack as your skills and account size grow. The platform should teach you why setups work, not just alert you when they form.
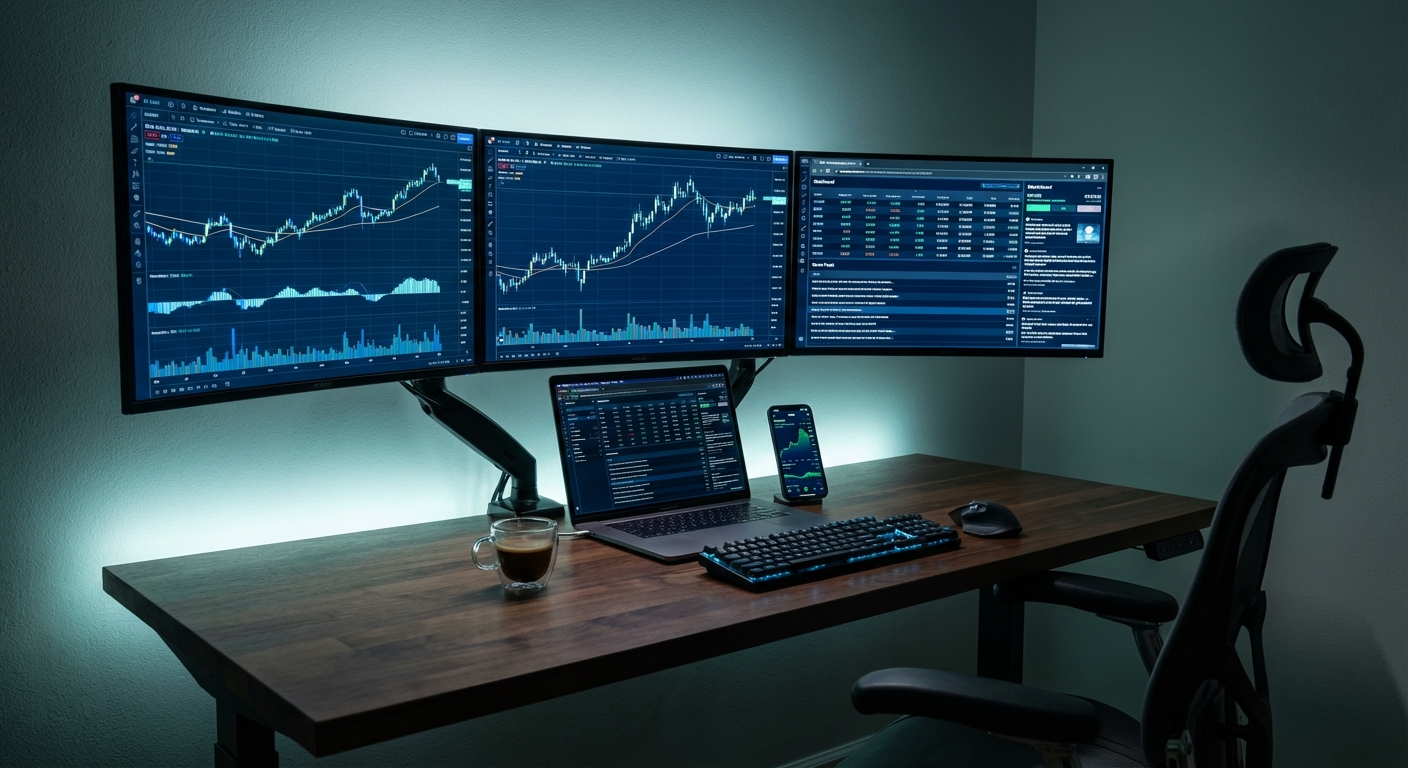
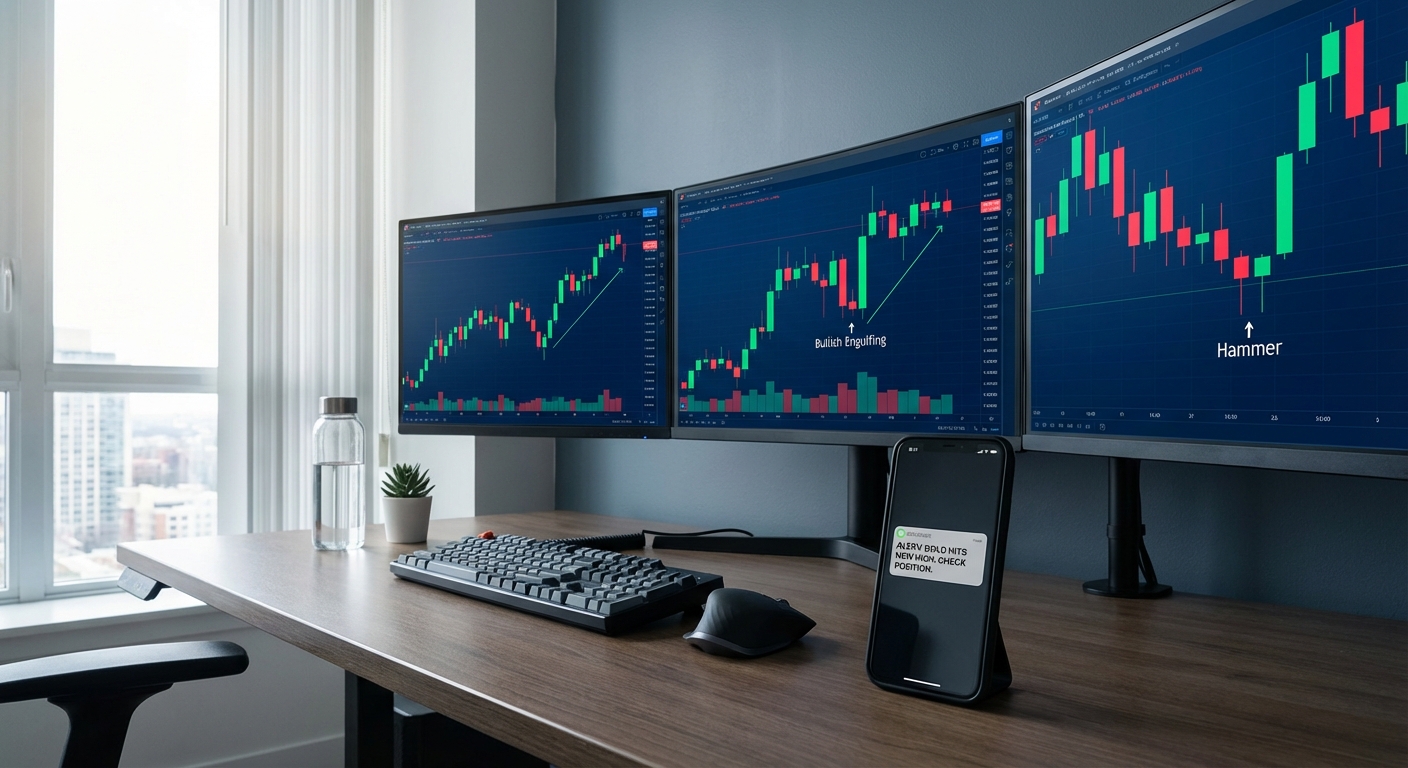
The Mobile-First Revolution in Trading Tools
Let's address the elephant in the room: can you really trade from your phone?
The answer is nuanced. Can you do deep technical analysis on a 6-inch screen? Probably not as effectively as on a 27-inch monitor. But can you monitor positions, receive high-quality alerts, and execute trades from your phone? Absolutely.
The reality of trading in 2026 is that most of us aren't sitting at a desktop all day. We're in meetings, commuting, traveling, or simply living our lives. The market doesn't care. Opportunities form whether you're at your desk or not.
This is why mobile-first platforms have become essential. Not as replacements for desktop analysis, but as companions that keep you connected to the market when you're away from your primary setup.
What mobile trading tools should provide:
- Real-time push notifications when setups form on your watchlist
- Quick-view charts to confirm setups without opening a laptop
- One-tap access to detailed information about why an alert triggered
- Ability to execute trades or adjust stops on the go
- Swipe-based interfaces for quickly reviewing multiple opportunities
ChartMath was built mobile-first specifically to solve this problem. The TikTok-style swipe interface lets you quickly review ranked setups, see the backtested performance data, and decide whether to act. You're not trying to do complex analysis on your phone; you're triaging opportunities and executing on proven setups that the platform has already validated.
For detailed chart work, you still use TradingView or your broker's platform. But for discovery, alerting, and quick decision-making, mobile is now the primary interface for many successful traders.
Common Mistakes When Building Your Trading Stack
Before we wrap up, let's talk about the mistakes that cost traders thousands in wasted subscriptions and missed opportunities:
Mistake #1: Tool Overload
You don't need seven different screeners, four charting platforms, and twelve alert services. Every additional tool adds complexity, costs money, and creates decision paralysis. Build a lean stack with one excellent option in each category, master those tools, then consider additions only if there's a clear gap.
Mistake #2: Ignoring Backtested Performance
Trading setups that "look good" without validating them with historical data is the fastest way to blow up an account. If a platform can't show you backtested win rates and expected value, you're flying blind. This is non-negotiable for data driven stock trading.
Mistake #3: Poor Integration
Your screener alerts you on one platform, you chart on another, you execute on a third, and nothing talks to each other. Every manual step between discovery and execution is an opportunity for delay, error, or missed trades. Look for tools that integrate or at least work smoothly together.
Mistake #4: Paying for Features You Don't Use
That $200/month professional platform with AI pattern recognition and 500 custom indicators sounds impressive. But if you're a swing trader who uses three basic setups, you're wasting money. Match your tools to your actual trading style, not your aspirational one.
Mistake #5: Wrong Tools for Your Style
Day traders using end-of-day screeners. Swing traders paying for tick-level data. Beginners using platforms designed for quantitative developers. Know your trading style and choose tools built for that approach. If you're still figuring out whether you're a day trader or swing trader, start there before investing in tools.
How to Evaluate Trading Tools: A Data Driven Approach
When you're considering adding a new tool to your stack, approach it like you would a trade: with data and a clear hypothesis.
Use trial periods strategically: Most platforms offer 7-30 day trials or free tiers. Actually use them. Don't just sign up and forget about it. Spend the trial period testing whether the tool solves a real problem in your workflow. Track specific metrics: Does it save you time? Does it find setups you were missing? Does it improve your win rate?
Questions to ask vendors:
- What data sources do you use, and how frequently is data updated?
- How are backtests calculated? What assumptions are made about fills and slippage?
- Can I export data or integrate with other tools via API?
- What's included in each pricing tier, and what are the upgrade costs?
- Is there a community or support system for learning the platform?
Check community feedback: Look for reviews from actual traders, not marketing testimonials. Reddit's r/Daytrading and r/SwingTrading, Twitter trading communities, and Discord groups often have honest discussions about what works and what doesn't.
Calculate ROI: Will this tool make you money or save you time? If a screener costs $50/month but helps you find two additional profitable trades per month averaging $100 profit each, that's a 4x return. If it just duplicates what you're already doing, it's waste.
Test integration: Before committing, verify the tool works with your existing stack. Can you easily move from an alert to your charting platform? Does it export watchlists in a format your broker accepts? Small friction points become major annoyances when you're trading daily.
Putting It All Together: Your 2026 Trading Stack Blueprint
Let's bring this home with a concrete recommendation for technical traders serious about data driven stock trading in 2026.
The Recommended Stack:
Discovery & Screening: ChartMath for real-time scanning of 200+ backtested technical setups with mobile alerts and performance data. This handles your market scanning, alert system, and backtesting validation in one integrated platform. Start with the free tier to test the workflow, upgrade to premium as you scale.
Charting & Analysis: TradingView Pro ($15/month) for detailed chart analysis, drawing tools, and multi-chart layouts. This is where you confirm setups that ChartMath discovers and plan your entries and exits.
Execution: TD Ameritrade with Thinkorswim (free with account) for reliable execution, good mobile app, and solid customer service. Or Interactive Brokers if you're a more active trader needing lower costs and faster fills.
Total monthly cost: $15-45 depending on ChartMath tier, plus broker costs (typically zero for stock commissions).
This stack gives you everything you need: real-time discovery of proven setups with backtested data, professional charting for confirmation, and reliable execution. More importantly, these tools integrate smoothly. ChartMath alerts you to a setup on your phone, you confirm on TradingView, you execute through your broker. Clean workflow, minimal friction.
How ChartMath Fits Your Workflow:
Think of ChartMath as the intelligence layer of your trading stack. It's constantly scanning the market for the technical setups you care about across all timeframes. When a high-quality setup forms, you get a push notification with context: what triggered, what the setup is, and what the historical performance looks like.
You're not getting 100 random alerts per day. You're getting ranked, filtered opportunities with data attached. You can quickly swipe through them on your phone, see which ones have the best historical edge, and decide which are worth deeper analysis on your charts.
For swing traders, this means spending 30 minutes each evening reviewing the day's setups and planning tomorrow's trades instead of manually scanning hundreds of charts. For day traders, it means staying connected to breakout opportunities even when you step away from your desk.
The platform doesn't replace your charting or execution tools. It makes them more effective by ensuring you're only analyzing and trading setups that have proven edges.
Next Steps:
Building a data driven trading stack isn't about buying every tool on the market. It's about assembling a lean, integrated system that helps you find high-probability setups, validate them with data, and execute with confidence.
Start by auditing your current tools. What's actually helping you make better trades? What's just costing money and adding noise? Cut the dead weight.
Then fill the gaps. If you're missing real-time scanning with backtested data, that's your priority. If you have great discovery but poor charting, upgrade there. Build systematically, test thoroughly, and measure results.
Most importantly, remember that tools are just tools. The best trading stack in the world won't make you profitable if you don't have a sound strategy and disciplined risk management. But the right tools, used properly, can give you a significant edge in finding and executing high-probability setups.
Ready to build your data driven stock trading stack? Watch a demo of how ChartMath's 200+ backtested screens and mobile-first interface can transform your trade discovery process. Or download the app and start exploring proven technical setups with real performance data today. See how data driven stock trading actually works when you have the right tools backing every decision.
The market rewards preparation, not guesswork. Build your stack with data, trade with confidence, and let the numbers guide your decisions. That's how you win in 2026.
Ankush Jindal
Co-Founder, ChartMath
Ankush Jindal is the Co-Founder of ChartMath, a real-time trade discovery platform that monitors 200+ technical screens across the market to surface actionable setups for technical traders. He holds a B.Tech in Computer Science from IIT Mandi. Before ChartMath, he co-founded two successful technology ventures spanning hundreds of thousands of users. This experience building data-intensive, real-time systems directly shaped his approach to technical analysis tooling. At ChartMath, Ankush leads product vision, designing intuitive interfaces that translate complex price action into clear, backtested signals. His philosophy: trading decisions should be backed by data, not gut feeling.
LinkedInSee these setups live in ChartMath
200+ curated screens with backtest data. Free to use.
Related Articles
Market Scanners for Day Trading: Ultimate 2026 Guide
Discover how market scanners help day traders find high-probability setups in real-time. Learn to filter thousands of stocks for ORB, VWAP, and momentum breakouts.
Best Candlestick Pattern Screener: Complete Buyer's Guide 2026
Find the best candlestick pattern screener for your trading style. Compare features, pricing, and performance data to choose the right screening tool in 2026.
Momentum Trading Software Buyer's Guide: 7 Must-Have Features
Discover the 7 essential features every momentum trading software needs in 2026. Compare platforms, avoid costly mistakes, and find the right tools.