Best Candlestick Pattern Screener: Complete Buyer's Guide 2026
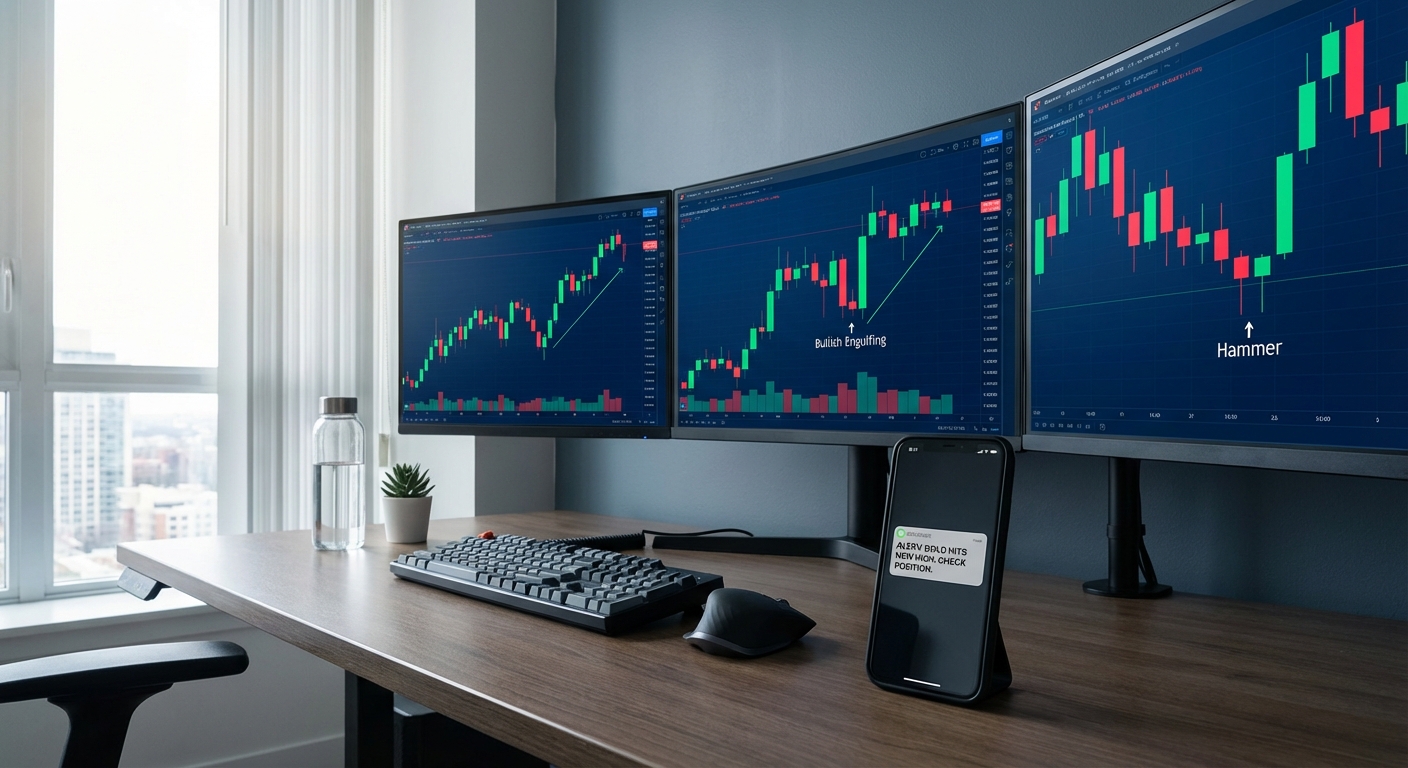
Table of Contents
You've spotted a perfect hammer candlestick forming on a stock you've been watching. By the time you manually scan through your watchlist to find the next setup, the opportunity is gone. Sound familiar? This is exactly why thousands of technical traders are turning to candlestick pattern screeners to automate the discovery process and catch setups in real-time.
A candlestick pattern screener is specialized software that continuously monitors the market and alerts you when specific candlestick formations appear across hundreds or thousands of stocks. Instead of manually flipping through charts for hours, these tools do the heavy lifting while you focus on execution and risk management.
In this comprehensive buyer's guide, we'll walk you through everything you need to know to choose the best candlestick pattern screener for your trading style in 2026. Whether you're a day trader hunting for intraday reversals or a swing trader looking for multi-day breakout patterns, this guide will help you evaluate features, compare platforms, and make an informed decision that fits your workflow and budget.
What Is a Candlestick Pattern Screener and Why Do Traders Need One?
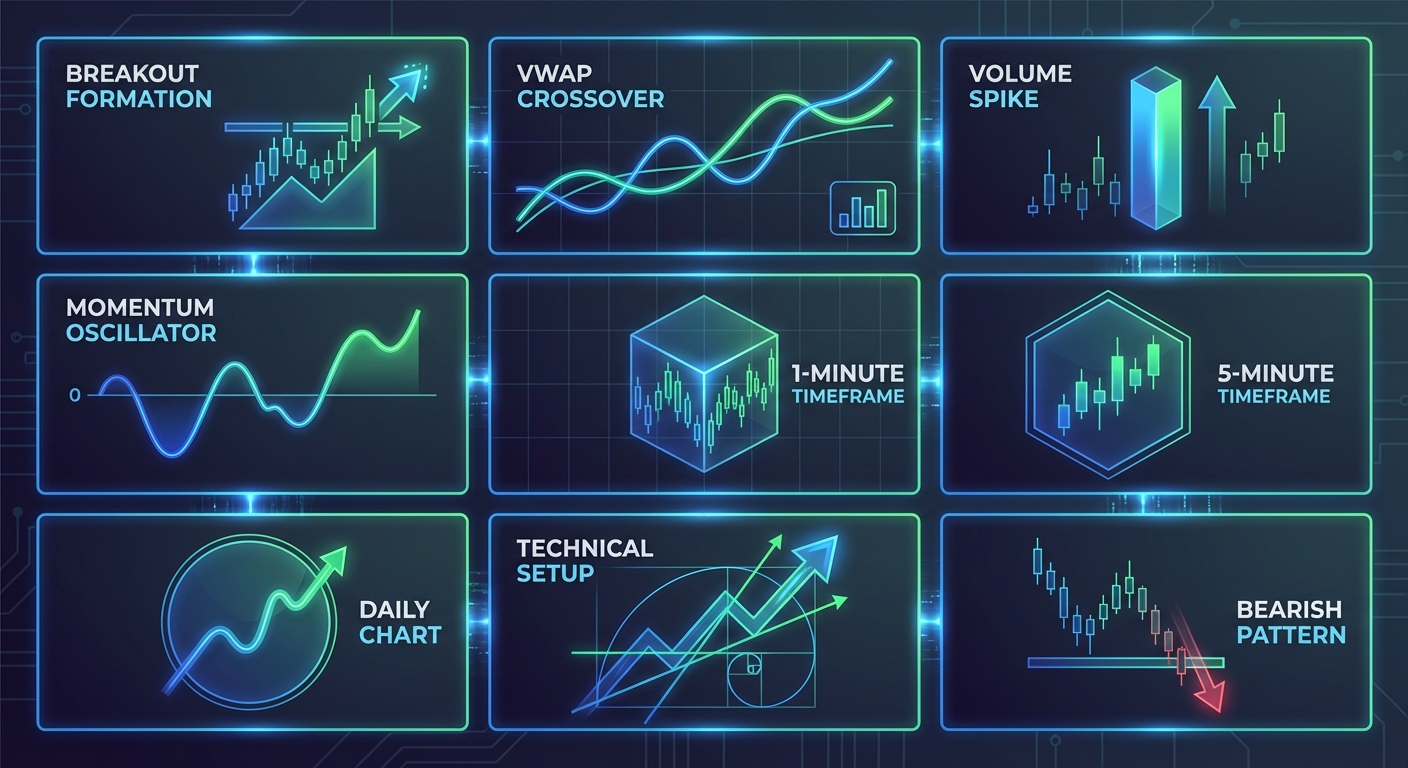
A candlestick pattern screener is a specialized type of stock screening software that automatically identifies and alerts traders when specific candlestick formations appear on price charts. These patterns include classic formations like bullish engulfing, doji, hammer, shooting star, morning star, and dozens of other technical setups that signal potential reversals or continuations.
The fundamental challenge that pattern screeners solve is simple: there are over 5,000 publicly traded stocks in the US market alone. Even if you narrow your focus to the most liquid 500 stocks, manually scanning through charts to find emerging patterns is incredibly time-consuming and prone to human error. You might spend two hours analyzing charts only to discover you missed the best setup of the day because it formed while you were reviewing a different sector.
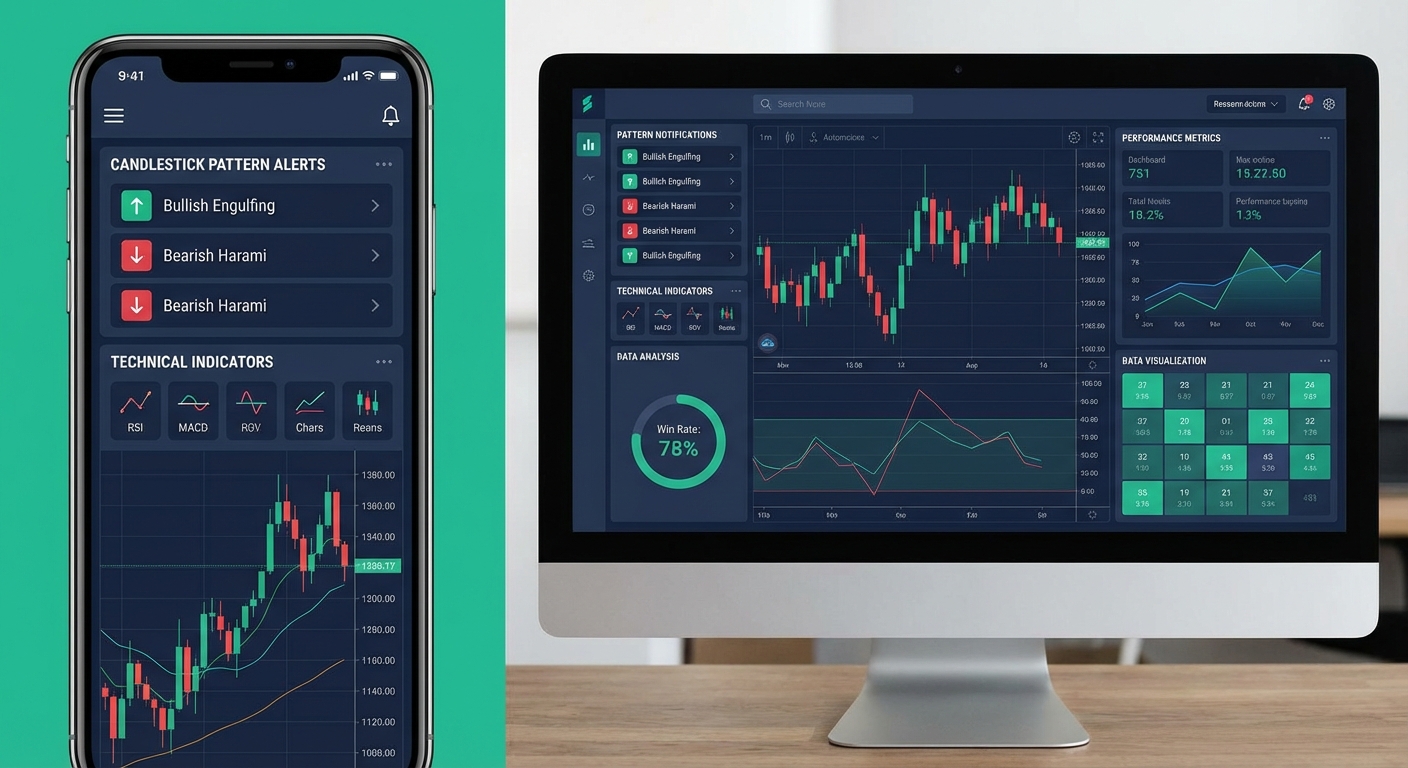
Modern candlestick pattern screeners continuously monitor the market during trading hours, scanning every stock across multiple timeframes simultaneously. When a pattern forms that matches your criteria, you receive an instant alert with the relevant chart, context, and often historical performance data for that specific setup. This automation transforms pattern recognition from a manual, time-intensive process into a systematic, scalable approach.
Consider this real-world scenario: You're a swing trader with a full-time job. You have 30 minutes in the evening to prepare for the next trading day. Without a screener, you might manually review 20-30 charts and identify two or three potential setups. With a quality candlestick pattern screener, you can review 50-100 pre-filtered opportunities ranked by quality, complete with backtest data showing which patterns have the highest probability of success. The time savings alone can be worth hundreds of hours per year.
The evolution of pattern screening technology has been dramatic. Early screeners from the 2000s offered basic end-of-day scanning with limited pattern libraries. Today's platforms provide real-time detection across 1-minute to monthly timeframes, sophisticated filtering to reduce false positives, mobile alerts so you never miss an opportunity, and crucially, backtested performance data that shows you which patterns actually work and which are statistical noise.
Custom-Coded Screeners vs Pre-Built Pattern Libraries
One of the first decisions you'll face when choosing a candlestick pattern screener is whether to build your own custom screening logic or use a platform with pre-built pattern libraries. Both approaches have distinct advantages and trade-offs that depend on your technical skills, time availability, and trading objectives.
The Learning Curve Trap
Custom-coded screeners require you to learn a programming or scripting language. On platforms like TradingView, this means mastering Pine Script to define your pattern criteria, set alert conditions, and manage notifications. For Python-based solutions, you'll need to understand data APIs, pandas dataframes, and pattern recognition algorithms. The initial learning curve is steep, typically requiring 40-60 hours of study before you can build even basic functional screeners.
The reality is that most traders who start down the custom coding path abandon it within the first month. The opportunity cost is significant: those 40-60 hours could be spent studying price action, refining your trading strategy, or actually trading. Unless you're building highly specialized screening logic that doesn't exist in any commercial platform, or you're managing institutional capital where custom solutions are standard, the time investment rarely pays off for individual retail traders.
Custom coding makes sense in specific scenarios. If you're a quantitative trader developing proprietary algorithms, if you're testing academic research that requires precise pattern definitions, or if you're screening exotic instruments or international markets with limited commercial tool support, then building your own solution may be justified. But for the vast majority of technical traders focused on US equities and standard candlestick patterns, pre-built solutions offer better value.
Pre-built candlestick pattern screeners come with curated libraries of proven patterns, often numbering in the dozens or even hundreds of technical setups. These platforms have already invested thousands of development hours into pattern recognition algorithms, false positive filtering, and user interface design. You get instant access to working screens without writing a single line of code. The trade-off is less customization flexibility, but for most traders, the 80-100 patterns available in quality platforms cover every scenario they'll encounter.
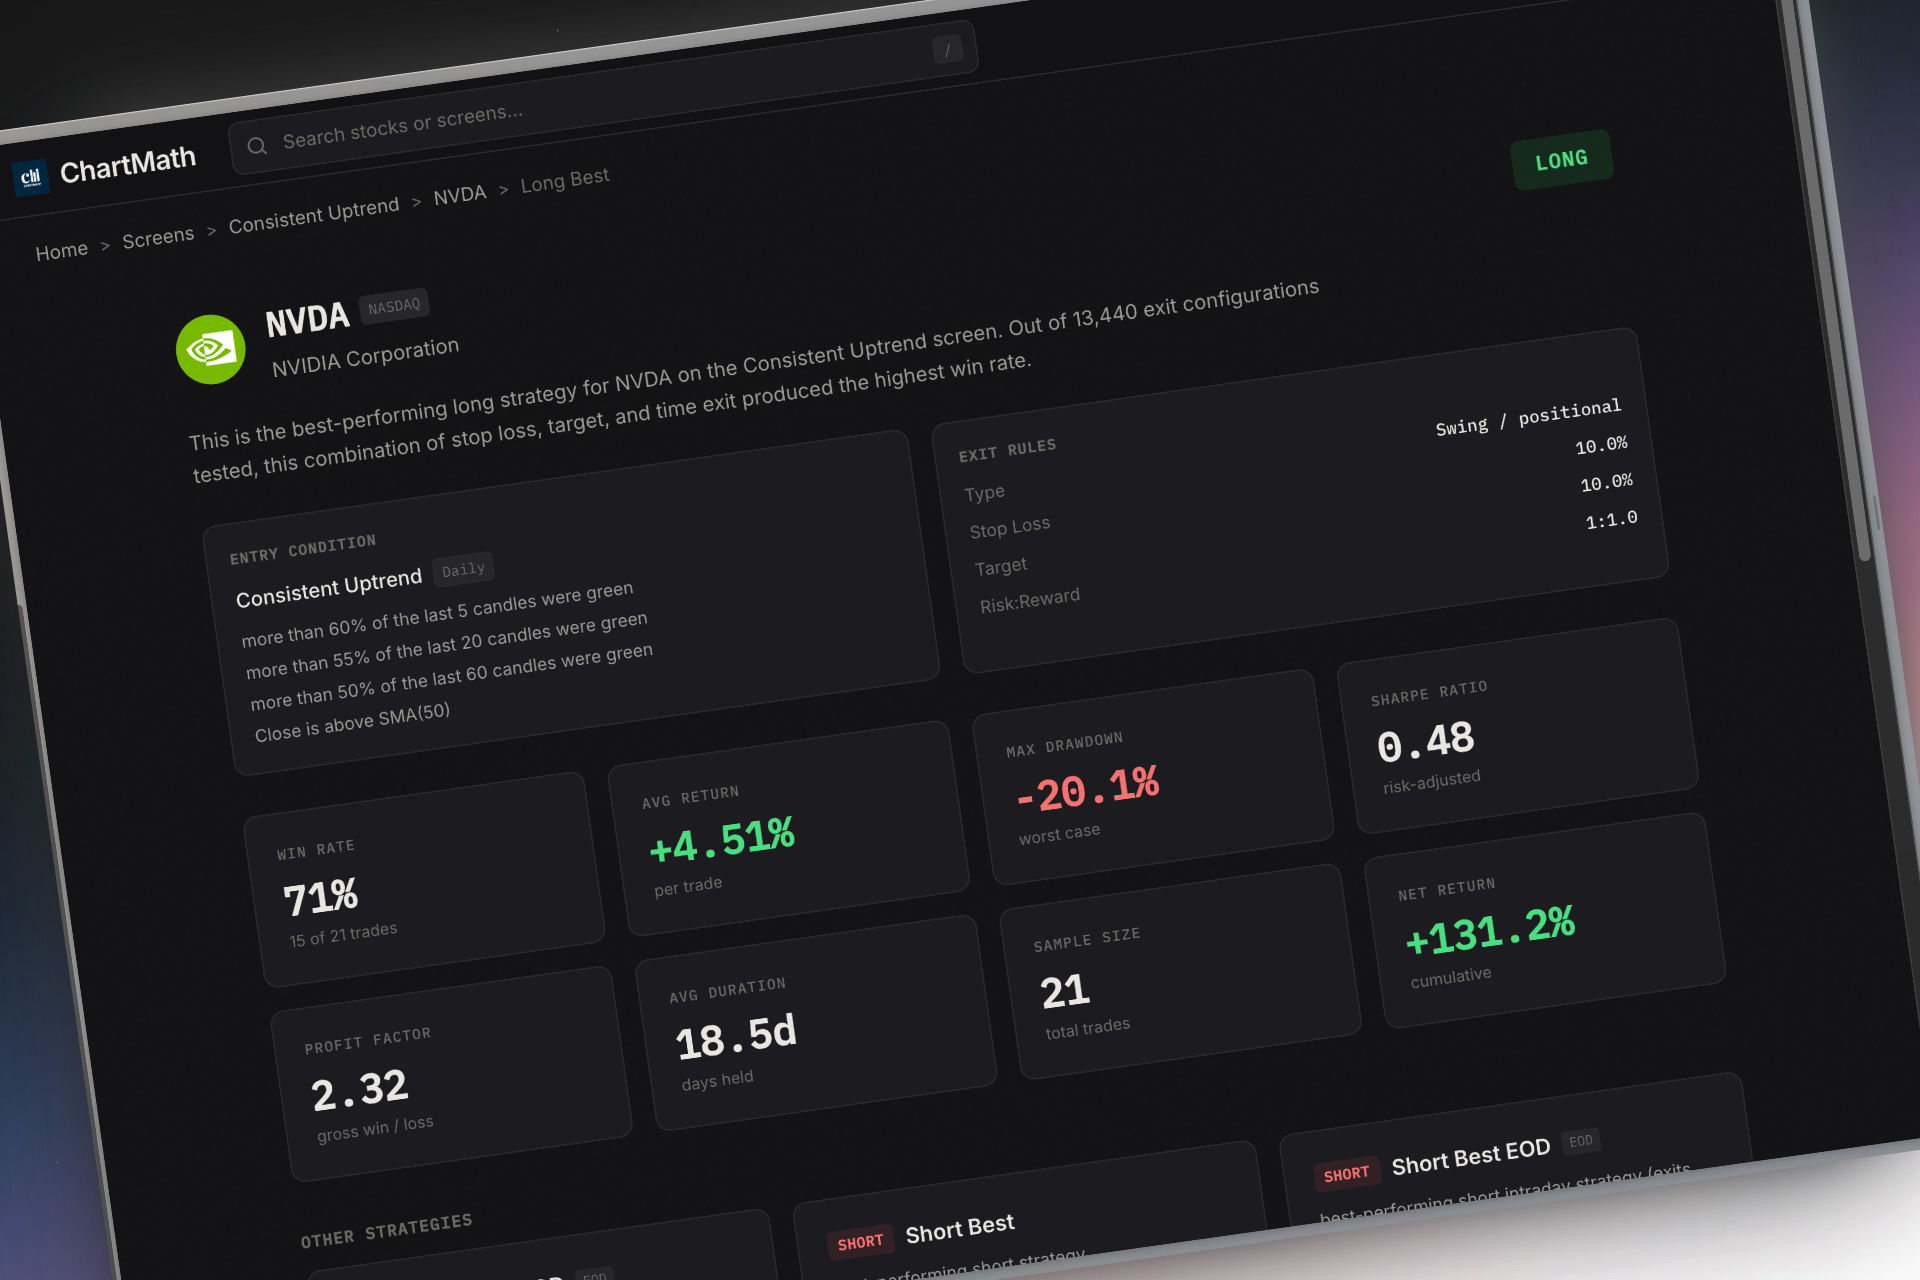
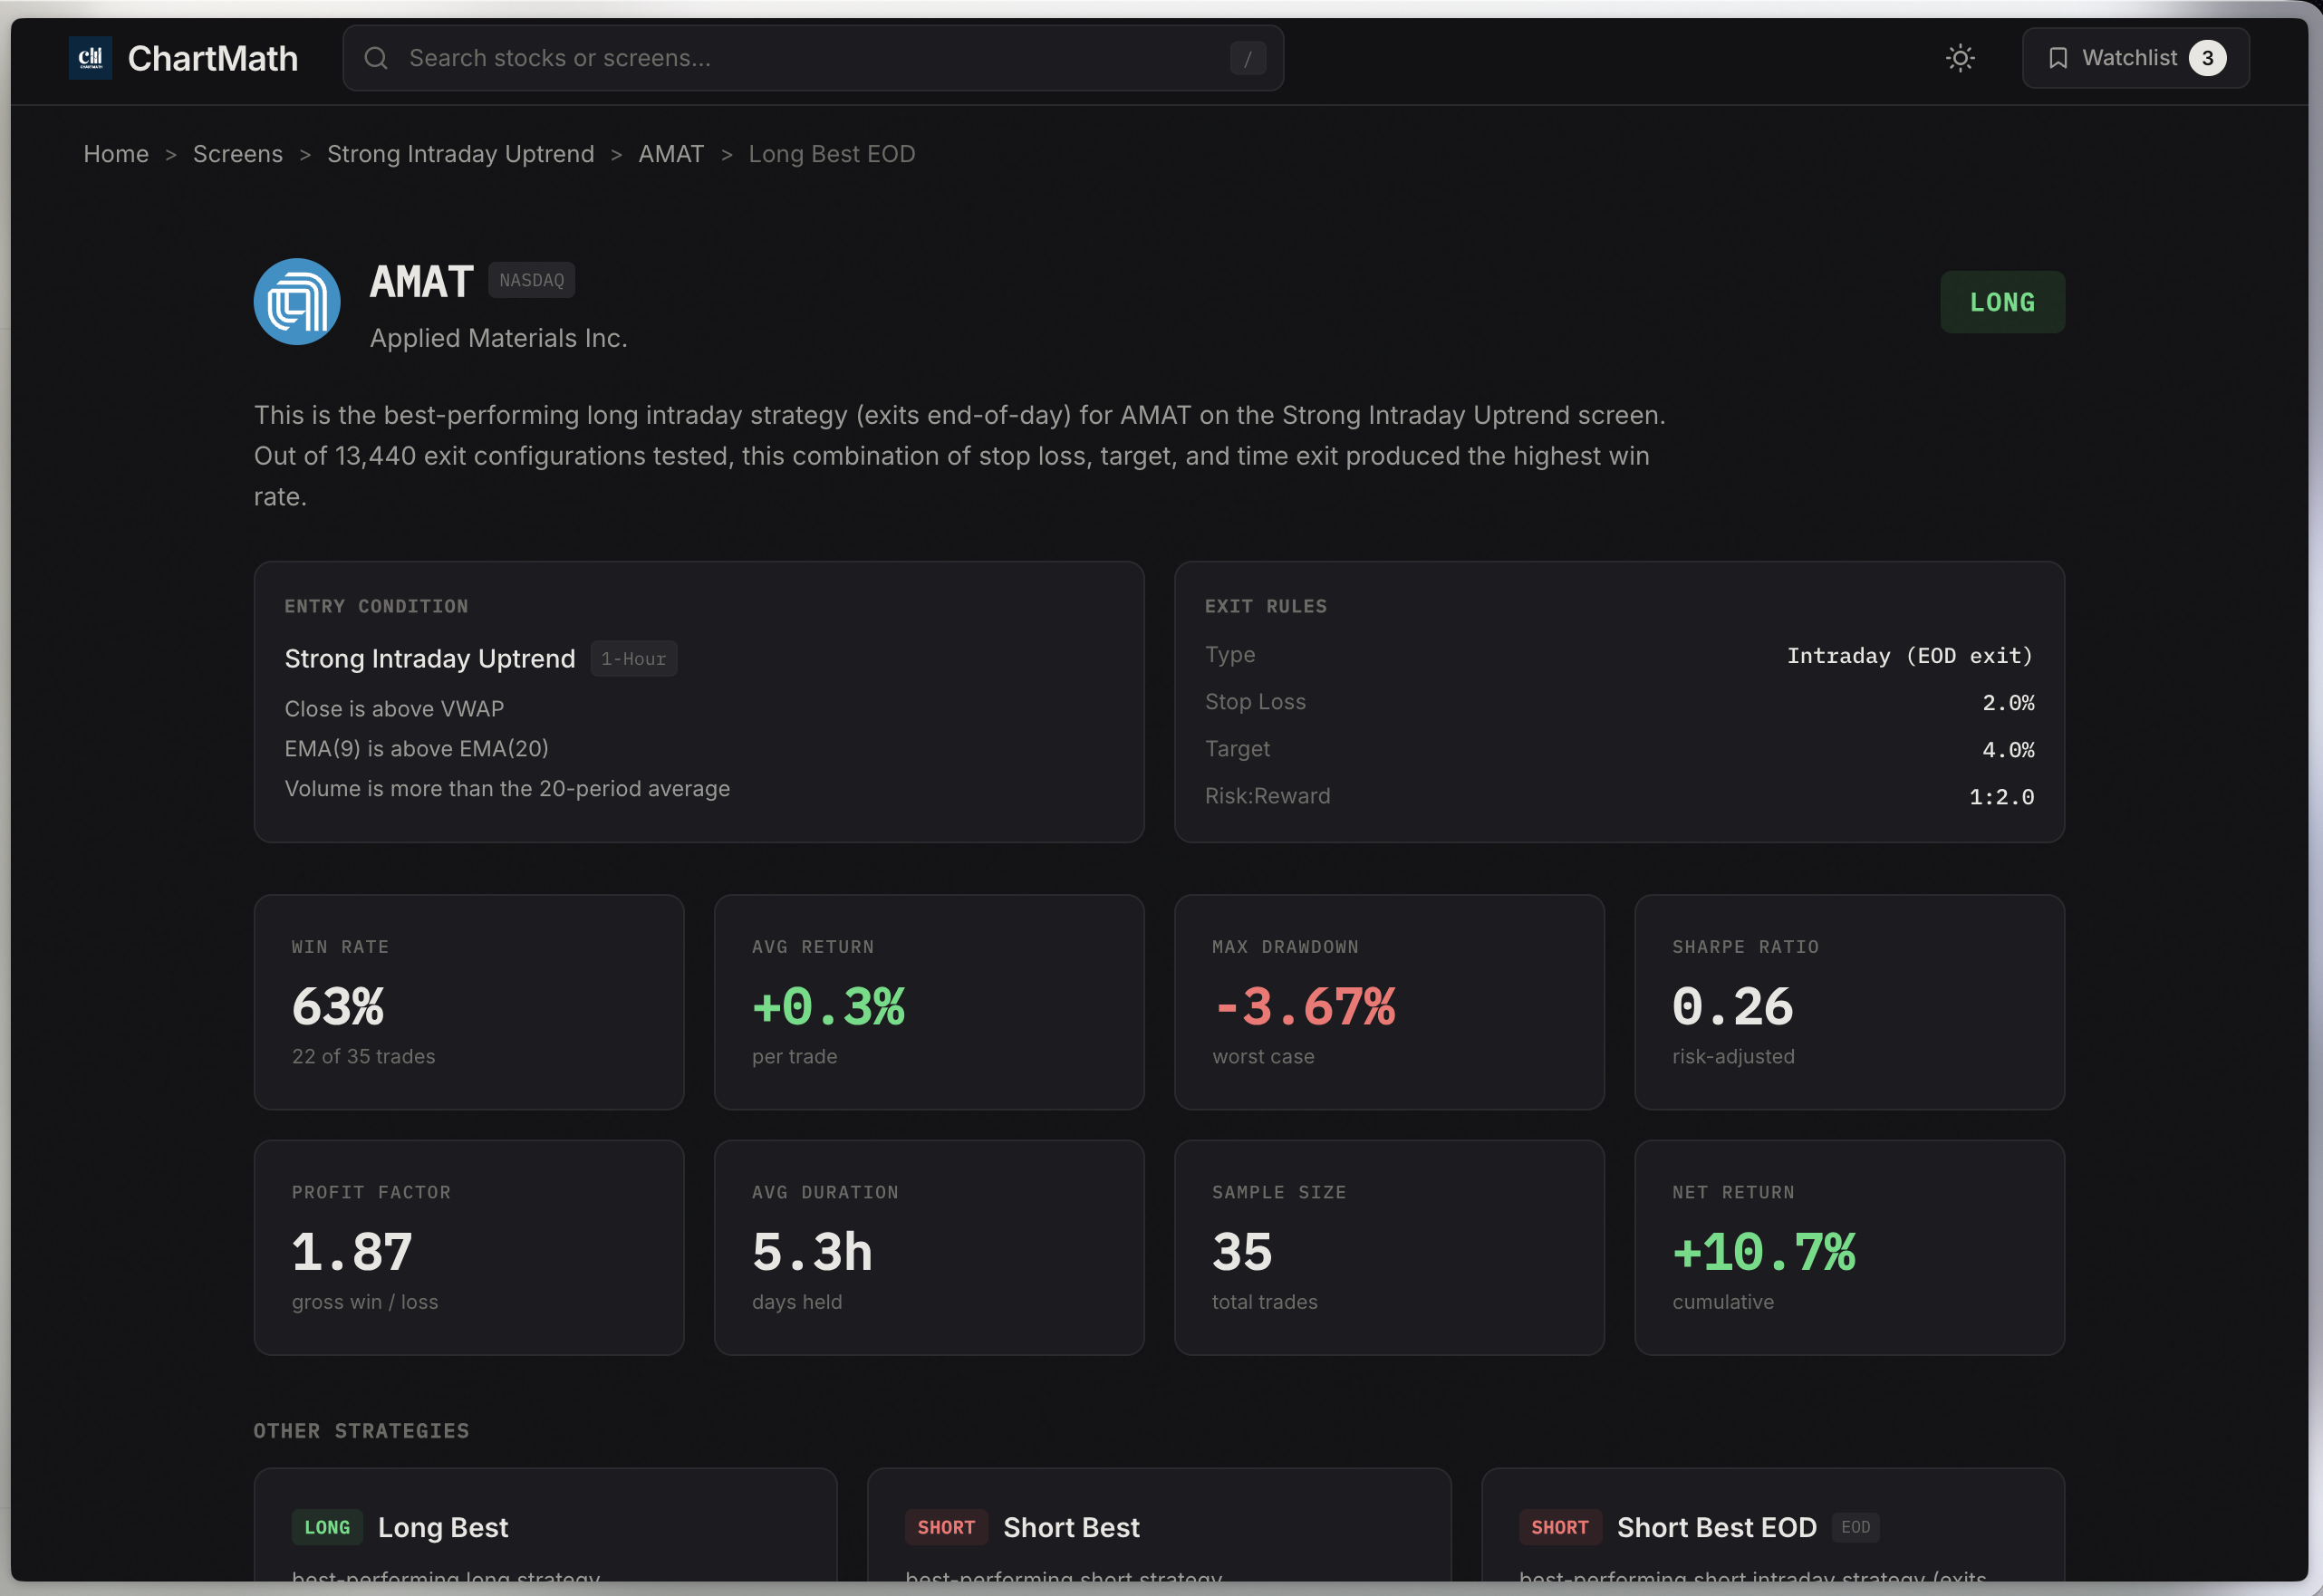
Platforms like ChartMath take the pre-built approach further by offering over 200 curated technical screens including candlestick patterns, momentum indicators, volume analysis, and breakout setups, all with backtested performance data. This eliminates the coding barrier entirely while providing transparency about which patterns actually generate positive expected value. For traders who want to focus on trading rather than programming, this approach delivers immediate results.
8 Essential Features Every Candlestick Pattern Screener Must Have
Not all candlestick pattern screeners are created equal. The difference between a mediocre screener and an excellent one often comes down to specific features that dramatically impact your trading results. Here are the eight non-negotiable features you should evaluate when comparing platforms.
Real-Time Scanning vs End-of-Day Data
The first critical distinction is whether the screener provides real-time pattern detection or only end-of-day scanning. For day traders and intraday scalpers, real-time scanning is absolutely essential. A bullish engulfing pattern that forms at 10:30 AM on a 5-minute chart needs to be identified within seconds, not at 4:00 PM when the market closes. Real-time screeners continuously monitor price action and send alerts the moment patterns complete.
End-of-day screeners are perfectly adequate for swing traders who make decisions based on daily or weekly charts. These platforms scan the market after the close and deliver a list of stocks showing relevant patterns. The advantage is lower cost and less alert fatigue. The disadvantage is you can't act on intraday opportunities. Match the scanning frequency to your trading timeframe: if you trade 1-minute to 15-minute charts, you need real-time. If you trade daily charts and hold positions for days or weeks, end-of-day scanning works fine.
Latency matters significantly for real-time screeners. A pattern alert that arrives 30 seconds after formation gives you time to review the chart and enter. An alert that arrives 5 minutes late means you've missed the optimal entry and are chasing. When evaluating real-time screeners, ask about their scan frequency (how often they check for patterns) and alert delivery speed. Quality platforms scan every 1-5 seconds and deliver push notifications in under 10 seconds.
Backtested Performance: The Most Overlooked Feature
This is where most candlestick pattern screeners fail traders. Pattern recognition alone tells you that a hammer formed on a stock. It doesn't tell you whether hammer patterns on that timeframe, in that market condition, actually lead to profitable trades. Backtested performance data is the difference between trading blind and trading with an edge.
The best screeners show you historical statistics for every pattern: win rate (what percentage of past occurrences led to profitable moves), average return per trade, maximum drawdown, and sample size. For example, a screener might show that bullish engulfing patterns on daily charts have a 58% win rate with an average return of 3.2% over the next 5 days, based on 847 historical occurrences. This data allows you to prioritize high-probability setups and skip patterns with poor historical performance.
Red flags to watch for: screeners that provide pattern alerts without any historical context, platforms that show win rates but don't disclose sample size (a 70% win rate based on 12 trades is meaningless), and services that cherry-pick their best-performing patterns while hiding overall statistics. Transparency is everything. If a platform won't show you the full backtest methodology and results, assume the data doesn't support their claims.
Sample size matters enormously. A pattern with a 65% win rate based on 500 historical trades is statistically significant. The same win rate based on 30 trades could easily be random chance. Always check the sample size before trusting backtest data. Quality platforms like ChartMath display sample size, win rate, average return, and exit strategy assumptions for every screen, giving you complete transparency about the edge you're trading.
Beyond win rate and average return, look for screeners that show performance across different market conditions. A pattern that works beautifully in bull markets but fails in choppy or bearish conditions is less valuable than one that performs consistently across all environments. Advanced platforms segment backtest results by volatility regime, trend direction, and sector, allowing you to filter patterns based on current market conditions.
Other essential features include multi-timeframe pattern detection (1-minute to monthly charts), alert delivery methods (push notifications, SMS, email, in-app), pattern quality filtering to rank setups by probability, customizable watchlists so you can track favorite stocks, plain-English explanations of why each pattern triggered, and mobile accessibility for monitoring opportunities away from your desk. Each of these features addresses a specific pain point in the pattern discovery workflow.
How to Evaluate Candlestick Pattern Screener Quality and Reliability
Features and marketing claims are one thing. Actual performance in live market conditions is another. Before committing to a candlestick pattern screener, you need to evaluate its quality and reliability through systematic testing. Here's how to separate the winners from the pretenders.
The False Positive Problem
The biggest quality issue with pattern screeners is false positives: alerts that claim a pattern has formed when it actually hasn't, or patterns that technically meet the criteria but are so marginal they have no predictive value. False positives create alert fatigue, where you receive so many low-quality notifications that you start ignoring all of them, including the legitimate opportunities.
A quality screener should prioritize accuracy over quantity. Receiving 10 high-quality pattern alerts per day that you can actually trade is far more valuable than receiving 100 alerts where 80 are noise. The best platforms implement quality filters that rank patterns by strength, volume confirmation, and historical performance, surfacing only the setups most likely to work.
To measure false positive rates, run a parallel test for 30 days. Sign up for a free trial or free tier of the screener you're evaluating. For every alert you receive, immediately pull up the chart and verify that the pattern actually exists and meets standard technical analysis criteria. Track the percentage of alerts that are legitimate versus questionable or clearly false. A quality screener should have a false positive rate under 10%. Anything above 20% will waste your time and erode your confidence in the tool.
Alert accuracy is closely related but slightly different. This measures whether the pattern still looks valid by the time you can act on it. Some screeners send alerts based on incomplete candles or patterns that quickly invalidate. For example, you might receive a bullish engulfing alert, but by the time you open your charting platform 60 seconds later, the pattern has already broken down. Test alert accuracy by tracking how many alerts still represent valid trading opportunities 2-5 minutes after you receive them.
Data source quality matters significantly. Screeners that pull from unreliable data feeds may show patterns that don't exist on your broker's charts, leading to confusion and missed trades. The best platforms use institutional-grade data from major exchanges with minimal latency. Ask potential vendors about their data sources, update frequency, and whether they've had historical data quality issues.
Uptime and reliability during market hours is non-negotiable. A screener that crashes during the first 30 minutes of trading, when volatility and opportunity are highest, is worse than useless. Check user reviews and community forums for reports of downtime, slow performance, or missed alerts. Quality platforms maintain 99%+ uptime during market hours and have redundant systems to prevent outages.
Community feedback provides valuable insight into real-world performance. Search for user reviews on trading forums, Reddit communities like r/Daytrading or r/StockMarket, and independent review sites. Look for patterns in feedback: if multiple users report the same issue (excessive false positives, slow alerts, poor customer support), take it seriously. Conversely, platforms with consistently positive feedback across multiple sources are more likely to deliver on their promises.
Key Metrics to Compare When Choosing a Candlestick Pattern Screener
When you're comparing multiple candlestick pattern screeners side by side, these are the specific metrics and specifications you should evaluate to make an apples-to-apples comparison.
Number of patterns supported: Basic screeners might offer 20-30 common candlestick patterns. Comprehensive platforms provide 100-200+ technical screens including candlestick patterns, chart patterns, momentum indicators, volume analysis, and custom combinations. More isn't always better, but having access to a wide variety of proven setups gives you flexibility to adapt to different market conditions. ChartMath offers over 200 curated screens covering every major technical setup, ensuring you never miss an opportunity because your platform doesn't support a specific pattern.
Scan frequency and refresh rates: How often does the screener check for new patterns? Real-time platforms should scan every 1-5 seconds. End-of-day screeners run once after market close. Some platforms offer hybrid models with real-time scanning for premium users and delayed scanning for free tiers. Match the scan frequency to your trading style: day traders need sub-10-second scanning, swing traders can work with end-of-day updates.
Historical backtest depth: How many years of historical data does the platform use for backtesting? One year of data captures recent market behavior but may miss important regime changes. Five or more years of data provides statistical significance and includes multiple market cycles (bull, bear, sideways). Deeper backtest history generally produces more reliable performance statistics, assuming the methodology is sound.
Alert delivery speed: The time between pattern formation and alert arrival on your device. For real-time trading, this should be under 30 seconds. Measure this during your trial period by noting the timestamp on alerts and comparing to when the pattern actually completed on your charting platform. Delays of 2-5 minutes make real-time screeners nearly useless for fast-moving intraday setups.
Platform compatibility: Does the screener work on web browsers, iOS, Android, desktop applications, or all of the above? Mobile-first platforms like ChartMath prioritize smartphone and tablet access, recognizing that modern traders need to monitor opportunities away from their desks. Desktop-focused platforms offer more screen real estate and advanced features but limit your flexibility. The best solution depends on your workflow: if you're always at a trading desk, desktop is fine. If you're a busy professional who trades around a day job, mobile access is essential.
Price per feature value analysis: Calculate the monthly cost divided by the number of useful features you'll actually use. A $50/month platform with 200 screens you'll use is better value than a $30/month platform with 50 screens where only 10 are relevant to your strategy. Also consider whether the platform offers a free tier for testing and learning before you commit to paid plans. Free tiers reduce your risk and let you validate the platform's quality with your own money on the line.
Customer support responsiveness: When you have a question about an alert or encounter a technical issue, how quickly does the vendor respond? Test this during your trial by submitting a support ticket or using live chat. Quality platforms respond within 24 hours for email and under 5 minutes for live chat during business hours. Poor support is a red flag that suggests the vendor doesn't prioritize user success.
Desktop vs Mobile-First Candlestick Pattern Screeners
The platform architecture and primary interface design significantly impact your daily trading experience. Traditional desktop platforms and modern mobile-first solutions represent fundamentally different philosophies about how traders should interact with screening tools.
Desktop platforms like Trade Ideas and TC2000 were built in an era when traders sat at multi-monitor setups for entire trading sessions. These platforms offer powerful features, complex filtering options, and extensive customization. The interface is designed for mouse and keyboard input with multiple windows, tabs, and panels. For professional day traders who maintain dedicated trading stations, desktop platforms provide the depth and flexibility to build sophisticated screening workflows.
The trade-off is complexity and lack of mobility. Desktop platforms have steep learning curves, often requiring hours of tutorial videos to understand basic functionality. More importantly, you can't monitor alerts or review setups when you're away from your computer. If you're in a meeting, commuting, or simply away from your desk, you're blind to opportunities. For traders with full-time jobs or busy schedules, this limitation is a dealbreaker.
Mobile-first platforms like ChartMath flip the paradigm. They're designed from the ground up for smartphone and tablet use, with touch-optimized interfaces, swipe-based navigation, and push notifications that work wherever you are. The philosophy is that modern traders need flexibility: you might review your watchlist over morning coffee, receive an alert during lunch, and execute a trade from your phone while waiting for a meeting to start. Mobile-first doesn't mean less powerful; it means accessible and contextual.
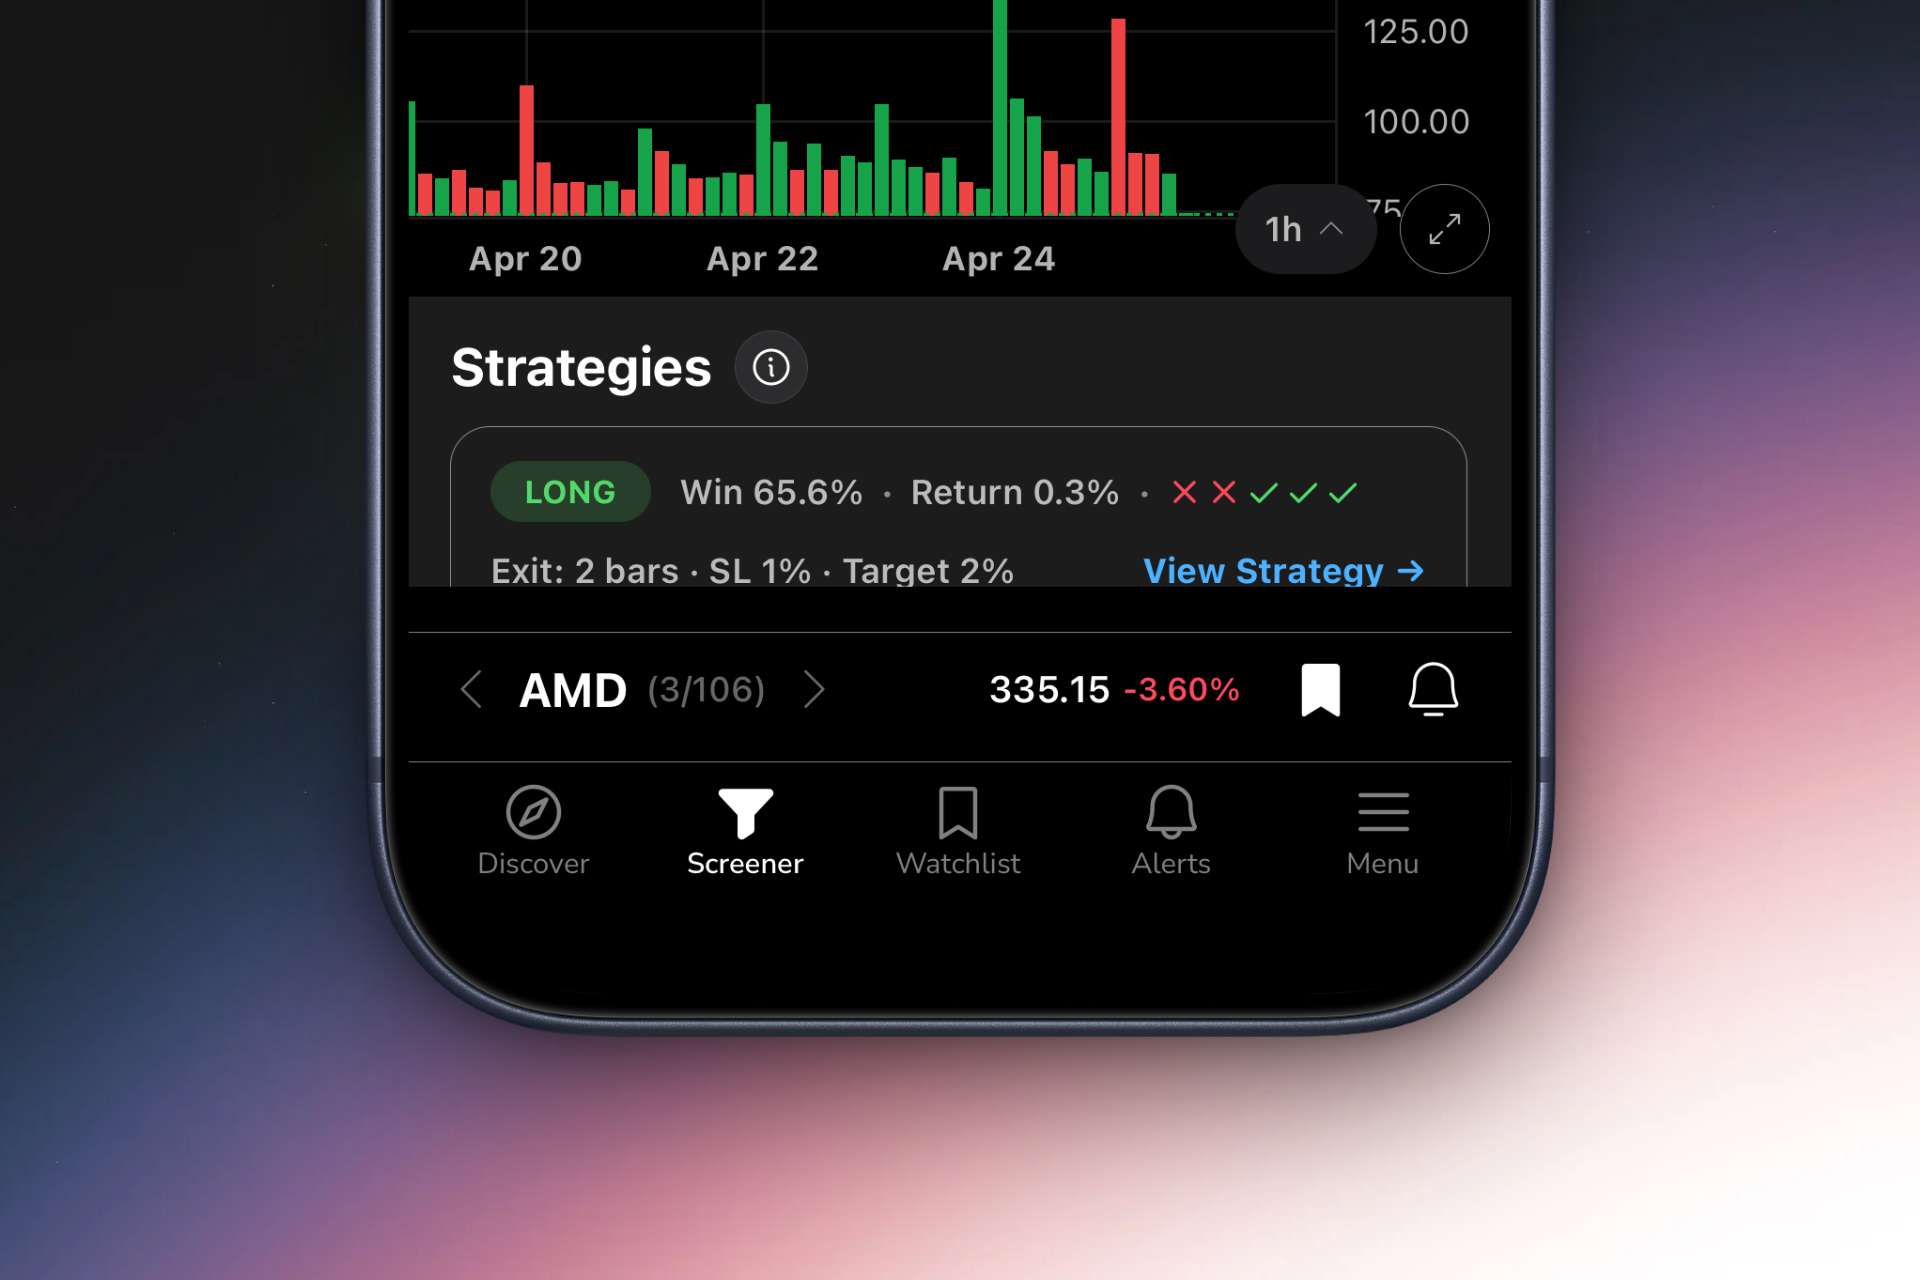
The interface design reflects this difference. Desktop platforms use traditional layouts with lists, tables, and multiple panels. Mobile-first platforms often adopt modern UI patterns like vertical swipe feeds (similar to TikTok or Instagram Stories) that let you quickly review ranked opportunities with a thumb gesture. ChartMath's swipe interface lets you flip through dozens of setups in minutes, with each card showing the chart, pattern explanation, and backtest data in a single glance.
The hybrid approach combines both worlds: a mobile companion app that works alongside your primary desktop charting platform. This model recognizes that you might do deep analysis and trade execution on desktop while using mobile for monitoring and alerts. Platforms like TradingView offer both web/desktop and mobile apps with synced watchlists and alerts. The key is ensuring the mobile experience isn't just a stripped-down version of desktop but a thoughtfully designed interface optimized for on-the-go use.
Use case scenarios help clarify which approach fits your needs. If you're a full-time day trader executing 10-20 trades per day from a dedicated home office, desktop platforms provide the power and screen real estate you need. If you're a swing trader with a full-time job who checks opportunities twice daily and holds positions for days, mobile-first platforms give you the flexibility to stay connected without being chained to a desk. If you're an active intraday trader who wants the best of both worlds, look for platforms with strong mobile and desktop offerings that sync seamlessly.
Popular Candlestick Pattern Screener Options in 2026
The market for candlestick pattern screeners has matured significantly, with several established platforms serving different trader segments. Here's an objective comparison of the leading options in 2026, including their strengths, limitations, and ideal user profiles.
TradingView is primarily a charting platform with screening capabilities through Pine Script custom alerts. Users can code their own candlestick pattern detection logic or use community-shared scripts. The strength is flexibility and a massive user community sharing indicators and strategies. The limitation is that you need to learn Pine Script to build effective screeners, and there's no built-in backtest data showing which patterns actually work. TradingView is ideal for traders who want complete customization control and don't mind the coding learning curve. It requires a paid subscription plus time investment to build or find quality pattern scripts.
Finviz offers free stock screening with end-of-day data and some technical pattern filters. It's excellent for fundamental screening and sector analysis but limited for candlestick pattern detection. The free tier makes it accessible for beginners, but the lack of real-time scanning and pattern-specific backtesting means it's better suited as a supplementary tool rather than a primary pattern screener. Finviz works well for swing traders who combine fundamental and technical analysis and don't need intraday alerts.
Trade Ideas is a premium desktop AI scanner starting at $118+ per month, targeting professional day traders. It offers sophisticated pattern recognition, real-time scanning, and AI-driven opportunity ranking. The platform is powerful but expensive and complex, with a steep learning curve. Trade Ideas makes sense for full-time traders generating consistent income who can justify the monthly cost and time investment to master the platform. It's overkill for part-time traders or those still developing their strategy.
TrendSpider automates chart analysis with multi-timeframe overlays and recognizes 147 pattern types starting at $22+ per month. It's a charting tool first and screener second: you can't easily say "show me all stocks in ascending triangles right now" the way you can with dedicated screeners. TrendSpider excels at analyzing individual stocks you're already watching but is less effective for discovering new opportunities across the entire market. It's best for traders who have a defined watchlist and want automated pattern recognition on those specific stocks.
ChartMath takes a different approach: 200+ pre-built technical screens including candlestick patterns, momentum setups, volume analysis, and breakout plays, all with transparent backtested performance data. The platform is mobile-first with a TikTok-style swipe interface that ranks opportunities by quality and freshness. No coding required, real-time alerts with plain-English explanations, and a free tier to test before committing. ChartMath is designed for technical traders who want instant access to proven setups without the complexity of traditional platforms. It works as a standalone discovery tool or as a companion to your existing charting platform, alerting you to opportunities you can then analyze and execute on your preferred broker. Watch a demo to see the swipe interface and backtest data in action.
Other notable platforms include Tickeron (AI pattern confidence scores but opaque methodology), Edgeful (futures-focused probability reports), LuxAlgo (TradingView indicator toolkit requiring separate subscription), StockCharts (comprehensive charting with DIY scanning), and TC2000 (desktop charting and scanning with integrated brokerage). Each serves specific niches, but for most retail traders focused on US equities and standard technical patterns, the choice typically comes down to whether you want customization flexibility (TradingView), institutional-grade power (Trade Ideas), or accessible pre-built screens with performance data (ChartMath).
When comparing these options, create a spreadsheet with your must-have features down the left column and platforms across the top. Score each platform on how well it delivers each feature. Weight the scores based on what matters most to your trading style. This systematic approach removes emotional decision-making and helps you choose based on objective fit rather than marketing claims or brand recognition.
How ChartMath Solves Common Candlestick Pattern Screener Problems
Most candlestick pattern screeners suffer from one or more critical problems: they require coding skills, they don't show backtest data, they generate excessive false positives, or they're desktop-only and miss opportunities when you're away from your computer. ChartMath was built specifically to address these pain points with a fundamentally different approach to pattern screening.
The no-coding barrier is the first major difference. ChartMath provides 200+ pre-built technical screens covering every major candlestick pattern, chart pattern, momentum indicator, and volume setup that technical traders use. You don't write a single line of code. You don't learn Pine Script or Python. You open the app, swipe through ranked opportunities, and tap to add setups to your watchlist. This eliminates the 40-60 hour learning curve that kills most custom screening projects and lets you start discovering trades immediately.
The transparent backtest data is what separates ChartMath from pattern recognition tools that just tell you a pattern formed. Every screen shows historical win rate, average return per trade, and sample size based on years of market data. For example, you might see that bullish engulfing patterns on 15-minute charts have a 61% win rate with an average return of 2.1% over the next 4 hours, based on 1,247 historical occurrences. This data lets you prioritize high-probability setups and skip patterns with poor historical performance. You're not trading blind; you're trading with statistical evidence.
The TikTok-style swipe interface transforms how you discover opportunities. Instead of scrolling through endless lists or clicking through multiple tabs, you swipe vertically through a ranked feed of setups. Each card shows the chart, the pattern that triggered, the backtest statistics, and a plain-English explanation of why this setup matters. The interface is optimized for speed: you can review 50 opportunities in 5 minutes, quickly dismissing setups that don't fit your criteria and adding interesting ones to your watchlist for deeper analysis.
Real-time alerts with context solve the problem of alert fatigue. ChartMath doesn't just ping you that a pattern formed. The alert includes the chart, the specific pattern that triggered, the timeframe, and the historical performance data for that setup. You immediately understand what happened and whether it's worth investigating further. Alerts are ranked by quality, so the highest-probability setups surface first. This filtering dramatically reduces false positives and ensures you're only notified about opportunities that meet statistical quality thresholds.
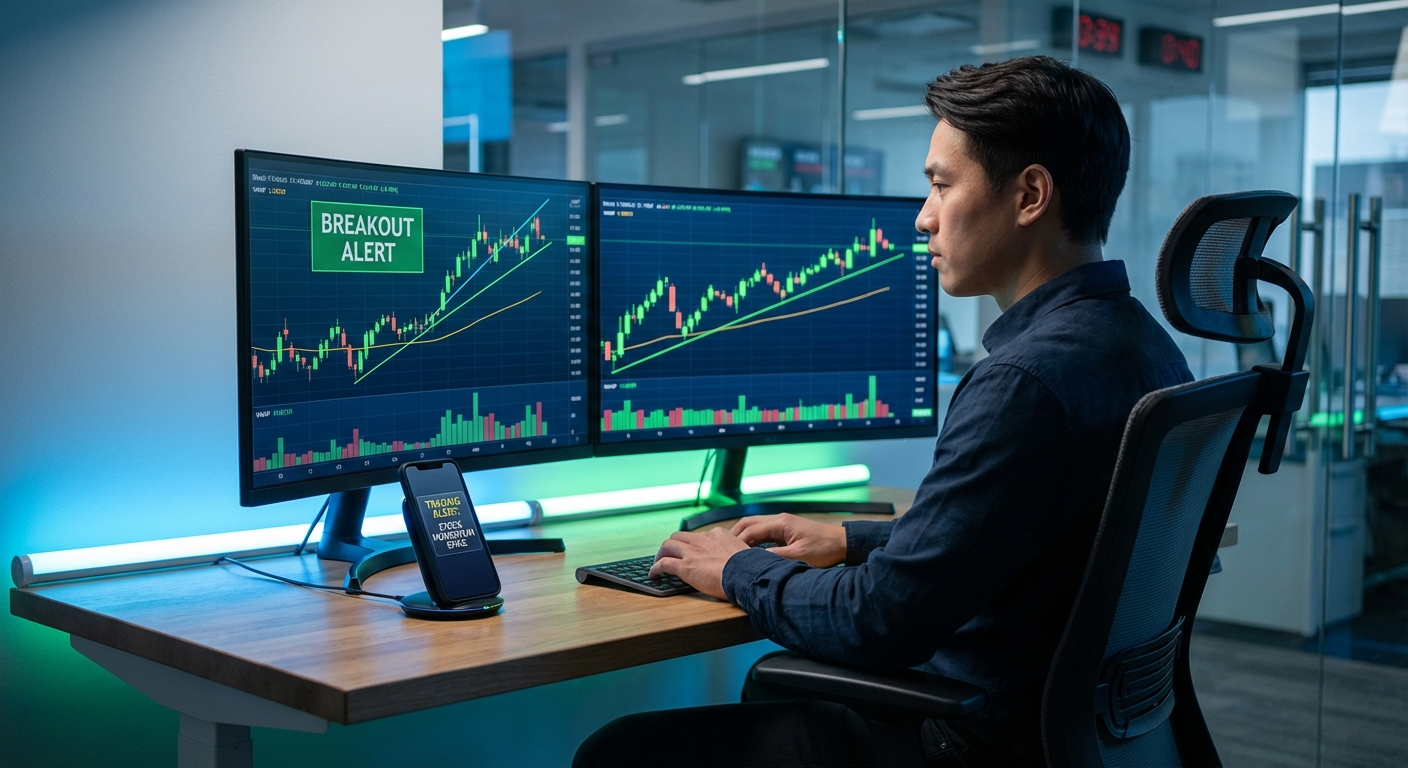
The mobile-first design recognizes that modern traders aren't chained to desks. You might be in a meeting when a perfect opening range breakout forms on a stock you've been watching. ChartMath sends a push notification to your phone. You can review the setup, check the backtest data, and decide whether to execute, all from your smartphone in under 60 seconds. The platform works as a companion to your existing charting and execution platforms, alerting you to opportunities you can then trade on your preferred broker.
Multi-timeframe analysis from 1-minute to monthly charts means ChartMath serves both day traders and swing traders. Day traders can monitor 1-minute, 5-minute, and 15-minute patterns for intraday scalps and momentum plays. Swing traders can focus on daily and weekly patterns for multi-day position trades. You're not locked into a single timeframe or trading style; the platform adapts to how you trade.
ChartMath integrates seamlessly into existing trading workflows. It's not trying to replace your charting platform or broker. Instead, it solves the specific problem of opportunity discovery: continuously monitoring the market and alerting you when high-probability setups form. You receive the alert, review the setup in ChartMath to understand the pattern and backtest data, then switch to your charting platform for detailed analysis and execution. This focused approach makes ChartMath a powerful addition to your trading toolkit without requiring you to abandon tools you already know and trust.
Making Your Final Decision: A Step-by-Step Evaluation Framework
With multiple candlestick pattern screener options available, making the right choice requires a systematic evaluation process. Here's a step-by-step framework to guide your decision and ensure you select a platform that truly fits your needs.
Step 1: Define your trading style and timeframe preferences. Are you a day trader executing multiple intraday trades, a swing trader holding positions for days or weeks, or a position trader working on weekly and monthly charts? Do you trade from a dedicated desk or need mobile access throughout the day? Do you focus on specific sectors or scan the entire market? Write down your specific requirements before evaluating platforms. This clarity prevents you from being swayed by features you'll never use or missing features you absolutely need.
Step 2: List must-have features versus nice-to-have features. Must-have features are non-negotiable: if a platform lacks them, it's automatically disqualified. For a day trader, real-time scanning might be must-have. For a swing trader, end-of-day scanning is sufficient. Nice-to-have features add value but aren't dealbreakers. Create two columns and be honest about what you truly need versus what sounds cool in marketing materials. This prevents feature bloat from driving your decision.
Step 3: Test free trials and free tiers for 30 days. Don't rely on demos or marketing videos. Actually use the platforms you're considering for at least 30 days of live market conditions. Track every alert you receive. Verify pattern accuracy. Measure false positive rates. Test alert delivery speed. Evaluate the user interface during real trading sessions when you're under time pressure. Thirty days gives you enough data to see how the platform performs across different market conditions (trending, choppy, high volatility, low volatility).
Step 4: Track alert quality and false positive rates. Create a simple spreadsheet to log every alert: date, time, stock, pattern, whether the pattern was valid when you checked, whether it led to a profitable setup, and any notes. After 30 days, calculate your false positive rate (invalid alerts divided by total alerts) and your actionable opportunity rate (alerts that led to trades you actually took). A quality screener should have under 10% false positives and at least 20% actionable opportunities. If you're getting 100 alerts per day but only 5 are worth investigating, the platform is wasting your time.
Step 5: Evaluate ROI based on time saved and trades captured. Calculate the value the screener provides. If it saves you 2 hours per day of manual chart scanning, that's 40 hours per month. What's your time worth? If the screener helps you catch 2-3 additional high-probability setups per month that you would have missed manually, what's the profit impact? Compare this value to the monthly subscription cost. A $50/month platform that saves you 40 hours and generates an extra $500 in trading profits is an obvious win. A $50/month platform that saves you 2 hours and doesn't improve your results is a waste.
Step 6: Consider integration with your existing trading workflow. How well does the screener fit with your current charting platform, broker, and daily routine? If you use TradingView for charting, does the screener's alert format make it easy to quickly pull up the relevant chart? If you trade on your phone during lunch breaks, does the screener have a quality mobile app? Friction in your workflow leads to missed opportunities and frustration. The best screener is one that feels like a natural extension of how you already trade.
Common mistakes to avoid: choosing based on price alone (the cheapest option is rarely the best value), being swayed by feature lists without testing actual performance, ignoring user reviews and community feedback, failing to verify backtest methodology and data quality, and committing to annual subscriptions before thoroughly testing the platform. Take your time with this decision. The right candlestick pattern screener will be a core part of your trading toolkit for years.
When to upgrade or switch platforms: if your trading style changes (day trading to swing trading or vice versa), if you consistently hit limitations in your current platform (not enough patterns, slow alerts, poor mobile experience), if you find yourself manually supplementing the screener because it's missing key features, or if you discover a platform with significantly better backtest data or lower false positive rates. Don't be afraid to switch if your current solution isn't serving you well. The switching cost is minimal compared to the opportunity cost of using suboptimal tools.
For more guidance on building an efficient screening workflow, check out our comprehensive guide on how to build an efficient trading workflow in 2026, which covers how to integrate pattern screeners with your charting platform and execution process.
Frequently Asked Questions About Candlestick Pattern Screeners
What's the difference between a stock screener and a pattern screener? A stock screener filters stocks based on fundamental criteria (market cap, P/E ratio, dividend yield) or basic technical criteria (price above moving average, volume above average). A candlestick pattern screener specifically identifies technical chart patterns like bullish engulfing, hammer, doji, and other candlestick formations. Pattern screeners are specialized tools for technical traders, while stock screeners serve both fundamental and technical analysis. Many platforms offer both capabilities, but dedicated pattern screeners provide more sophisticated pattern recognition and historical performance data.
Do I need coding skills to use a candlestick pattern screener? It depends on the platform. Traditional platforms like TradingView require Pine Script coding to build custom pattern alerts. Modern platforms like ChartMath provide 200+ pre-built screens with no coding required. If you're comfortable learning programming languages and want complete customization, coding-based platforms offer flexibility. If you want to start screening immediately without the learning curve, choose a platform with pre-built pattern libraries. For most retail traders, no-code solutions provide better value and faster results.
How accurate are automated candlestick pattern screeners? Accuracy varies significantly by platform. Quality screeners achieve 90%+ pattern recognition accuracy, meaning the patterns they identify actually exist and meet standard technical analysis criteria. Lower-quality screeners suffer from false positives, where alerts claim patterns formed that are marginal or invalid. The key is testing during a free trial: verify every alert for 30 days and calculate your false positive rate. Also consider that pattern accuracy is different from trading profitability. A screener might accurately identify patterns, but if those patterns don't have positive expected value, accuracy alone doesn't help you make money. Look for platforms that show backtested performance data, not just pattern recognition.
Can I use a candlestick pattern screener for crypto or forex? Some screeners support multiple asset classes, but most focus on US equities. TradingView supports stocks, crypto, forex, and futures with custom Pine Script alerts. ChartMath currently focuses on US equities with plans to expand to other markets. If you trade crypto or forex, verify that your chosen platform supports those markets and provides quality data feeds for those assets. Pattern recognition principles are similar across asset classes, but data quality and market microstructure differences mean you need a platform specifically designed for your target market.
What's the best candlestick pattern screener for beginners? Beginners benefit most from platforms with pre-built pattern libraries, plain-English explanations, and educational resources. ChartMath is designed specifically for traders learning technical analysis, with 200+ curated screens, backtest data showing which patterns actually work, and explanations of why each setup triggered. The mobile-first interface and free tier let beginners explore pattern screening without financial risk or coding knowledge. Avoid complex platforms like Trade Ideas or custom coding solutions until you've developed a solid foundation in technical analysis and know exactly what you're looking for.
How much should I expect to pay for a quality screener? Pricing ranges from free tiers with limited features to $100+ per month for professional platforms. Free options like Finviz provide basic end-of-day screening. Mid-tier platforms like TrendSpider start around $20-40 per month with real-time scanning and pattern recognition. Professional platforms like Trade Ideas cost $118+ per month with advanced AI features. ChartMath offers a free tier for learning and testing, with premium features at competitive pricing for active traders. Choose based on your trading frequency and income: if you're trading daily and generating consistent profits, a $50-100/month platform is easily justified. If you're learning or trading occasionally, start with free or low-cost options.
Can I backtest my own candlestick patterns? Some platforms allow custom backtesting, but it typically requires coding skills or advanced platform features. TradingView's Strategy Tester lets you backtest Pine Script strategies. Dedicated backtesting platforms like Amibroker or TradeStation offer more sophisticated testing capabilities but have steep learning curves. For most traders, using a platform that provides pre-backtested patterns is more practical than building your own backtesting infrastructure. ChartMath shows backtest results for every screen, eliminating the need to run your own tests unless you're developing proprietary strategies. If you want to dive deeper into backtesting methodology, read our guide on how to build winning backtesting strategies.
Do professional traders use candlestick pattern screeners? Yes, but their approach differs from retail traders. Professional day traders at prop firms often use institutional-grade screeners like Trade Ideas or custom-built solutions integrated with their execution platforms. Hedge fund quants build proprietary pattern recognition algorithms. Retail professional traders (those trading their own capital full-time) use a mix of commercial platforms and custom tools. The key difference is that professionals focus heavily on backtest data and statistical edges, not just pattern recognition. They want to know the expected value of every setup, not just that a pattern formed. This is why platforms that provide transparent performance data are increasingly popular across all trader segments.
For more insights on specific technical setups and how to trade them, explore our articles on 15 proven technical setups every day trader should know and 15 most profitable chart patterns for day traders in 2026.
Start Screening Smarter Today
Choosing the right candlestick pattern screener is one of the most impactful decisions you'll make as a technical trader. The right platform saves you hours of manual chart scanning, helps you catch high-probability setups you would have missed, and provides the data you need to trade with confidence rather than guessing. The wrong platform wastes your time with false positives, misses opportunities due to slow alerts, or leaves you blind to the statistical edge behind each pattern.
The best candlestick pattern screener for you depends on your specific trading style, timeframe preferences, technical skill level, and budget. Day traders need real-time scanning with sub-30-second alerts. Swing traders can work with end-of-day screening. Beginners benefit from pre-built pattern libraries with educational context. Advanced traders might want customization flexibility through coding. Mobile-first traders need quality smartphone apps. Desktop traders want power and screen real estate.
Regardless of which platform you choose, prioritize these non-negotiable features: backtested performance data showing which patterns actually work, low false positive rates to avoid alert fatigue, fast and reliable alerts during market hours, and a user interface that fits naturally into your existing workflow. Test multiple platforms during free trials, track alert quality systematically, and calculate the ROI based on time saved and trades captured.
ChartMath was built specifically to solve the problems that frustrate technical traders: the coding barrier, the lack of performance data, the alert fatigue from low-quality screeners, and the desktop-only limitation that causes missed opportunities. With 200+ pre-built screens, transparent backtest statistics, a mobile-first swipe interface, and real-time alerts with plain-English explanations, ChartMath delivers the candlestick pattern screener experience modern traders need. Try the web-based screener or download the mobile app to start discovering high-probability setups backed by data, not guesswork.
The market doesn't wait for you to manually scan charts. Every minute you spend flipping through tickers is a minute you're not analyzing setups, managing positions, or executing trades. Let a quality candlestick pattern screener handle the discovery process so you can focus on what actually generates profits: making smart trading decisions based on proven technical setups with statistical edges. Start screening smarter today.
Ankush Jindal
Co-Founder, ChartMath
Ankush Jindal is the Co-Founder of ChartMath, a real-time trade discovery platform that monitors 200+ technical screens across the market to surface actionable setups for technical traders. He holds a B.Tech in Computer Science from IIT Mandi. Before ChartMath, he co-founded two successful technology ventures spanning hundreds of thousands of users. This experience building data-intensive, real-time systems directly shaped his approach to technical analysis tooling. At ChartMath, Ankush leads product vision, designing intuitive interfaces that translate complex price action into clear, backtested signals. His philosophy: trading decisions should be backed by data, not gut feeling.
LinkedInSee these setups live in ChartMath
200+ curated screens with backtest data. Free to use.
Related Articles
Market Scanners for Day Trading: Ultimate 2026 Guide
Discover how market scanners help day traders find high-probability setups in real-time. Learn to filter thousands of stocks for ORB, VWAP, and momentum breakouts.
The Ultimate Trading Tools Stack for Data Driven Stock Trading in 2026
Discover the essential trading tools for data driven stock trading. From screeners to charting platforms, learn what you actually need in your stack.
Momentum Trading Software Buyer's Guide: 7 Must-Have Features
Discover the 7 essential features every momentum trading software needs in 2026. Compare platforms, avoid costly mistakes, and find the right tools.