Table of Contents
You've found the perfect technical setup. The chart looks clean, the volume is there, and every indicator is aligned. You enter the trade with confidence, only to watch it fail spectacularly. Sound familiar? The problem isn't your chart reading skills. It's that you're trading blind, without knowing whether your setup actually has a statistical edge.
This is where a stock screener with backtest capabilities changes everything. Instead of guessing which patterns work, you get hard data showing historical win rates, expected value per trade, and maximum drawdown before you risk a single dollar. For day traders and swing traders alike, backtested screening tools transform trading from hopeful pattern recognition into data-driven decision-making.
In this comprehensive guide, you'll learn exactly what to look for when choosing a stock screener with backtest data. We'll cover the essential metrics that separate profitable setups from time-wasters, how to interpret historical performance data, and why combining real-time scanning with proven backtests is crucial for consistent profitability in 2026.
Why Backtesting Matters When Choosing a Stock Screener
Most stock screeners do one thing well: they filter stocks based on criteria you specify. You want stocks above $10 with volume over 1 million shares? Done. Looking for stocks that crossed above their 50-day moving average? Easy. But here's what traditional screeners don't tell you: whether those criteria actually lead to profitable trades.
Without backtest data, you're essentially flying blind. You might screen for stocks breaking out of consolidation patterns, but you have no idea if breakouts in that specific configuration have historically worked. You're making decisions based on theory rather than evidence. This is why so many traders struggle despite using expensive screening tools.
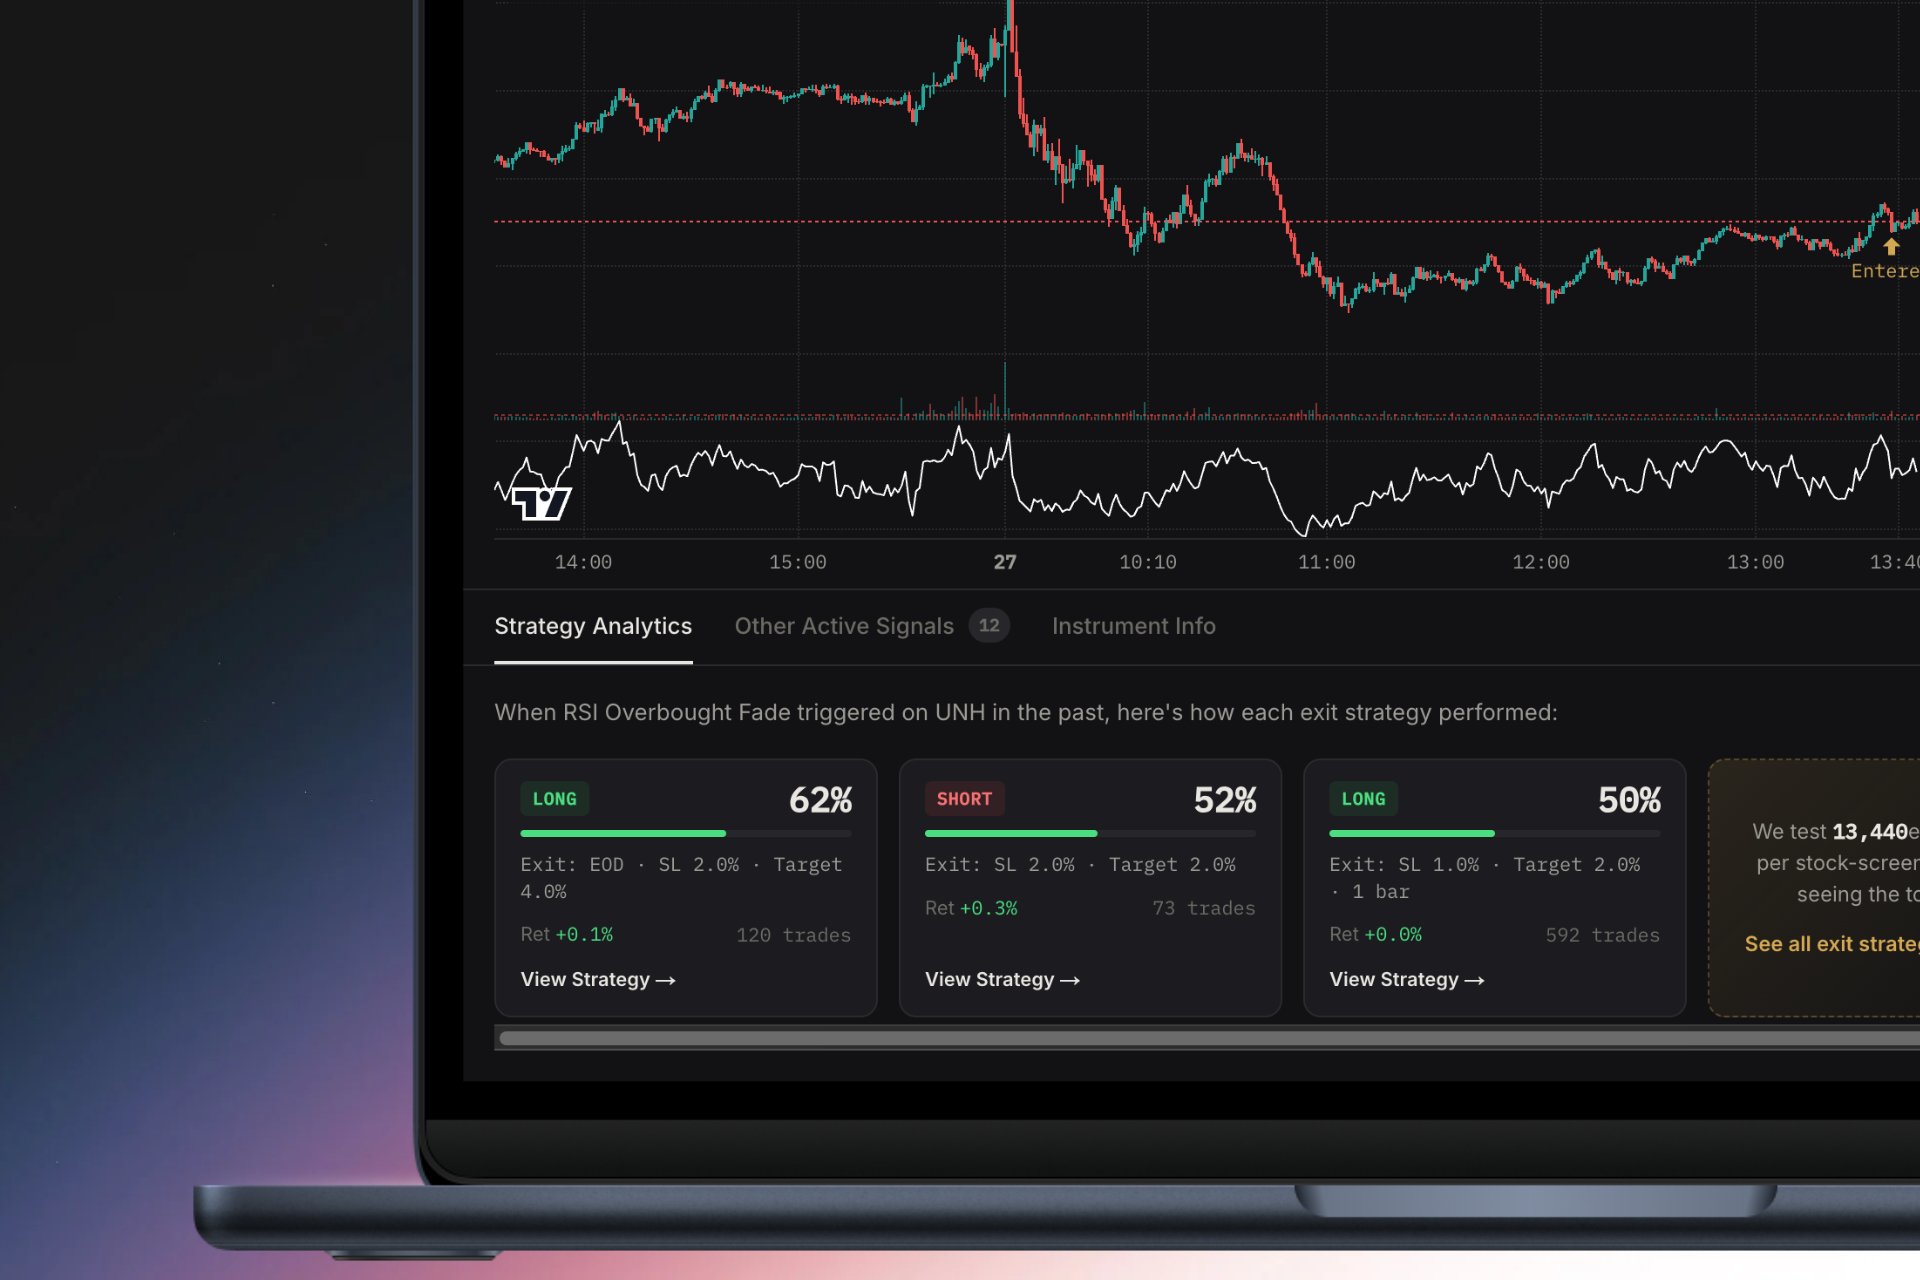
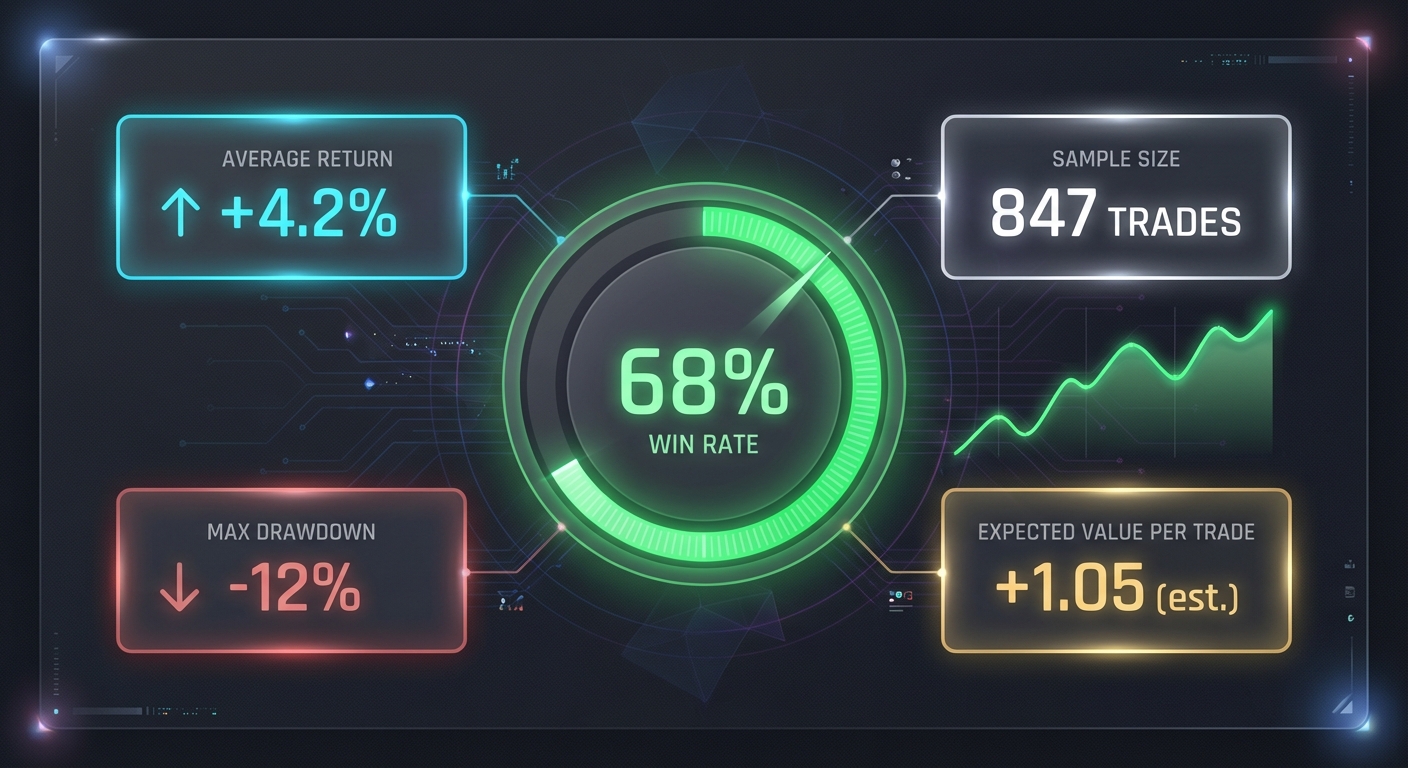
A stock screener with backtest capabilities solves this problem by showing you the historical performance of every technical setup it identifies. When the screener alerts you to an opening range breakout, it also shows you that this particular ORB setup has a 58% win rate over the past 500 occurrences, with an average return of 1.8% on winners and an expected value of $0.42 per $100 risked.
This data validates your trading edge before you risk capital. Instead of hoping a pattern works, you know it works because you can see the historical evidence. This transforms your trading psychology from anxious guessing to confident execution based on statistical probability.
Consider the real cost of trading unvalidated setups. If you take 10 trades per week on patterns that look good but have no proven edge, you might win 4 and lose 6. Even with proper risk management, you're slowly bleeding your account. But if you focus exclusively on setups with proven positive expected value, those same 10 trades might yield 6 winners and 4 losers, with the winners outpacing the losers enough to generate consistent profits.
The difference between these two scenarios isn't luck or skill. It's data. And that's exactly what backtesting strategies provide when integrated into your screening workflow.
1. Evaluate Historical Win Rate and Sample Size
When evaluating a stock screener with backtest data, the first metric most traders look at is win rate. It's intuitive: what percentage of historical trades using this setup were profitable? But win rate alone tells an incomplete story, and without understanding sample size, it can be dangerously misleading.
A statistically significant sample size is crucial for trusting backtest results. If a screener shows you a technical setup with an 80% win rate but only 15 historical occurrences, that data is essentially meaningless. Small sample sizes are vulnerable to random chance and don't account for different market conditions. You need at least 100 occurrences to start trusting the data, and ideally 300+ for high-confidence validation.
When comparing different technical setups, pay attention to how win rates vary across strategies. Opening range breakout setups on high relative volume stocks might show a 55-60% win rate, while VWAP reclaims on the 5-minute timeframe might demonstrate 48-52% win rates. Neither is inherently better. What matters is the combination of win rate, average win size, and average loss size.
Here are the red flags to watch for when evaluating backtest data from stock screeners:
- No sample size disclosed: If the platform doesn't tell you how many historical trades the backtest includes, the data is unverifiable and potentially cherry-picked.
- No lookback period specified: Backtests that don't specify the time period (e.g., "last 2 years" or "500 trading days") could be hiding poor recent performance by including only favorable historical periods.
- Unrealistic win rates: Be skeptical of setups claiming 75%+ win rates unless they're very conservative entries with tight profit targets. Most profitable day trading setups have win rates between 45-65%.
- No losing trades shown: Every legitimate backtest includes drawdown periods and losing streaks. If you only see winners, the data is incomplete or fabricated.
For those learning how to build winning backtesting strategies, understanding these metrics is foundational to developing a systematic trading approach.
Understanding Win Rate vs. Profitability
Here's a critical insight that separates experienced traders from beginners: a 60% win rate doesn't guarantee profitability. In fact, you can have a 70% win rate and still lose money if your risk-reward ratio is upside down.
Let's look at a concrete example. Imagine a momentum breakout setup with a 65% win rate. Sounds great, right? But if the average winner makes $100 while the average loser loses $200, you're actually losing money over time. With 100 trades, you'd have 65 winners earning $6,500 and 35 losers costing $7,000, for a net loss of $500 despite winning nearly two-thirds of your trades.
This is why the relationship between win rate and risk-reward ratio is fundamental. A setup with a 45% win rate can be highly profitable if winners average 3x the size of losers. The math works in your favor: 45 winners at $300 each equals $13,500, while 55 losers at $100 each equals $5,500, for a net profit of $8,000.
When evaluating a stock screener with backtest capabilities, look for platforms that show you both sides of this equation. The best screeners display average win size, average loss size, and the resulting profit factor (total wins divided by total losses). A profit factor above 1.5 indicates a robust edge, while anything below 1.2 suggests the setup is marginal at best.
Watch out for misleading backtest presentations that emphasize win rate while hiding average trade outcomes. Some platforms will prominently display "62% win rate!" while burying the fact that the average winner is barely larger than the average loser, resulting in minimal expected value after commissions and slippage.
2. Analyze Expected Value (EV) Per Trade Metrics
If you could only look at one metric when choosing a stock screener with backtest data, expected value per trade should be it. EV tells you, on average, how much you can expect to make (or lose) every time you take a trade using a specific setup. It's the single most important number for long-term profitability.
Expected value is calculated by multiplying the probability of winning by the average win size, then subtracting the probability of losing multiplied by the average loss size. For example, if a VWAP reclaim setup has a 52% win rate with an average win of $180 and a 48% loss rate with an average loss of $120, the EV is: (0.52 × $180) - (0.48 × $120) = $93.60 - $57.60 = $36 per trade.
That $36 expected value means that over hundreds of trades, you can expect to average $36 profit per trade before commissions. This is your statistical edge, quantified in dollars. With this information, you can make informed decisions about position sizing, risk management, and which setups deserve your attention.
The best stock screener with backtest platforms show you EV across different exit strategies. A momentum breakout might have an EV of $28 per trade with a 1% profit target, $42 per trade with a 2% target, and $31 per trade with a 3% target. This data reveals that the 2% target optimizes profitability for this particular setup, giving you actionable intelligence for your trade management.
Why is positive EV the most important metric for consistent trading? Because it's the only metric that directly predicts long-term profitability. You can have a beautiful chart pattern, perfect technical confluence, and strong conviction, but if the setup has negative expected value, you will lose money over time. Period.
Conversely, a setup with positive EV might not feel exciting on any individual trade. You'll still have losing streaks. You'll still experience frustration. But if you execute consistently with proper position sizing, the math guarantees profitability over a sufficient sample size. This is the essence of professional trading: finding positive EV setups and executing them with discipline.
When comparing stock screeners, prioritize platforms that make EV transparent and easy to understand. The screener should show you not just that a setup has positive EV, but exactly how much, based on what sample size, and across which exit strategies. This level of transparency separates professional-grade tools from basic screeners.
3. Assess Maximum Drawdown and Risk Metrics
Every trading strategy experiences losing streaks. The question isn't whether you'll face drawdowns, but how severe they'll be and whether you can survive them psychologically and financially. This is where maximum drawdown becomes a critical metric when evaluating a stock screener with backtest capabilities.
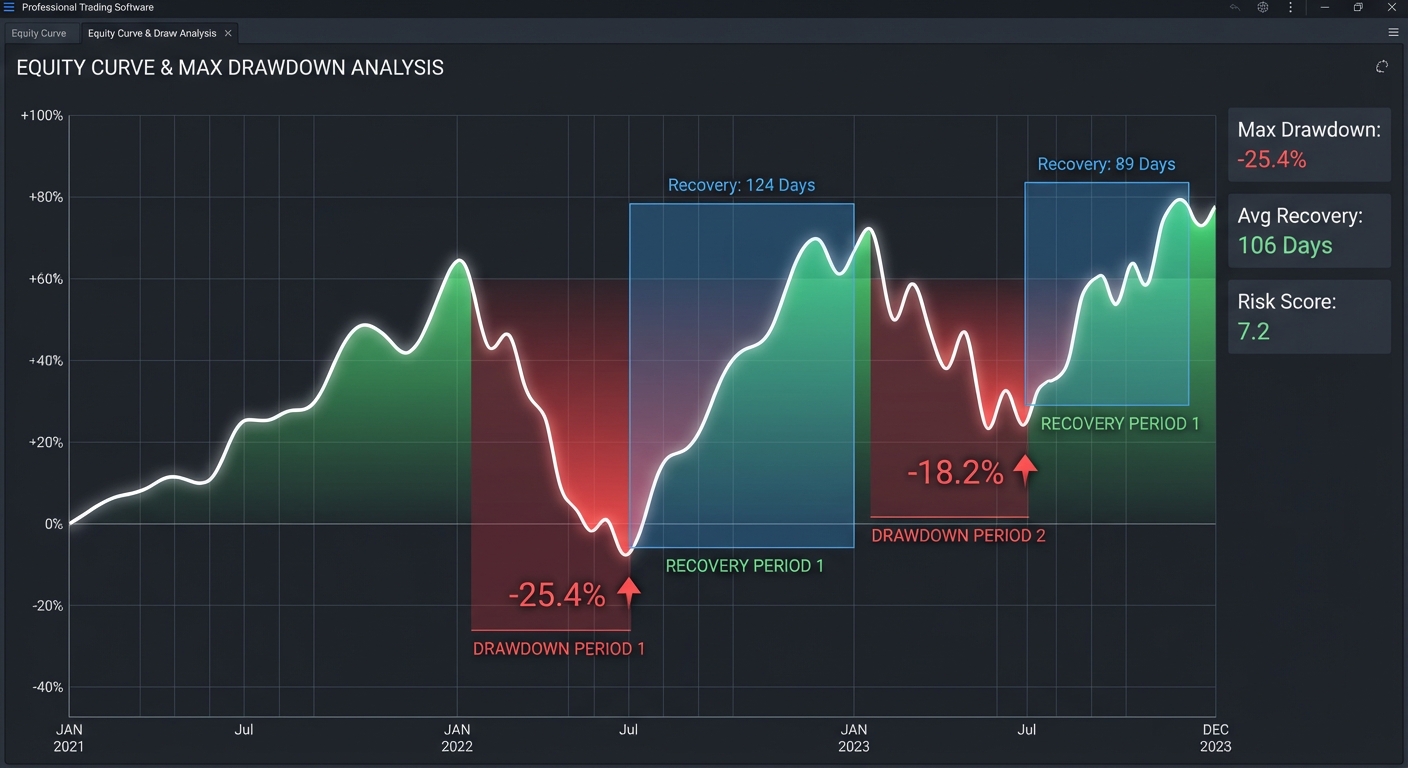
Maximum drawdown measures the largest peak-to-trough decline in account value during the backtest period. If a strategy's equity curve peaked at $15,000 and then dropped to $11,000 before recovering, the maximum drawdown is $4,000 or 26.7%. This tells you the worst-case scenario you would have experienced if you'd traded this setup historically.
Understanding maximum drawdown is essential for proper position sizing and risk management. If a setup has a maximum drawdown of 30%, you need to size your positions so that a 30% drawdown doesn't exceed your personal risk tolerance. For most traders, this means keeping individual position sizes small enough that even a worst-case losing streak won't force you to stop trading.
The best stock screeners show realistic worst-case scenarios rather than cherry-picked favorable periods. Look for platforms that display maximum drawdown alongside average drawdown, drawdown frequency, and recovery time. A setup might have a maximum drawdown of 25% that occurred once over three years, with typical drawdowns around 8-12%. That's very different from a setup with frequent 20%+ drawdowns every few months.
Consecutive loss streaks are another crucial component of risk assessment. A backtest might show 5, 6, or even 8 consecutive losing trades at some point in the historical data. If you're not prepared for that psychologically, you'll likely abandon the strategy right before it recovers. Knowing the historical maximum losing streak helps you set realistic expectations and maintain discipline during inevitable rough patches.
When evaluating backtesting strategies, ask yourself: Could I handle this drawdown without panicking? If the maximum historical drawdown is 35%, and that would cause you to abandon the strategy or make emotional decisions, then the setup isn't right for you regardless of its expected value. Risk tolerance is personal, and the best strategy is one you can actually execute consistently.
Quality stock screeners with backtest data will also show you drawdown metrics across different market conditions. How did the setup perform during the 2022 bear market? What about during low-volatility periods in 2024? Understanding how drawdowns vary with market conditions helps you adjust position sizing and expectations based on the current environment.
4. Verify Real-Time Scanning Capabilities
Historical backtest data is invaluable for validating your edge, but it's only half the equation. The other half is real-time execution. A stock screener with backtest capabilities needs to identify setups as they form during live market hours, not just show you what worked yesterday or last month.
This is where many traders get stuck. They find a screener with excellent backtest data, but it only updates end-of-day. By the time they see the signal, the opportunity has already moved or disappeared entirely. For day traders executing scalps and momentum plays, this delay is fatal. You need real-time alerts the moment a setup triggers.
The importance of real-time alerts becomes obvious when you consider the speed of intraday price action. An opening range breakout on a 5-minute chart might offer a 10-15 minute window for entry before the move is exhausted. A VWAP reclaim could provide a 20-30 minute opportunity. If your screener only updates every 15 minutes or requires manual refreshing, you're missing the majority of tradeable setups.
Multi-timeframe scanning is equally critical. Professional traders monitor multiple timeframes simultaneously: 1-minute charts for precise entries, 5-minute charts for intraday momentum, 15-minute charts for swing setups, and daily charts for longer-term context. A comprehensive stock screener with backtest should scan across all relevant timeframes (1m, 5m, 15m, 1h, daily, weekly) and alert you when setups form on any of them.
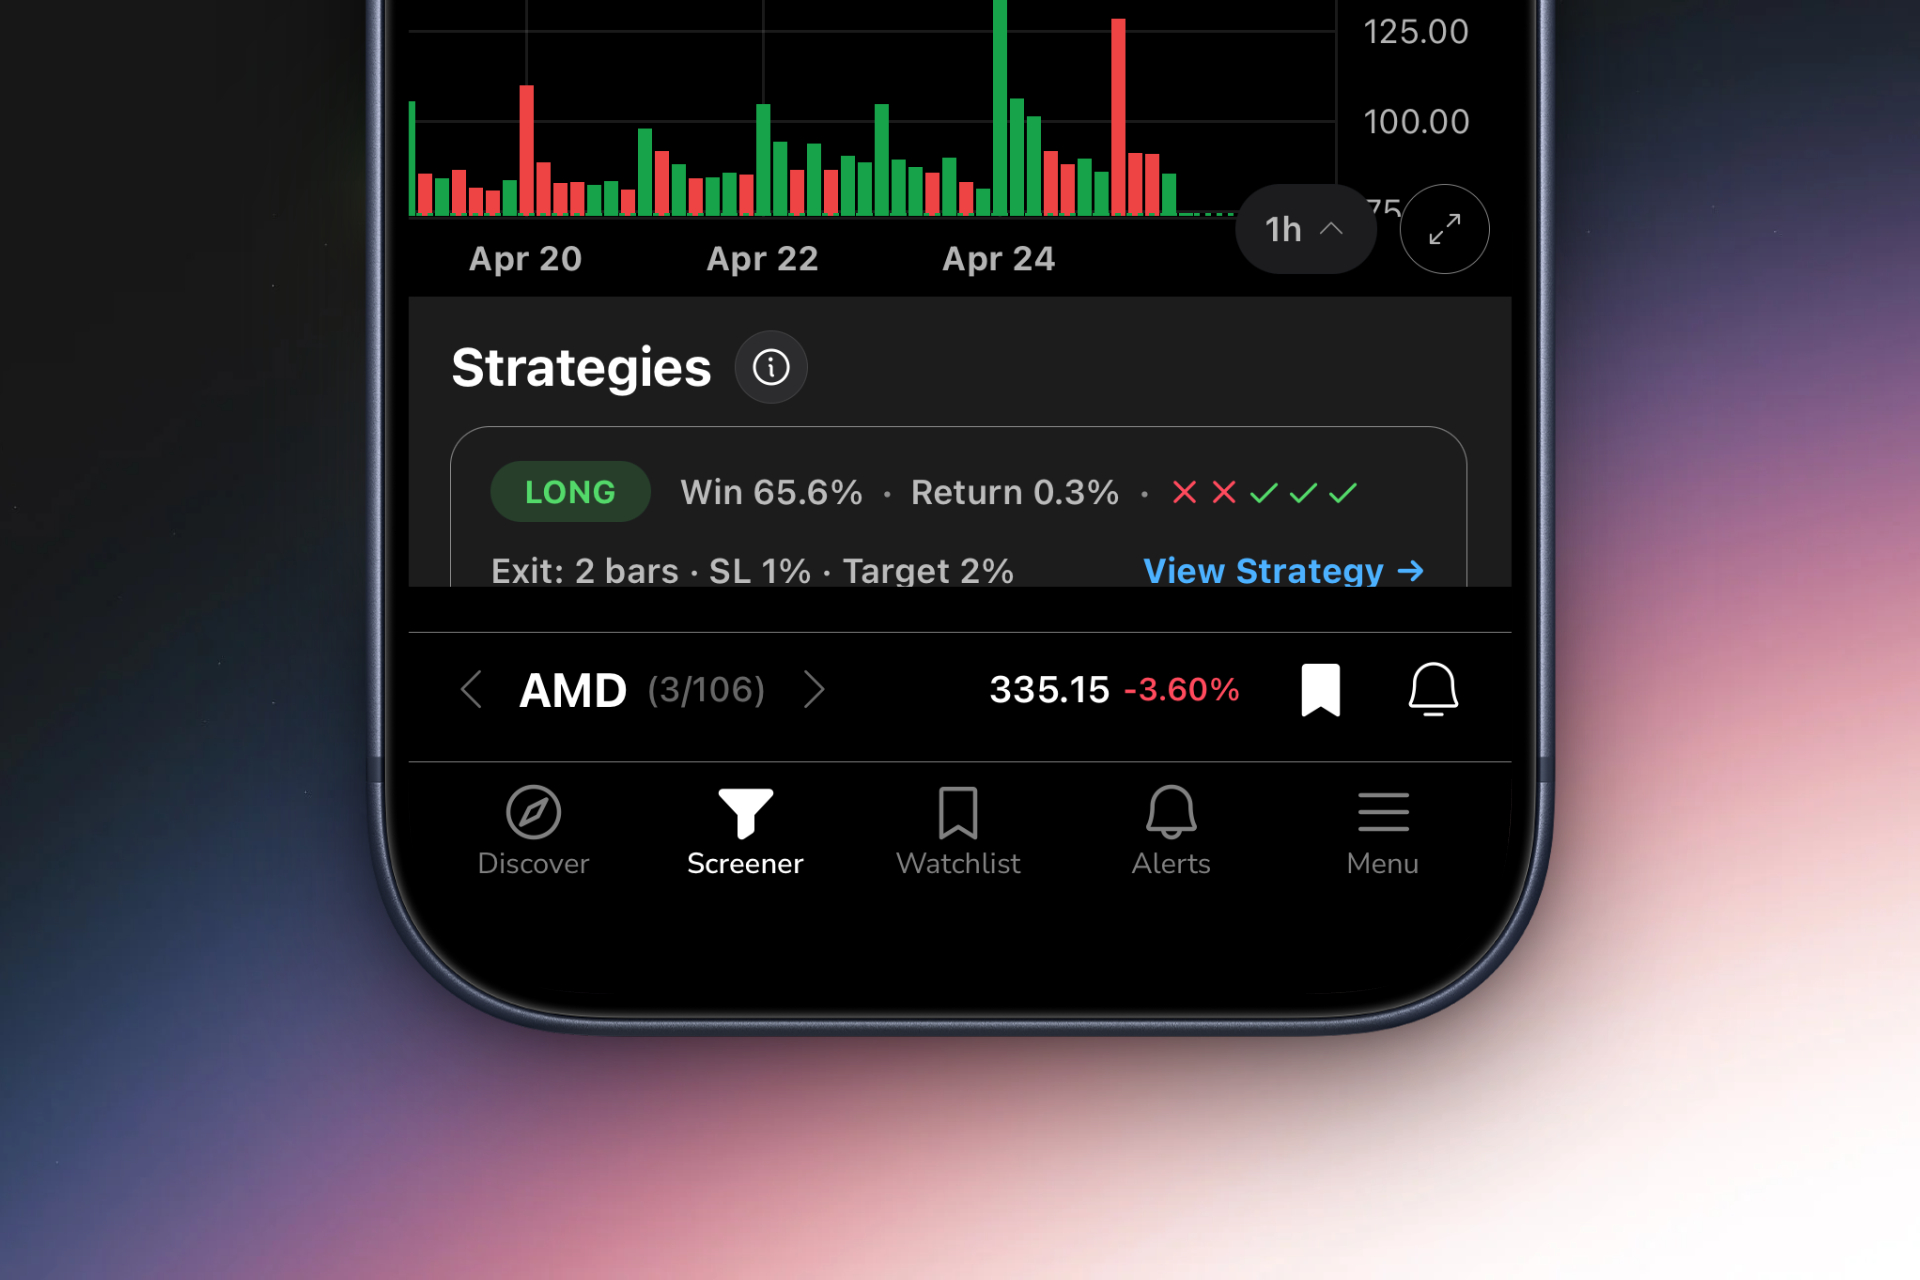
This is where mobile-first platforms deliver significant advantages. Instead of being chained to your desktop, constantly refreshing screeners and monitoring multiple windows, you receive push notifications the moment a backtest-validated setup forms. You're in a meeting? Your phone buzzes with a high-probability ORB setup. You're grabbing lunch? An alert shows you a VWAP reclaim with 56% historical win rate and $38 expected value.
For traders looking to optimize their day trading workflow, the combination of real-time scanning and mobile accessibility is transformative. You're no longer missing opportunities because you stepped away from your desk. The market comes to you, with context and data, exactly when you need it.
Mobile vs. Desktop: Real-Time Alert Delivery
The traditional desktop-centric trading workflow is breaking down. You sit at your computer, running multiple screeners in browser tabs, manually refreshing throughout the day, hoping to catch setups as they form. It's exhausting, inefficient, and guarantees you'll miss opportunities whenever you're not actively watching.
Mobile-first screening platforms flip this model. Instead of you hunting for setups, the setups find you. Push notifications deliver backtest-validated alerts directly to your phone, with all the context you need to make a decision: the technical setup, the timeframe, the historical win rate, the expected value, and a plain-English explanation of why it triggered.
The benefits extend beyond convenience. Mobile platforms designed for trading (not just desktop sites shrunk to fit a phone screen) offer superior user experiences for quick decision-making. Swipe-based interfaces let you rapidly evaluate multiple setups, dismiss low-quality signals, and add high-probability opportunities to your watchlist in seconds.
This doesn't mean abandoning your desktop charting platform. The best workflow combines both: use a mobile stock screener with backtest capabilities for discovery and alerts, then execute trades on your preferred charting platform with full technical analysis. The mobile screener handles the time-consuming work of scanning thousands of stocks across hundreds of technical setups, while you focus on execution and risk management.
Push notifications also solve the alert fatigue problem that plagues desktop-based scanning. Instead of receiving hundreds of generic alerts that you learn to ignore, quality mobile platforms filter signals by historical performance and deliver only high-probability setups. You might receive 5-10 notifications per day instead of 50-100, but each one represents a setup with proven positive expected value.
5. Look for Pre-Built Technical Setups with Proven Data
Building custom screeners from scratch is time-consuming and requires deep technical knowledge. You need to understand which indicators to combine, how to set threshold values, and how to code the logic (often in proprietary languages like Pine Script). For most traders, this is a massive barrier to entry that keeps them from accessing quality screening tools.
This is where curated, pre-built technical setups with proven backtest data become invaluable. Instead of spending hours or days building and testing your own screens, you get immediate access to dozens or hundreds of professionally designed setups, each with transparent historical performance metrics.
The advantage goes beyond time savings. Pre-built screens are typically designed by experienced traders and backtested across years of market data. They've already been optimized for the best combination of win rate, expected value, and drawdown characteristics. You're leveraging collective expertise rather than reinventing the wheel.
When evaluating a stock screener with backtest capabilities, look for these essential technical setups:
- Opening Range Breakout (ORB): Identifies stocks breaking above or below the first 5, 15, or 30 minutes of trading range, often on elevated volume. ORB setups are staples of day trading and can show win rates of 55-62% when combined with relative volume filters.
- VWAP Reclaim: Alerts when price crosses back above the volume-weighted average price after trading below it, signaling potential momentum shift. These setups typically show 48-54% win rates with strong risk-reward ratios.
- RVOL Spikes: Detects unusual volume surges that often precede significant price moves. High relative volume combined with technical setups can improve win rates by 8-12 percentage points.
- Momentum Breakouts: Identifies stocks breaking out of consolidation patterns or resistance levels with strong momentum indicators. These setups vary widely in performance based on timeframe and market conditions.
- Chart Patterns: Recognizes classic technical patterns like bull flags, ascending triangles, and cup-and-handle formations with backtest validation.
The best platforms offer 100+ pre-built screens covering the full spectrum of technical indicators and setups. This gives you the flexibility to focus on strategies that match your trading style, risk tolerance, and schedule. Swing traders can focus on daily timeframe breakouts, while day traders can prioritize 1-minute and 5-minute momentum plays.
Compare this to platforms that require coding knowledge. TradingView, for example, requires Pine Script expertise to build custom alerts. While powerful for advanced users, this creates a steep learning curve that excludes most traders. No-code solutions democratize access to sophisticated screening by making proven setups available to everyone, regardless of technical skill.
For traders interested in specific strategies, resources like our guide on comparing VWAP, RVOL, and ORB indicators can help you understand which pre-built setups align with your trading goals.
ORB, VWAP, and Momentum Breakouts: What the Data Shows
Let's examine what actual backtest data reveals about three of the most popular technical setups. These numbers are based on typical performance across quality stock screener with backtest platforms, though specific results vary based on exact parameters and market conditions.
Opening Range Breakout strategies typically show win rates between 52-60% when filtered for stocks with relative volume above 2.0 and price above $5. The 5-minute ORB tends to outperform the 15-minute version in volatile markets, while the 30-minute ORB shows more consistency in calmer conditions. Expected value per trade ranges from $25-$55 per $100 risked, depending on profit target and stop loss placement.
The key to ORB success is volume confirmation. Breakouts on weak volume show win rates 15-20 percentage points lower than those with strong RVOL. This is why the best screeners combine multiple filters rather than relying on a single indicator.
VWAP reclaim performance varies significantly across different market conditions and timeframes. On 5-minute charts, VWAP reclaims show win rates around 48-52%, with the edge coming from favorable risk-reward ratios rather than high win percentage. The setup works best in trending markets and tends to underperform during choppy, range-bound conditions.
Interestingly, VWAP reclaims combined with other technical confluence (like reclaiming VWAP at a prior support level) can boost win rates to 58-64%. This demonstrates the value of screeners that identify multi-factor setups rather than single-indicator signals.
Momentum breakouts are perhaps the most variable in performance, with win rates ranging from 42% to 68% depending on how the setup is defined. Breakouts from tight consolidation patterns on high volume tend to perform best, while breakouts from loose, choppy ranges often fail. The difference in expected value can be dramatic: $60+ per trade for high-quality breakouts versus negative EV for poorly defined ones.
This variability is exactly why backtest data matters so much. Without historical performance metrics, all breakouts look roughly the same on a chart. With backtest data, you can distinguish between high-probability setups with proven edges and low-probability patterns that waste your time and capital.
6. Ensure Contextual Alerts with Plain-English Explanations
Alert fatigue is one of the most underestimated problems in modern trading. You set up alerts for dozens of stocks and technical conditions, and soon your phone is buzzing constantly with notifications. Most of them are noise. You start ignoring alerts, and eventually miss the few high-quality signals buried in the spam.
This is where context and quality filtering become essential features in a stock screener with backtest platform. Instead of receiving every alert that meets basic technical criteria, you receive only alerts that meet historical performance thresholds. The screener might scan 200+ technical setups across thousands of stocks, but only notify you about the 5-10 highest-probability opportunities each day.
Equally important is understanding why each signal triggered. A notification that says "AAPL - Breakout Alert" tells you almost nothing. Did it break out of a consolidation pattern? Above VWAP? Through a resistance level? On what timeframe? With what historical win rate?
Quality screeners provide plain-English explanations with every alert: "TSLA reclaimed VWAP on the 5-minute chart with RVOL 3.2x. This setup has a 54% win rate over 287 historical occurrences, with an expected value of $41 per $100 risked using a 2% profit target." Now you have context. You understand the setup, the timeframe, the statistical edge, and the recommended exit strategy.
This level of detail improves decision-making in two ways. First, it helps you quickly assess whether the opportunity aligns with your trading plan and risk tolerance. Second, it serves an educational function, teaching you which combinations of factors create high-probability setups. Over time, you develop intuition for what makes a quality trade, even without looking at the backtest data.
For traders learning technical analysis, this educational value is transformative. Instead of reading abstract explanations of how VWAP works, you see real-time examples with historical performance data. You learn by doing, with the safety net of knowing which setups have proven edges. This accelerates the learning curve from months or years down to weeks.
When comparing stock screeners, test the alert quality. Sign up for a trial or free tier and observe the notifications you receive. Are they actionable? Do they provide context? Do they filter out noise? Or are you drowning in generic alerts that all look the same? The difference between these experiences is the difference between a tool that enhances your trading and one that adds to your stress.
7. Compare Stock Screener with Backtest Platforms
Not all stock screeners are created equal, and the differences become stark when you compare basic filtering tools to comprehensive platforms with integrated backtesting. Understanding these distinctions helps you choose the right tool for your trading style and budget.
Here are the key features that separate basic screeners from backtest-enabled platforms:
Basic screeners (like free Finviz) offer fundamental and technical filters with end-of-day data. You can screen for stocks above certain price or volume thresholds, but you get no information about whether those criteria lead to profitable trades. There's no real-time scanning, no mobile alerts, and no historical performance data. These tools are useful for building watchlists but don't help with trade timing or validation.
Advanced screeners without backtesting (like TradingView's screener) add real-time data and custom alert capabilities, but still don't show historical performance. You can build sophisticated screens using technical indicators, but you're on your own to determine whether they actually work. This requires coding knowledge (Pine Script) and manual backtesting, which most traders don't have time or expertise to do properly.
Stock screener with backtest platforms combine real-time scanning with transparent historical performance data. Every technical setup shows win rate, expected value, sample size, and drawdown metrics. You get mobile alerts when high-probability setups form, with context explaining why each signal triggered. This is the category that transforms screening from guesswork into data-driven trading.
Pricing considerations vary widely. Basic screeners are often free or low-cost ($10-30/month). Advanced platforms without backtesting range from $15-60/month. Comprehensive screeners with integrated backtesting typically cost $40-120/month, though some offer free tiers with limited features.
The user experience differs dramatically between desktop-only and mobile-first platforms. Desktop tools require you to be at your computer, actively monitoring screens. Mobile-first platforms deliver opportunities to your phone wherever you are, with interfaces optimized for quick decision-making on small screens. For traders with day jobs or busy schedules, this difference is often worth the entire subscription cost.
Integration with existing charting platforms is another consideration. The best workflow uses a stock screener with backtest capabilities for discovery and validation, then executes trades on your preferred charting platform (TradingView, ThinkorSwim, etc.). Look for screeners that complement rather than replace your existing tools.
How ChartMath Combines Screening and Backtesting
ChartMath represents a new generation of trading tools that integrate screening, backtesting, and mobile-first design into a unified platform. Instead of juggling multiple tools and manually validating setups, you get everything in one place.
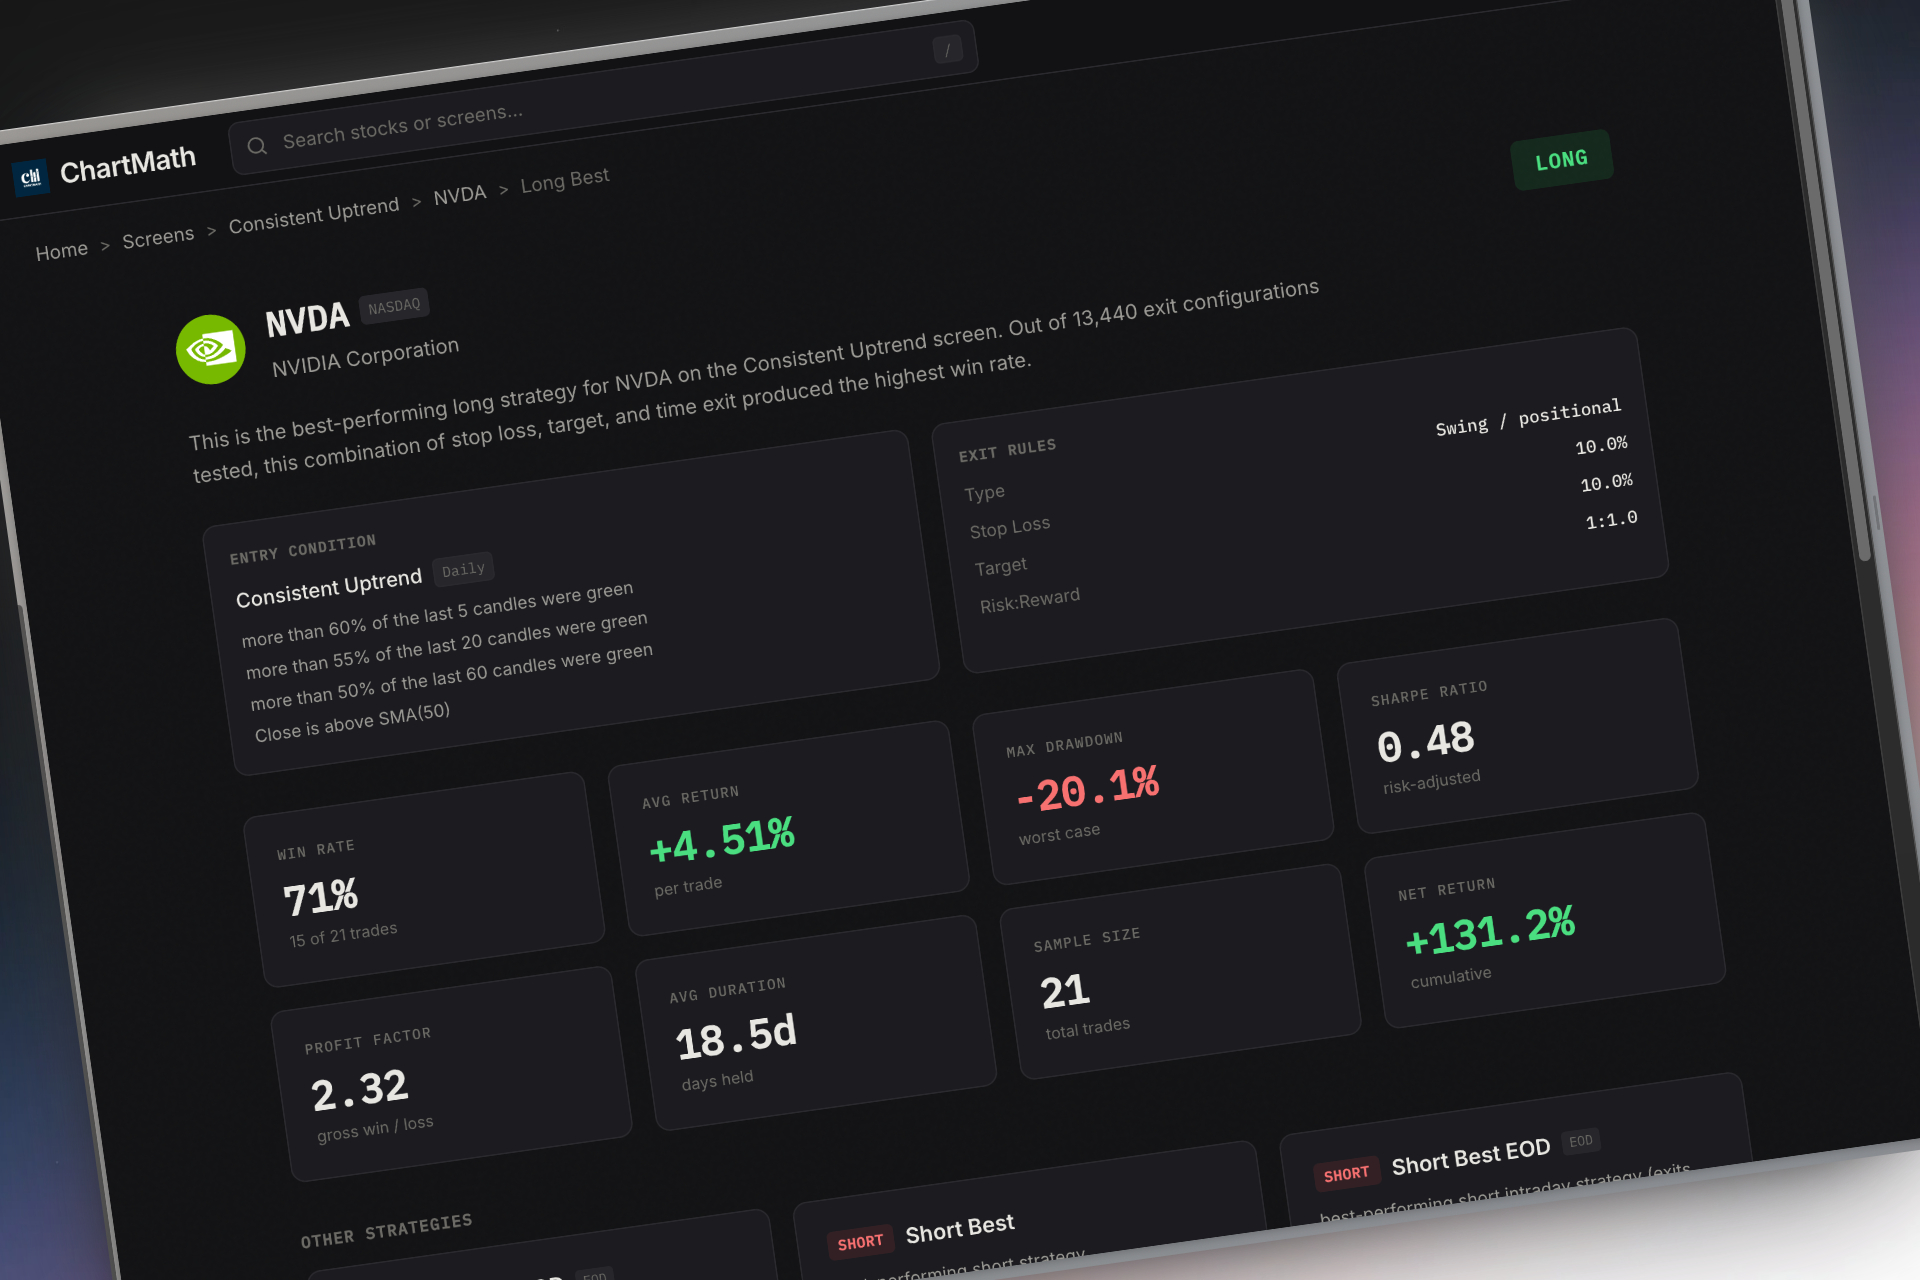
The platform offers 200+ pre-built technical screens covering the full spectrum of day trading and swing trading setups: ORB, VWAP, RVOL, momentum breakouts, chart patterns, and more. Each screen includes transparent historical performance data showing win rate, expected value per trade, maximum drawdown, and sample size. You know exactly what edge you're trading before you enter a position.
The TikTok-style swipe interface makes discovering high-probability setups effortless. Instead of scrolling through endless lists or refreshing multiple browser tabs, you swipe through ranked trading opportunities sorted by quality and freshness. Each card shows the stock, the technical setup, the timeframe, and the backtest metrics. Swipe right to add to your watchlist, swipe left to dismiss. It takes seconds to evaluate dozens of potential trades.
Real-time alerts deliver backtest-validated opportunities directly to your phone the moment they form. You're not tied to your desktop, constantly monitoring screens. The platform scans the market continuously across all timeframes (1m, 5m, 15m, 1h, daily, weekly) and notifies you only when high-probability setups trigger. Each alert includes plain-English context explaining why it triggered and what the historical performance data shows.
The mobile-first design is purpose-built for traders on the go. Whether you're in a meeting, commuting, or grabbing coffee, you can discover and evaluate trading opportunities in the time it takes to check your phone. The platform complements your existing charting tools rather than replacing them. Use ChartMath for discovery and validation, then execute on your preferred platform with confidence.
For traders looking to build an efficient trading workflow, ChartMath eliminates the most time-consuming parts of the process: scanning thousands of stocks, validating technical setups, and monitoring for entry signals. You focus on what matters: execution and risk management.
Making Data-Driven Trading Decisions with Backtest-Validated Screeners
The difference between profitable and unprofitable trading often comes down to one thing: knowing your edge. Not hoping you have an edge. Not believing you have an edge. Knowing you have an edge because you can see the historical data that proves it.
This is what a stock screener with backtest capabilities provides. Instead of trading patterns that look good on a chart, you trade setups with proven statistical edges. You know the win rate, the expected value, the maximum drawdown, and the sample size. You understand which exit strategies optimize profitability and which market conditions favor each setup.
Let's recap the essential features to look for when choosing a backtest-enabled screener:
- Historical win rates with significant sample sizes (300+ occurrences minimum) across multiple market conditions
- Expected value per trade metrics showing exactly how much you can expect to make on average with each setup
- Maximum drawdown and risk metrics revealing worst-case scenarios and helping you size positions appropriately
- Real-time scanning capabilities that alert you the moment high-probability setups form, not hours later
- Pre-built technical setups covering ORB, VWAP, RVOL, momentum breakouts, and chart patterns without requiring coding knowledge
- Contextual alerts with plain-English explanations that help you understand why each signal triggered and what the edge is
- Mobile-first design that delivers opportunities to your phone wherever you are, not just when you're at your desk
Validating your trading edge before execution is the foundation of professional trading. Amateur traders hope their setups work. Professional traders know their setups work because they've seen the data. This psychological shift from uncertainty to confidence transforms your trading performance.
The importance of combining real-time scanning with proven historical data cannot be overstated. Historical data without real-time execution leaves you watching opportunities pass by. Real-time scanning without historical validation has you chasing every signal, including the ones with negative expected value. You need both working together.
For traders ready to move beyond guesswork and start making data-driven decisions, the next step is testing a backtest-enabled screener in your actual trading workflow. Start with a free tier or trial period. Observe the alerts you receive. Compare the backtest data to your own trading results. See if the historical win rates and expected values hold up in live trading.
You'll likely find that some setups work better for your style and schedule than others. Maybe you excel at ORB trades but struggle with VWAP reclaims. Perhaps 5-minute momentum breakouts fit your risk tolerance better than 1-minute scalps. The beauty of a comprehensive stock screener with backtest platform is that you can test different strategies with real data, find what works for you, and focus exclusively on your highest-probability setups.
The market rewards traders who make decisions based on evidence rather than emotion. Backtest-validated screening gives you that evidence. Every alert comes with historical context. Every setup shows you the statistical edge. Every trade becomes a calculated bet with known probabilities rather than a hopeful guess.
Ready to experience the difference that backtest-validated screening makes in your trading? Watch a demo to see how ChartMath combines 200+ pre-built technical screens with transparent historical performance data, delivered through a mobile-first interface designed for traders on the go. Or download the app and start discovering high-probability setups with proven edges today. You can also access the web-based screener to explore the full platform from your desktop.
Stop trading blind. Start trading with data. Your future profitable self will thank you.
Ankush Jindal
Co-Founder, ChartMath
Ankush Jindal is the Co-Founder of ChartMath, a real-time trade discovery platform that monitors 200+ technical screens across the market to surface actionable setups for technical traders. He holds a B.Tech in Computer Science from IIT Mandi. Before ChartMath, he co-founded two successful technology ventures spanning hundreds of thousands of users. This experience building data-intensive, real-time systems directly shaped his approach to technical analysis tooling. At ChartMath, Ankush leads product vision, designing intuitive interfaces that translate complex price action into clear, backtested signals. His philosophy: trading decisions should be backed by data, not gut feeling.
LinkedInSee these setups live in ChartMath
200+ curated screens with backtest data. Free to use.
Related Articles
How to Use an RSI Divergence Screener to Find Reversals
Learn how to use an RSI divergence screener to automatically identify bullish and bearish divergence patterns that signal high-probability trend reversals.
How to Choose the Best Stock Screening App in 2026
Learn how to choose the best stock screening app for technical trading. Compare real-time scanning, backtested strategies, mobile alerts, and more.
Premarket Trading: 7 Strategies to Find High-Probability Setups
Master premarket trading with proven strategies using RVOL, gap scanners, and momentum signals. Learn to identify high-probability setups before the bell.