Table of Contents
You've refreshed Finviz 47 times today. You've got three TradingView alerts firing every 30 seconds, most of them for stocks you don't even trade. And somehow, the one setup you actually wanted to catch — that clean ORB breakout at 9:45 AM — happened while you were in a meeting. Sound familiar? Choosing the right stock screener app isn't just a convenience decision. It's a trading performance decision. The wrong tool costs you entries, drowns you in noise, and eats hours you could spend actually trading. This guide walks you through exactly how to evaluate and choose the best stock screener app for your trading style in 2026, whether you're a day trader, swing trader, or just getting started with technical analysis.
Why Your Stock Screener App Can Make or Break Your Trading
Most traders underestimate how much their screening tool shapes their results. A stock screener app isn't just a filter — it's the front door to every trade you take. If the door is broken, you miss opportunities. If it's too wide open, you get flooded with garbage. The best stock screener acts as a force multiplier: it finds high-probability setups across the entire market so you can focus your energy on execution, not discovery.
The hidden costs of a bad screener add up fast. Alert fatigue leads to ignoring notifications entirely, which means you miss the good ones along with the bad. Manual chart scanning burns 2-3 hours a day that could go toward research or rest. And without backtest data, you're trading setups you can't validate, essentially flying blind. A well-chosen stock screener app eliminates all three problems at once.
In this guide, you'll learn how to match a screener to your trading style, what separates signal from noise in alert quality, why backtest transparency matters, and how to build a practical evaluation framework before you commit to any platform.
1. Identify Your Trading Style Before Choosing a Stock Screener App
The single biggest mistake traders make when shopping for a stock screener app is choosing based on features alone without asking: does this tool fit how I actually trade? A screener built for swing traders will frustrate a day trader, and vice versa. Start here before you look at anything else.
Day Traders: Speed and Real-Time Scanning Are Non-Negotiable
If you're executing intraday momentum plays, scalps on the 1-minute chart, VWAP reclaims on the 5-minute, ORB breaks at the open, you need a screener that scans in real time. You're looking for RVOL spikes, opening range breakouts, and momentum surges as they happen, not 15 minutes later. A screener that updates every few minutes is essentially useless for intraday trading. You also need push alerts delivered to your phone, because you can't stare at a desktop all day. Check out how to use stock screeners for day trading in 2026 for a deeper breakdown of intraday screening tactics.
Swing Traders: End-of-Day Signals and Multi-Day Setups
Swing traders operate on a different clock. You're looking for breakouts from consolidation, 52-week highs, and momentum divergences on daily and weekly charts. You don't need real-time alerts firing every minute, you need reliable end-of-day signals delivered before market close so you can review setups on your own schedule. If you're managing positions around a full-time job, a screener that respects your time is essential. Swing trading for busy professionals covers how to build a 30-minute daily routine around quality signals.
Beginners: Pre-Built Screens and Plain-English Explanations
If you're new to technical analysis, the last thing you need is a screener that requires you to write code or understand 50 different filter parameters before you see a single result. Beginners need pre-built technical screens that work out of the box, plain-English explanations of why a setup triggered, and backtest data that shows whether the pattern actually has an edge. The goal is to learn while you trade, not spend six months building a screener before you ever place a trade.
2. Real-Time Scanning vs. End-of-Day Screening: Know the Difference
Not all stock screener apps scan the market the same way, and the difference matters enormously depending on your strategy. Understanding this distinction will save you from buying the wrong tool.
Real-time scanners continuously monitor price action, volume, and technical indicators throughout the trading day. When a stock triggers a condition, say, a VWAP reclaim on the 5-minute chart with above-average relative volume, the screener fires an alert immediately. This is what day traders and momentum traders need. Platforms like ChartMath scan across 200+ pre-built technical setups continuously, covering ORB breaks, VWAP reclaims, RVOL spikes, and momentum indicators across multiple timeframes (1m, 5m, 15m, 1h, daily, weekly).
End-of-day screeners like Finviz update their data after the market closes. They're useful for swing traders building watchlists overnight, but they're completely blind to intraday momentum. If you're trying to catch a breakout at 10:30 AM, an end-of-day screener won't help you. For premarket momentum plays, the gap is even more critical, learn more in premarket trading strategies for high-probability setups.
The bottom line: match the screener's scanning frequency to your trading timeframe. Real-time for intraday, end-of-day for swing setups, or a platform that handles both.
3. Evaluate Alert Quality: The Difference Between Signal and Noise
Here's a truth most screener vendors won't tell you: more alerts is not better. Alert fatigue is one of the most common reasons traders abandon their screening tools. When your phone buzzes 200 times a day with low-quality notifications, you start ignoring all of them, including the good ones. The best stock screener app sends fewer, smarter alerts.
What Makes an Alert High Quality?
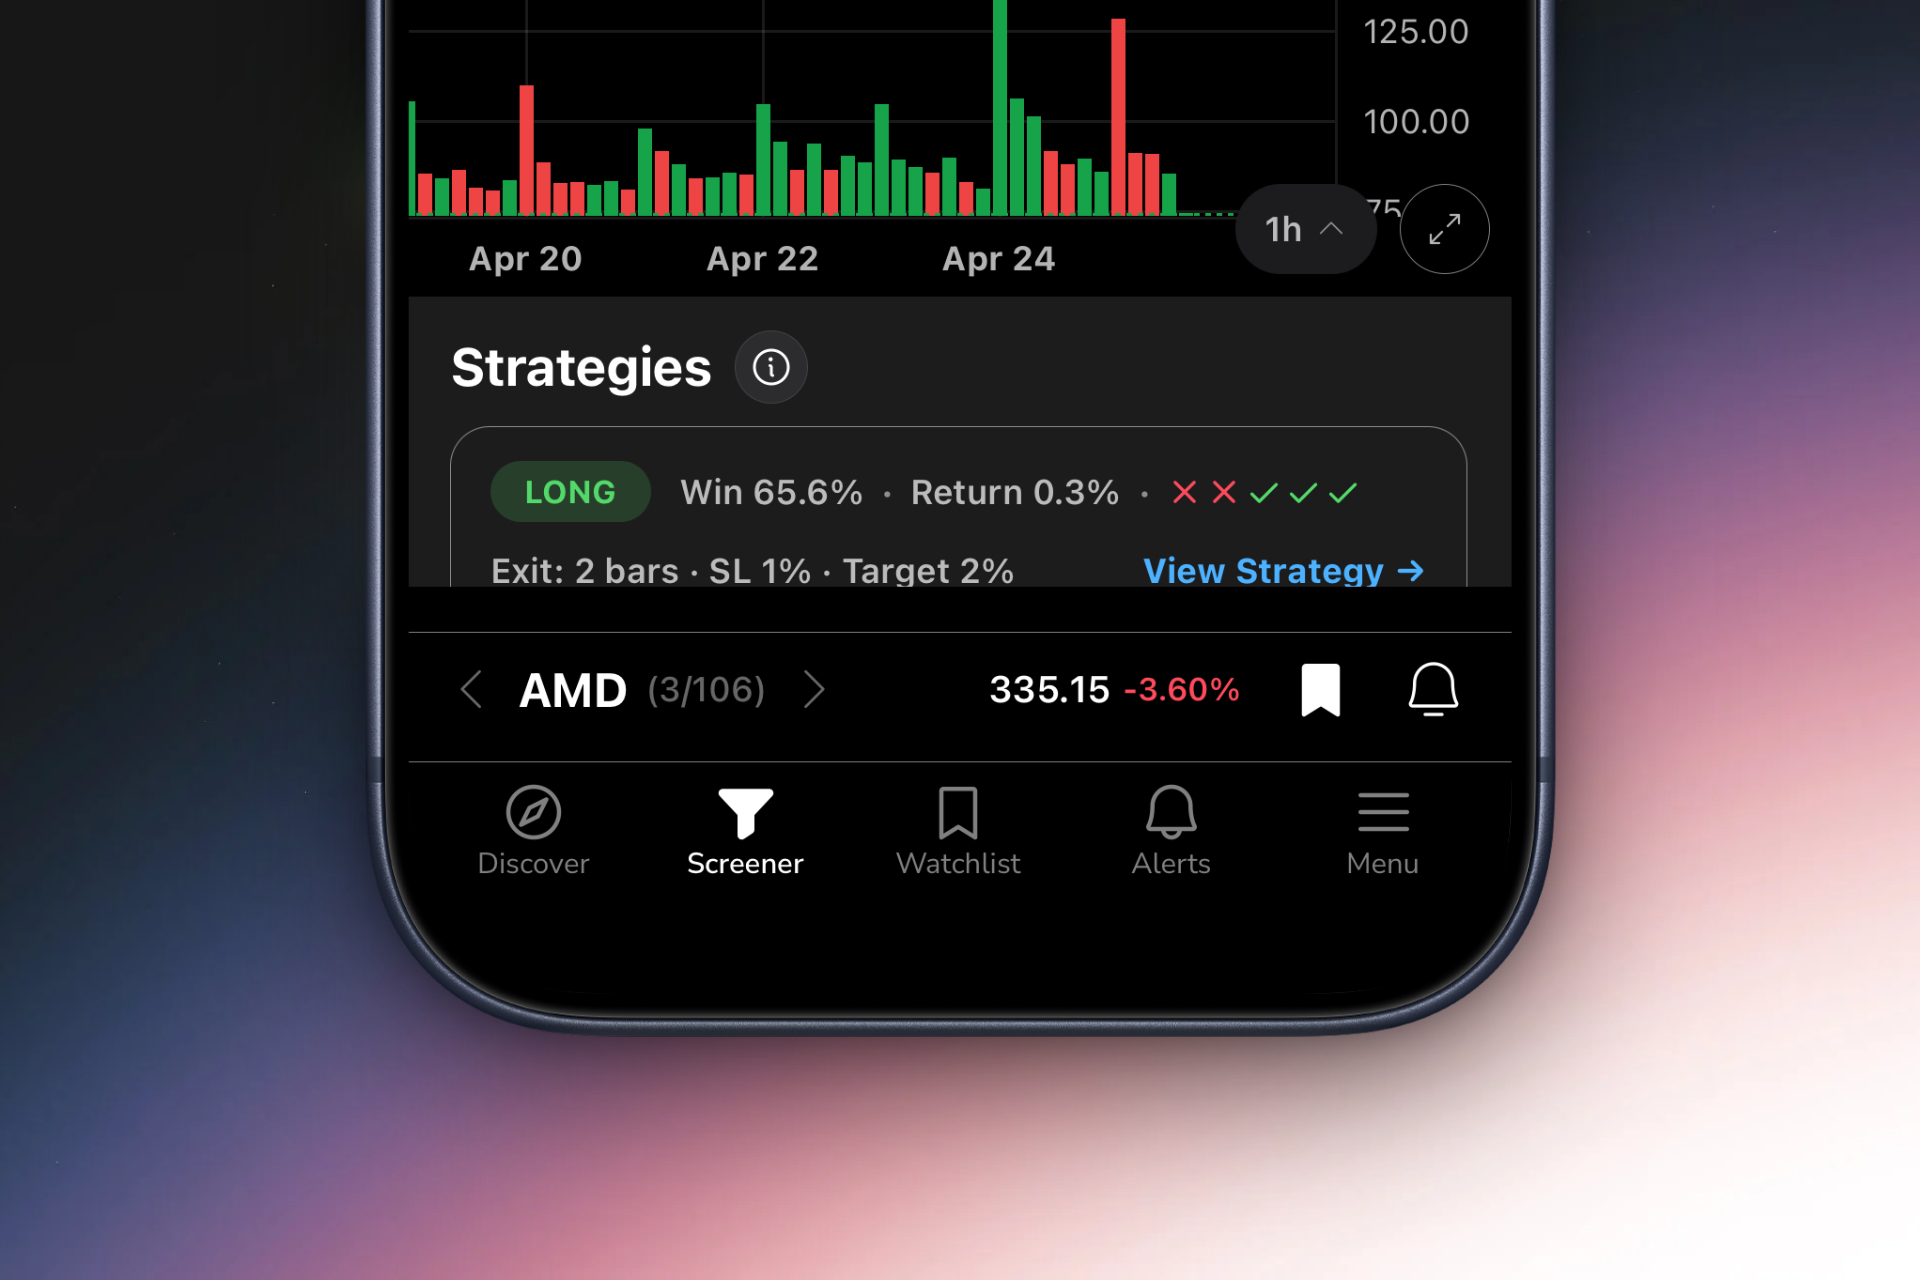
A high-quality trading alert does three things. First, it tells you what happened: the ticker, the setup, and the timeframe. Second, it tells you why it matters: what technical condition triggered, and what the historical edge looks like for that setup. Third, it delivers that information in plain English, not a wall of indicator jargon. An alert that says "NVDA triggered a VWAP reclaim on the 5-minute chart, this setup has a 64% win rate over the last 200 occurrences" is infinitely more actionable than one that just says "NVDA alert."
ChartMath's intelligent push alerts are built around this philosophy. Every alert includes a plain-English explanation of why the setup triggered and the backtest data behind it, so you know the edge before you decide to act. That's a fundamentally different experience from platforms that spam you with raw price alerts and leave the analysis to you. For a deeper look at integrating alerts into your workflow, see how to integrate trading alerts with your charting platform.
Push Alerts vs. Email vs. In-App Notifications
For active traders, push notifications to your smartphone are the gold standard. Email alerts are too slow for intraday setups, by the time you open the email, the entry is gone. In-app notifications only work if you're already inside the app. A stock screener app with reliable push alerts lets you catch setups while you're away from your desk, in a meeting, or on the go. This is where mobile-first design becomes a genuine competitive advantage.
4. Demand Backtest Data for Every Technical Setup
This is the feature most traders overlook, and it might be the most important one. When a stock screener app fires an alert, do you know if that setup actually works? Not in theory, in practice, with real historical data? If the answer is no, you're trading on faith, not evidence.
What Backtest Transparency Looks Like
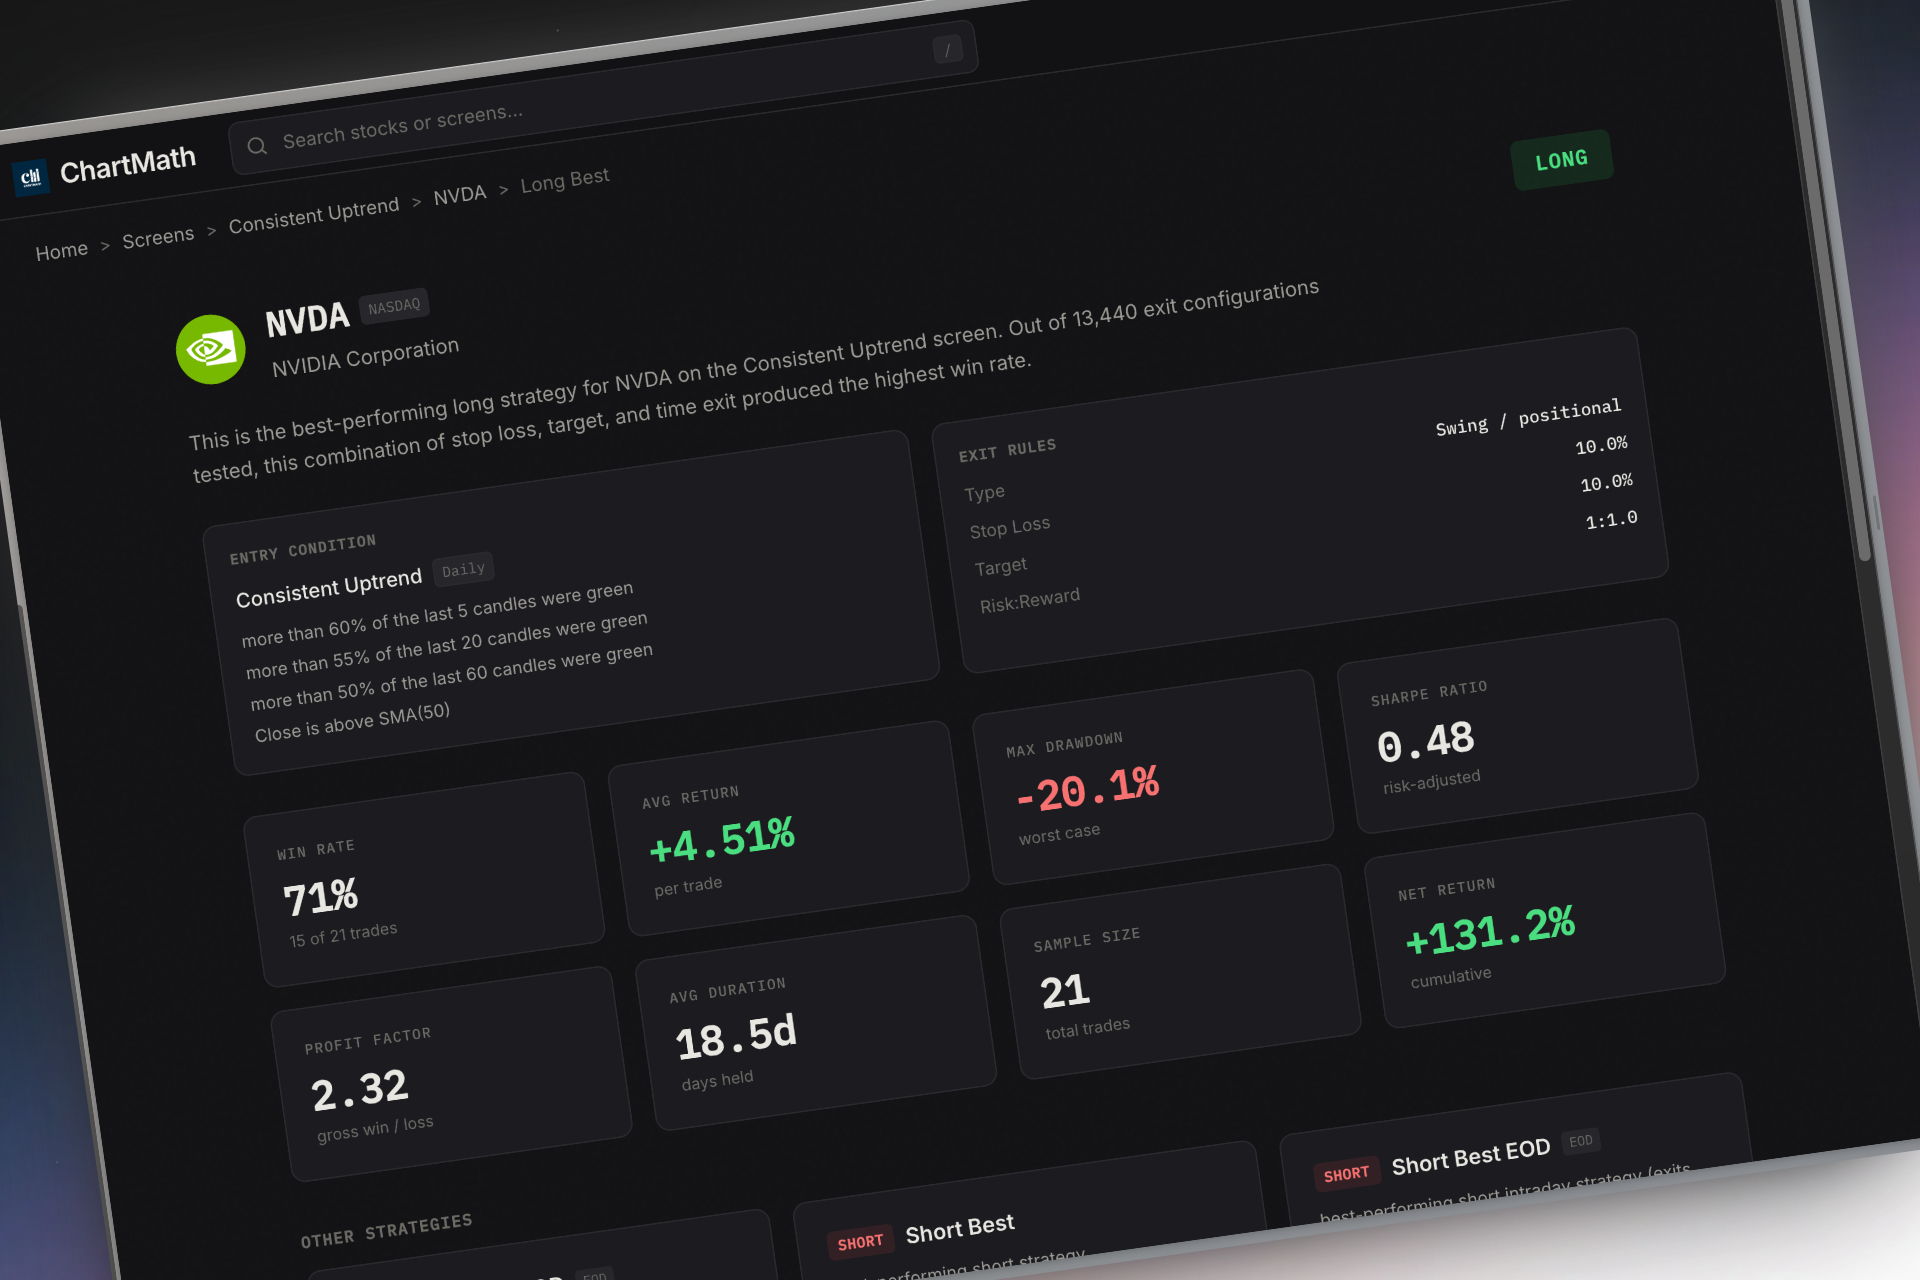
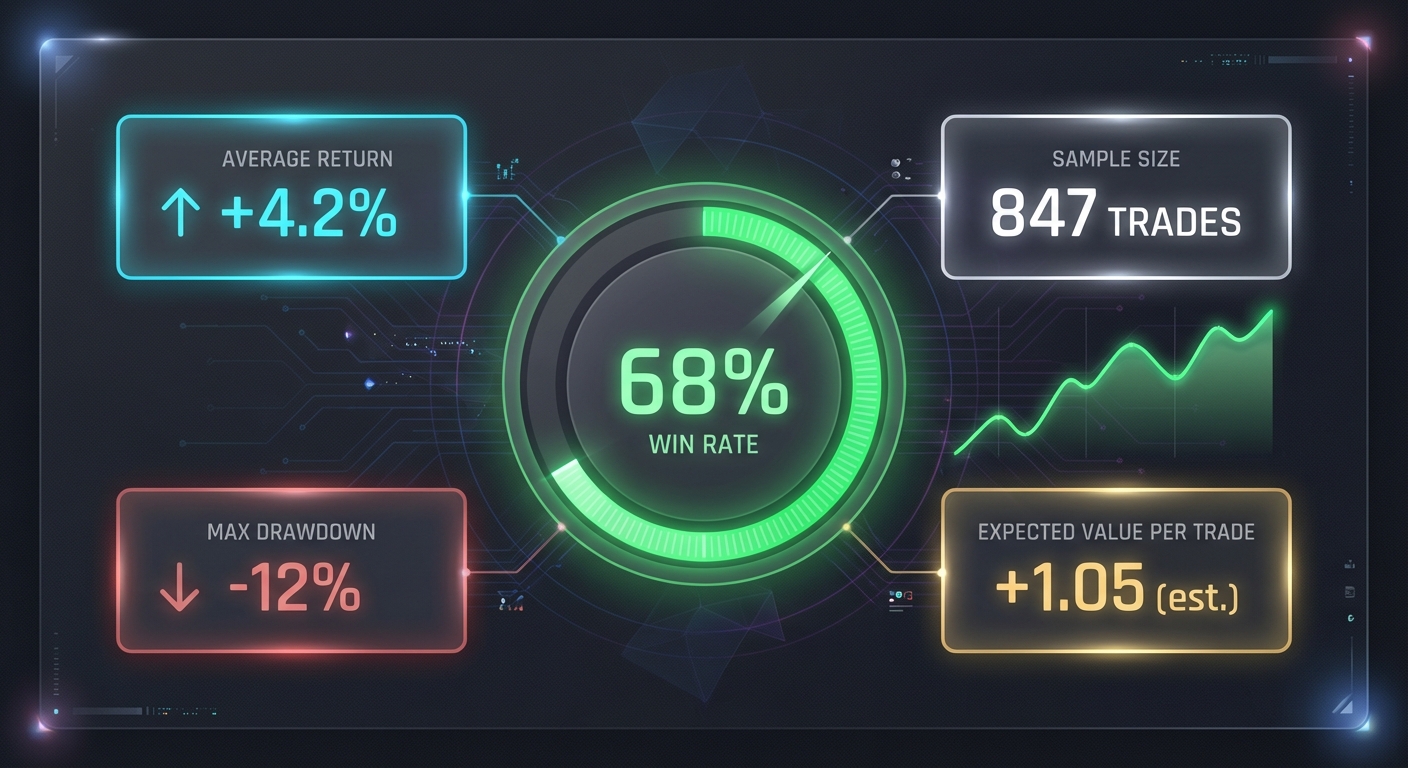
Good backtest data for a technical setup should include at minimum: win rate (percentage of trades that were profitable), average return per trade, maximum drawdown, and sample size (number of historical occurrences). A setup with a 70% win rate based on 12 trades is very different from one with a 65% win rate based on 500 trades. Sample size matters as much as the headline number.
Platforms that use black-box AI scoring, giving you a "confidence score" of 82 without explaining what that means or how it was calculated, are doing you a disservice. You can't evaluate an edge you can't see. Transparent backtest data lets you make informed decisions about which setups fit your risk tolerance and trading style. For a comprehensive look at building and evaluating backtested strategies, see how to build winning backtesting strategies.
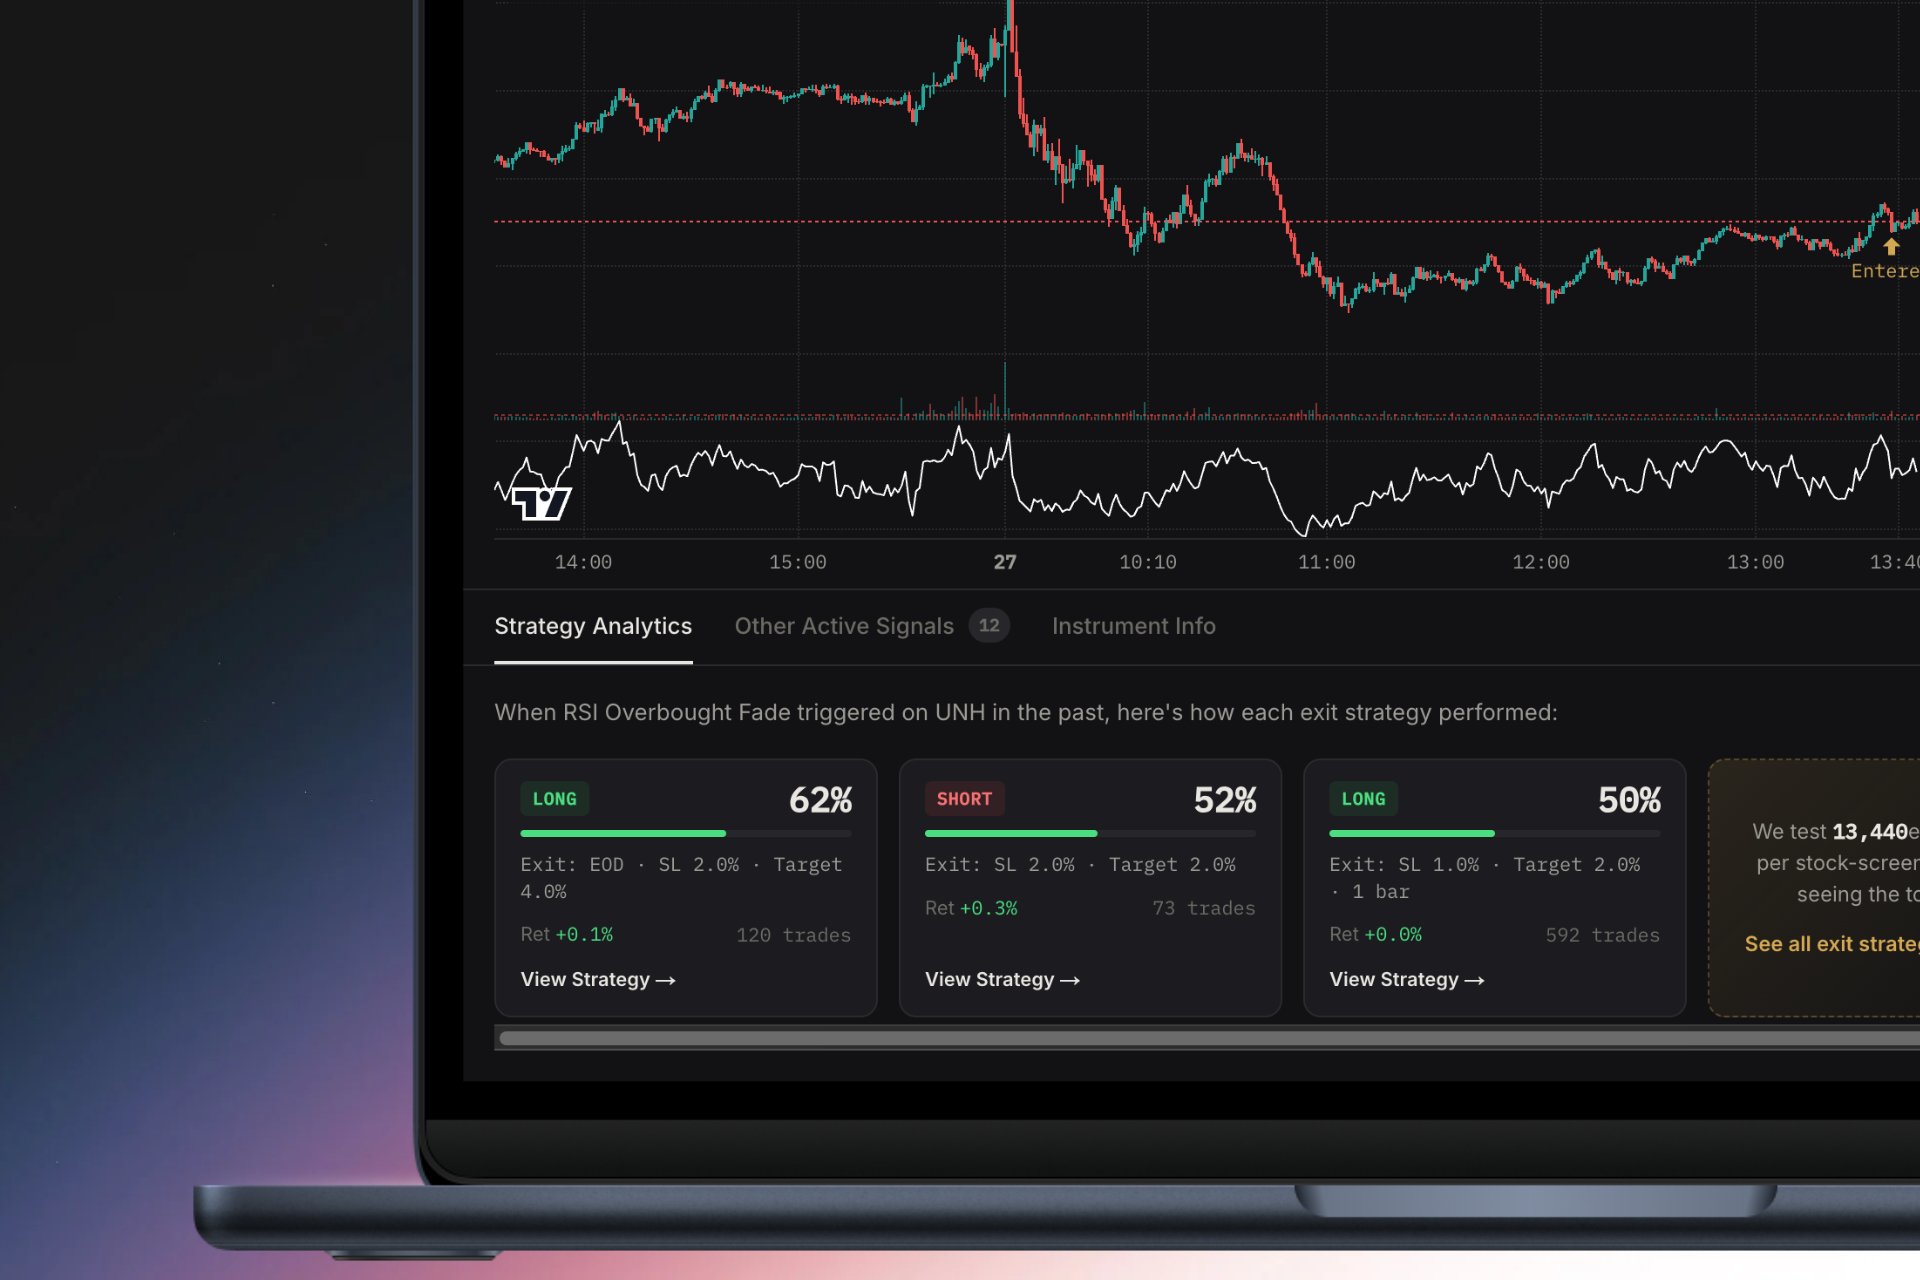
How ChartMath Handles Backtest Data
ChartMath provides historical performance data for every one of its 200+ pre-built technical screens. When a setup triggers an alert, you can see the win rate, average return, and drawdown statistics for that specific pattern, not a generic score, but actual data tied to the exact setup that fired. This transparency is what separates a stock screener app built for serious traders from one built for marketing demos. You can also explore VWAP vs RVOL vs ORB: which technical indicators work best to understand the edge behind the most popular setups.
5. Desktop vs. Mobile-First: Which Platform Fits Your Life?
The trading software industry has historically been desktop-first. Complex multi-panel interfaces, real-time data feeds, and charting tools were built for traders sitting at a desk with multiple monitors. That model still works for some traders, but it's increasingly out of step with how most people actually live and trade.
The Case for Desktop Platforms
Desktop-first platforms like Trade Ideas and TrendSpider offer deep customization and powerful analysis tools. If you're a professional trader with a dedicated trading station and the time to learn a complex interface, these tools can be excellent. Trade Ideas, for example, offers sophisticated scanning capabilities, but it starts at $118/month, requires significant setup time, and has no meaningful mobile experience. TrendSpider is a powerful chart analysis tool, but it's designed for stocks you're already watching, not for discovering new setups across the entire market.
The Case for Mobile-First Stock Screener Apps
Most traders, especially those with day jobs, families, or anything resembling a life outside the market, can't be chained to a desktop all day. A stock screener app that delivers push alerts to your phone and lets you evaluate setups in 30 seconds changes the game. You catch the ORB break at 9:45 AM from your phone. You review swing setups during your lunch break. You don't miss entries because you stepped away from your desk.
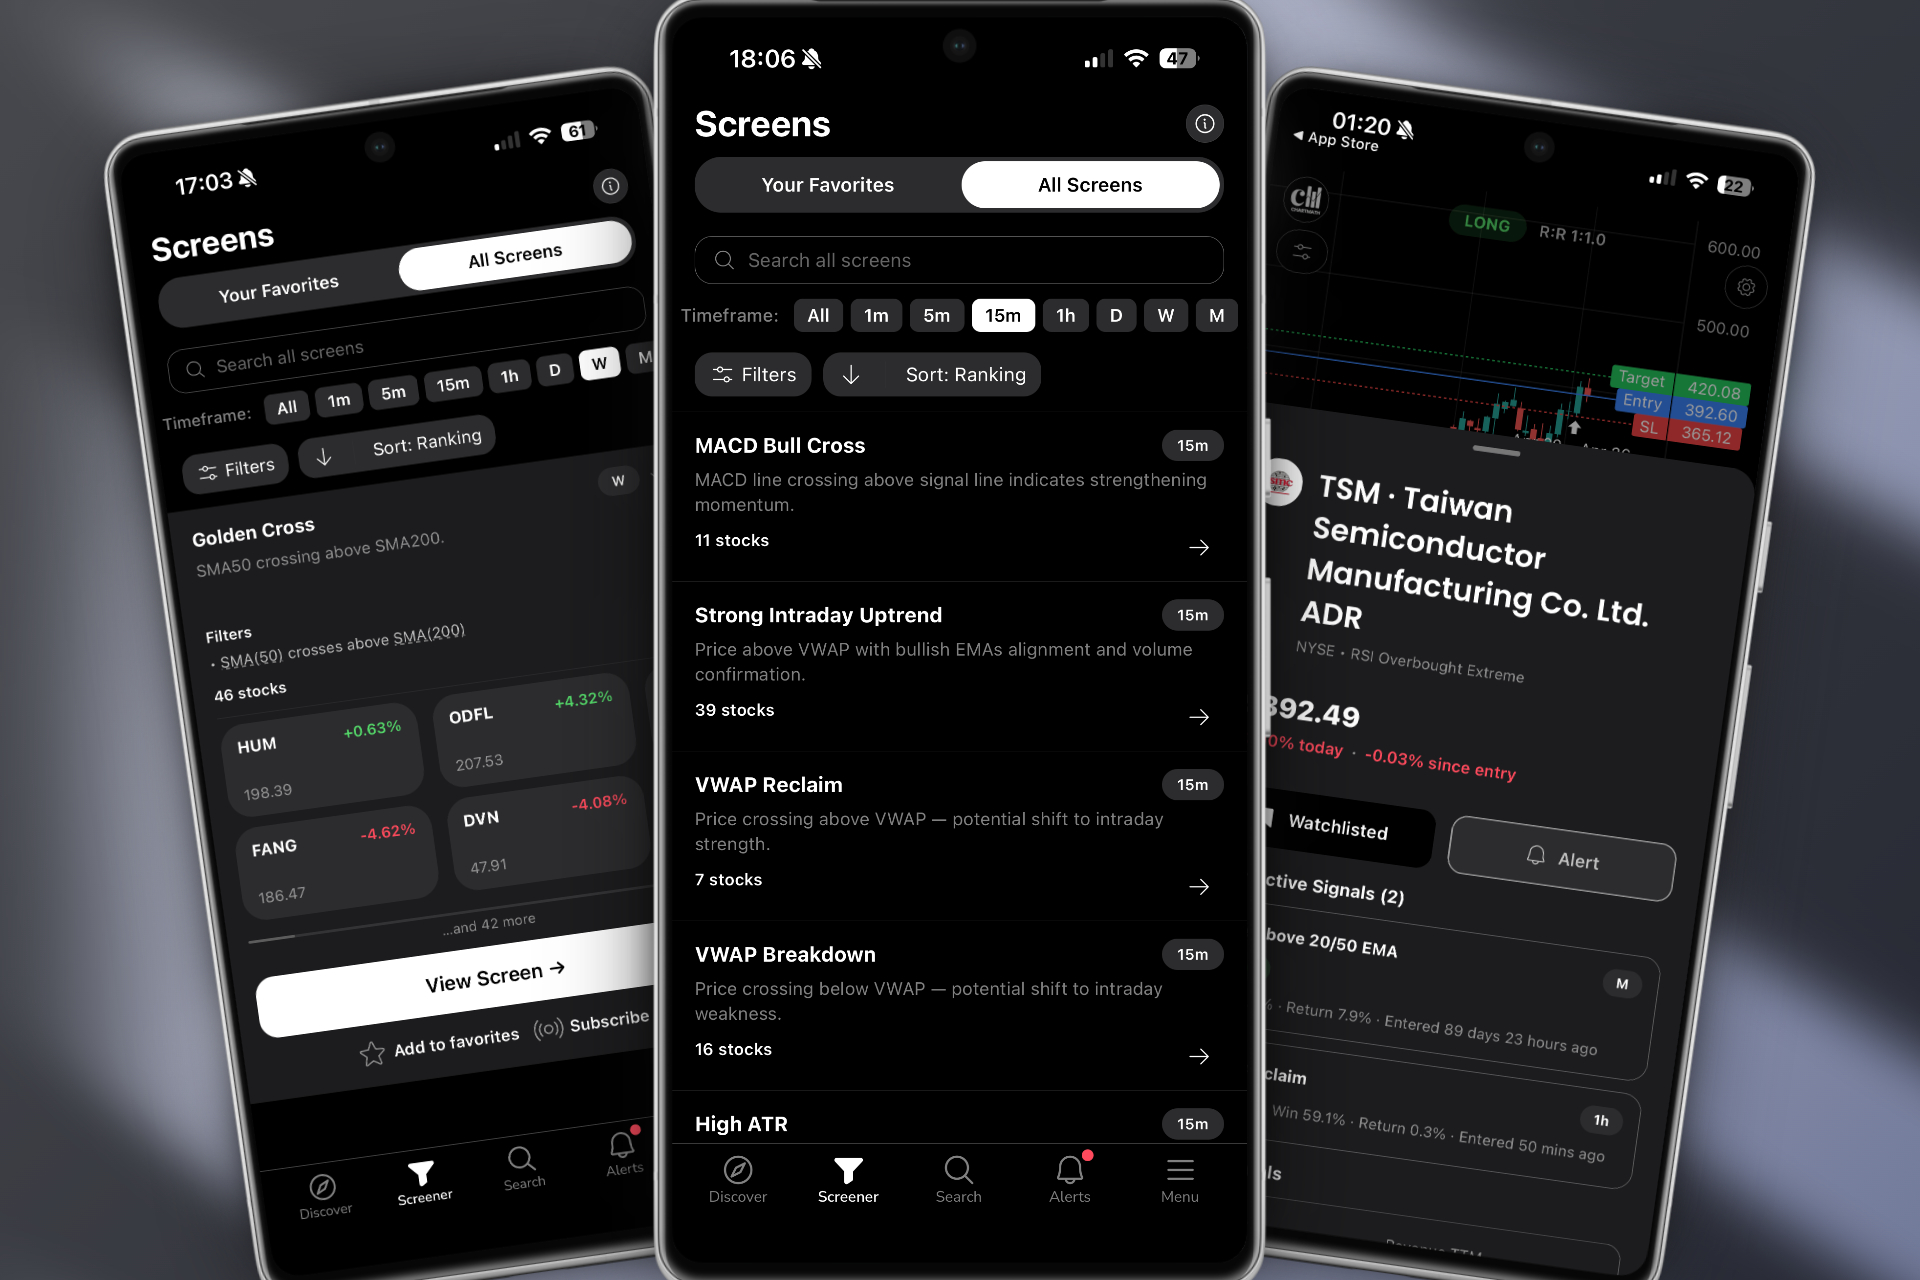
ChartMath was built mobile-first from the ground up. Its TikTok-style swipe interface lets you scroll through ranked setups, evaluate the backtest data, and add tickers to your watchlist, all from your phone, in seconds. It's designed to be a companion to your existing charting platform, not a replacement. You discover the setup on ChartMath, then execute on your preferred chart. See how this fits into a broader trading workflow in how to build an efficient trading workflow in 2026.
For a detailed comparison of desktop and mobile platforms for specific setups, this breakdown of desktop vs. mobile trading platforms in 2026 is worth reading.
6. Pre-Built Screens vs. DIY Coding: Save Time Without Sacrificing Edge
TradingView is the most popular charting platform in the world, and for good reason, it's powerful, flexible, and has a massive community. But here's the problem: to build custom alerts and screens on TradingView, you need to write Pine Script. Pine Script is a proprietary coding language that takes weeks to learn and hours to debug. Most traders don't have that time, and they shouldn't have to spend it on infrastructure when they could be trading.
The Pine Script Problem
Even experienced traders who can write Pine Script spend significant time maintaining and updating their custom alerts. Every time market conditions change or a new setup emerges, the code needs updating. This is a real cost that rarely gets factored into the "free" appeal of building your own screener. And for beginners, the barrier is even higher, you're essentially learning to code before you learn to trade.
Pre-Built Screens: The Smarter Starting Point
A stock screener app with 200+ pre-built, backtested technical screens eliminates the coding barrier entirely. You get access to proven setups, ORB, VWAP reclaims, RVOL spikes, momentum breakouts, chart patterns, without writing a single line of code. And because each screen comes with backtest data, you're not just saving time; you're starting with validated edge rather than guessing whether your custom filter actually works.
This doesn't mean pre-built screens are for beginners only. Professional traders use pre-built screens because they're efficient. The goal is to find high-probability setups, not to prove you can code. ChartMath's library of 200+ curated technical setups covers the full spectrum of momentum trading, breakout trading, and swing trading strategies, all available immediately, no setup required. For a look at the most effective technical setups in this library, see 15 proven technical setups every day trader should know.
7. Build Your Evaluation Framework: A Checklist for Choosing a Stock Screener App
Before you commit to any stock screener app, run it through this checklist. It covers the six dimensions that matter most for technical traders in 2026.
The Stock Screener App Evaluation Checklist
- Real-time vs. end-of-day scanning: Does the screener update continuously during market hours, or only after the close? Match this to your trading timeframe.
- Alert quality and context: Do alerts include plain-English explanations and backtest data, or just raw price triggers? Can you control alert frequency to avoid fatigue?
- Backtest transparency: Does the platform show win rates, average returns, drawdowns, and sample sizes for each setup? Or does it use black-box scoring?
- Mobile accessibility: Is there a native mobile app with push notifications? Can you evaluate and act on setups from your phone?
- Ease of use: Can you get value from the platform on day one without coding or a lengthy setup process? Are pre-built screens available?
- Pricing and free tier: Is there a free tier to test the platform before committing? Is the pricing transparent and proportional to the value delivered?
Red Flags to Watch For
Avoid any stock screener app that: has no backtest data or historical performance stats, sends alerts without context or explanation, has no mobile app or push notifications, requires coding to access basic functionality, or has an interface so complex it takes weeks to learn. These aren't minor inconveniences, they're signs the platform wasn't built with the trader's actual workflow in mind.
How to Test Before You Commit
Most quality screeners offer a free tier or trial period. Use it seriously. Run the screener during live market hours, evaluate the alerts you receive, and ask: are these setups I would actually trade? Do the alerts arrive in time to act? Is the backtest data meaningful? A screener that looks impressive in a demo but delivers mediocre alerts in practice isn't worth your money. ChartMath offers a free tier so you can experience real-time scanning and intelligent alerts before upgrading, download the ChartMath app and see how it performs during a live trading session.
If you want to see the platform in action before downloading, watch the ChartMath demo to get a clear picture of how the swipe interface, alert system, and backtest data work together in real time.
Frequently Asked Questions About Stock Screener Apps
What is a stock screener app?
A stock screener app is a tool that filters stocks based on technical or fundamental criteria to identify trading opportunities. Technical screeners look for chart patterns, indicator signals, and price action setups. The best stock screener apps scan the entire market continuously and deliver alerts when stocks match your criteria, so you don't have to manually review hundreds of charts.
Is a free stock screener app good enough?
It depends on your trading style and needs. Free screeners like Finviz's basic tier are useful for end-of-day swing trading research, but they lack real-time scanning, push alerts, and backtest data. For active day traders or anyone who needs intraday alerts, a free-only tool will leave significant gaps. ChartMath's free tier provides access to real-time scanning and alerts, making it a strong starting point for traders at any level.
What's the best stock screener app for beginners?
Beginners should look for a stock screener app with pre-built technical screens (no coding required), plain-English alert explanations, and backtest data that shows why a setup has an edge. ChartMath is designed with beginners in mind, its 200+ pre-built screens cover the most common technical setups, and every alert explains what triggered and what the historical performance looks like. You can start learning technical analysis by watching real setups play out in real time.
Can I use a stock screener app on my phone?
Yes, and for most traders, mobile access is essential. A mobile stock screener app with push notifications lets you catch setups while away from your desk. ChartMath is built mobile-first, with a native app and a swipe-based interface designed for quick setup evaluation on the go. You can also access ChartMath's screener directly in your browser at app.chartmath.com if you prefer a web-based experience.
How is ChartMath different from TradingView or Finviz?
TradingView is primarily a charting platform, it's excellent for analyzing stocks you're already watching, but building custom alerts requires Pine Script coding. Finviz updates end-of-day and has no real-time scanning or mobile push alerts. ChartMath is a proactive trade discovery tool: it scans the entire market across 200+ pre-built, backtested technical setups and delivers intelligent push alerts with context and edge data, no coding required, fully mobile. It's designed to work alongside TradingView and other charting platforms, not replace them. For more on how momentum trading and breakout trading setups compare across platforms, see the momentum trading software buyer's guide.
Choose the Stock Screener App That Works as Hard as You Do
The right stock screener app doesn't just find stocks, it finds the right stocks, at the right time, with enough context to act confidently. Whether you're a day trader chasing ORB breaks on the 5-minute chart, a swing trader building a watchlist before market close, or a beginner trying to understand why patterns work, the framework in this guide gives you a clear path to the tool that fits your style.
Stop refreshing Finviz. Stop drowning in TradingView alerts you can't act on. Start using a stock screener app that scans 200+ backtested technical setups in real time, delivers intelligent push alerts with plain-English context, and works from your phone so you never miss another entry. Download ChartMath and run it through a live trading session, or watch the demo to see exactly how it discovers high-probability setups before you commit. Your next great trade is already setting up. Make sure you're the one who catches it.
Ankush Jindal
Co-Founder, ChartMath
Ankush Jindal is the Co-Founder of ChartMath, a real-time trade discovery platform that monitors 200+ technical screens across the market to surface actionable setups for technical traders. He holds a B.Tech in Computer Science from IIT Mandi. Before ChartMath, he co-founded two successful technology ventures spanning hundreds of thousands of users. This experience building data-intensive, real-time systems directly shaped his approach to technical analysis tooling. At ChartMath, Ankush leads product vision, designing intuitive interfaces that translate complex price action into clear, backtested signals. His philosophy: trading decisions should be backed by data, not gut feeling.
LinkedInSee these setups live in ChartMath
200+ curated screens with backtest data. Free to use.
Related Articles
Best Real-Time Stock Scanner for Day Trading in 2026
Discover how to choose the best real-time stock scanner for day trading. Compare features, alerts, backtesting, and mobile access to find your edge.
How to Choose a Stock Screener with Backtest Data
Learn how to select the best stock screener with backtest capabilities. Discover essential features like win rates, EV metrics, and real-time alerts.
How to Use an RSI Divergence Screener to Find Reversals
Learn how to use an RSI divergence screener to automatically identify bullish and bearish divergence patterns that signal high-probability trend reversals.