Table of Contents
You've just watched a perfect breakout setup develop on your watchlist stock. The volume is spiking, the price is breaking through resistance, and every technical indicator is aligned. But by the time you noticed it, the move is already halfway done. Sound familiar?
For active traders in 2026, the difference between catching opportunities and watching them slip away often comes down to one critical tool: a real-time stock scanner. These platforms continuously monitor thousands of stocks across multiple timeframes, alerting you the moment high-probability setups form. No more refreshing screeners every five minutes or missing entries while you're in a meeting.
This comprehensive guide walks you through everything you need to know about choosing the best real-time stock scanner for your trading style. Whether you're a day trader executing rapid-fire scalps, a swing trader looking for multi-day breakouts, or a beginner learning technical analysis, you'll discover the essential features, comparison criteria, and practical considerations that separate game-changing tools from expensive distractions.
What Makes a Real-Time Stock Scanner Essential for Modern Traders
The trading landscape has evolved dramatically over the past decade. What once required hours of manual chart analysis and constant screen monitoring can now be automated through intelligent scanning technology. A real-time stock scanner acts as your tireless market watchdog, analyzing price action, volume patterns, and technical indicators across thousands of securities simultaneously.
The fundamental difference between traditional stock screeners and real-time scanners lies in timing and automation. Static screeners like Finviz provide end-of-day snapshots based on fundamental criteria. You run a search, get results, and those results are already historical by the time you see them. Real-time scanners, by contrast, operate continuously throughout the trading session, pushing alerts to your device the moment conditions are met.
This distinction matters enormously for active traders. Consider a typical Opening Range Breakout (ORB) setup. The opportunity window might last only 3-5 minutes after the initial break. If you're manually scanning charts or waiting for end-of-day data, you've already missed the entry. A real-time stock scanner catches that moment and delivers an alert with context about why the setup triggered and what the historical performance looks like.
For day traders, real-time scanning is non-negotiable. Intraday opportunities move fast, especially on 1-minute and 5-minute timeframes. Missing a VWAP reclaim or RVOL spike by even a few minutes can mean the difference between a profitable trade and no trade at all. Real-time scanners monitor these fast-moving setups across your entire watchlist and the broader market simultaneously.
Swing traders benefit differently but equally. While they're not chasing minute-by-minute moves, they still need to know when daily or weekly breakout patterns form. A real-time scanner can alert them when a stock breaks above a key resistance level with strong volume, giving them time to analyze the setup and plan their entry for the next trading session. This is particularly valuable for busy professionals who can't watch charts all day but still want to catch high-quality setups as they develop.
Even technical trading beginners gain tremendous value from real-time scanners. Instead of trying to learn which patterns to look for across thousands of stocks, they can let the scanner do the heavy lifting. When an alert fires, they see a real example of a technical setup in action, complete with explanations of why it triggered and what the historical win rate has been. This transforms the scanner into an educational tool that accelerates the learning curve.
Core Features Every Real-Time Stock Scanner Must Have
Not all real-time stock scanners are created equal. The market is crowded with platforms that promise comprehensive scanning but deliver either overwhelming complexity or underwhelming results. When evaluating options, focus on these non-negotiable core features that separate professional-grade tools from basic screeners.
Real-time data feeds form the foundation. This might seem obvious, but many "real-time" scanners actually operate on 15-minute delayed data or only update at specific intervals. True real-time scanning means continuous monitoring with alerts delivered within seconds of a setup forming. For day traders working with momentum plays and breakout trading, those seconds matter. Verify that any platform you're considering provides genuine real-time data, not delayed feeds marketed as "near real-time."
Technical screening capabilities should cover the full spectrum of proven setups. At minimum, look for scanners that can identify volume spikes (RVOL), VWAP crosses and reclaims, Opening Range Breakouts, momentum indicators like RSI and MACD, chart patterns including ascending triangles and bull flags, and support/resistance breakouts. The best platforms offer dozens or even hundreds of pre-built screens covering different technical strategies, so you're not limited to a handful of generic filters.
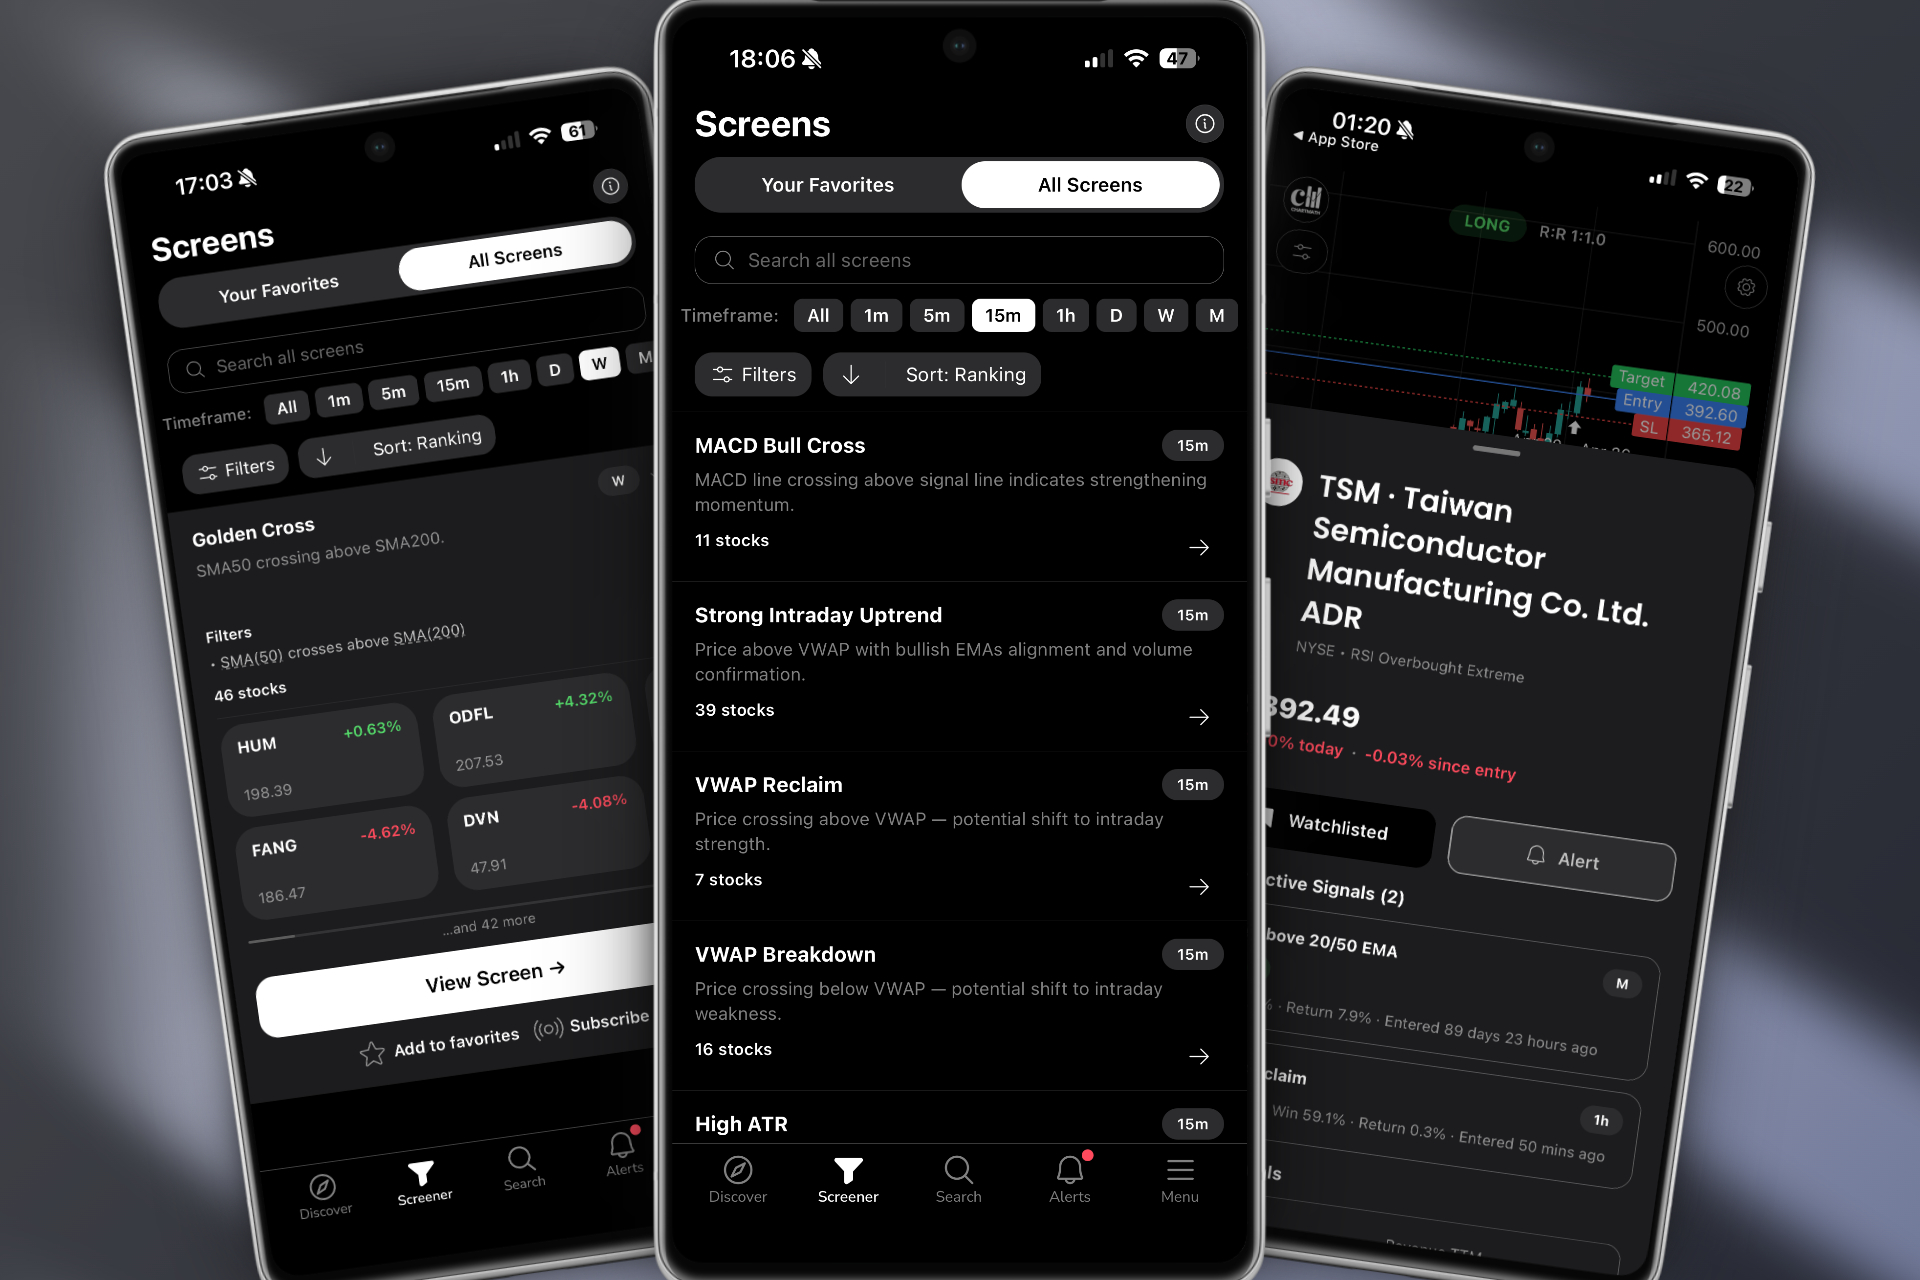
Multi-timeframe analysis is critical because different trading styles operate on different time horizons. A comprehensive real-time stock scanner should monitor 1-minute, 5-minute, 15-minute, hourly, daily, and weekly timeframes simultaneously. This allows day traders to catch intraday momentum while swing traders can track longer-term breakout patterns, all from the same platform. Platforms like ChartMath excel here by offering 200+ curated screens across all major timeframes, from rapid scalps to multi-week position trades.
Customizable alert systems prevent the dreaded alert fatigue that plagues many traders. Getting 50 notifications per hour is just as useless as getting none. Quality scanners let you filter alerts by setup quality, stock liquidity, price range, and other criteria. They also provide context with each alert, explaining in plain English why the signal triggered and what the setup represents. This filtering capability ensures you only see opportunities that match your specific trading criteria and risk tolerance.
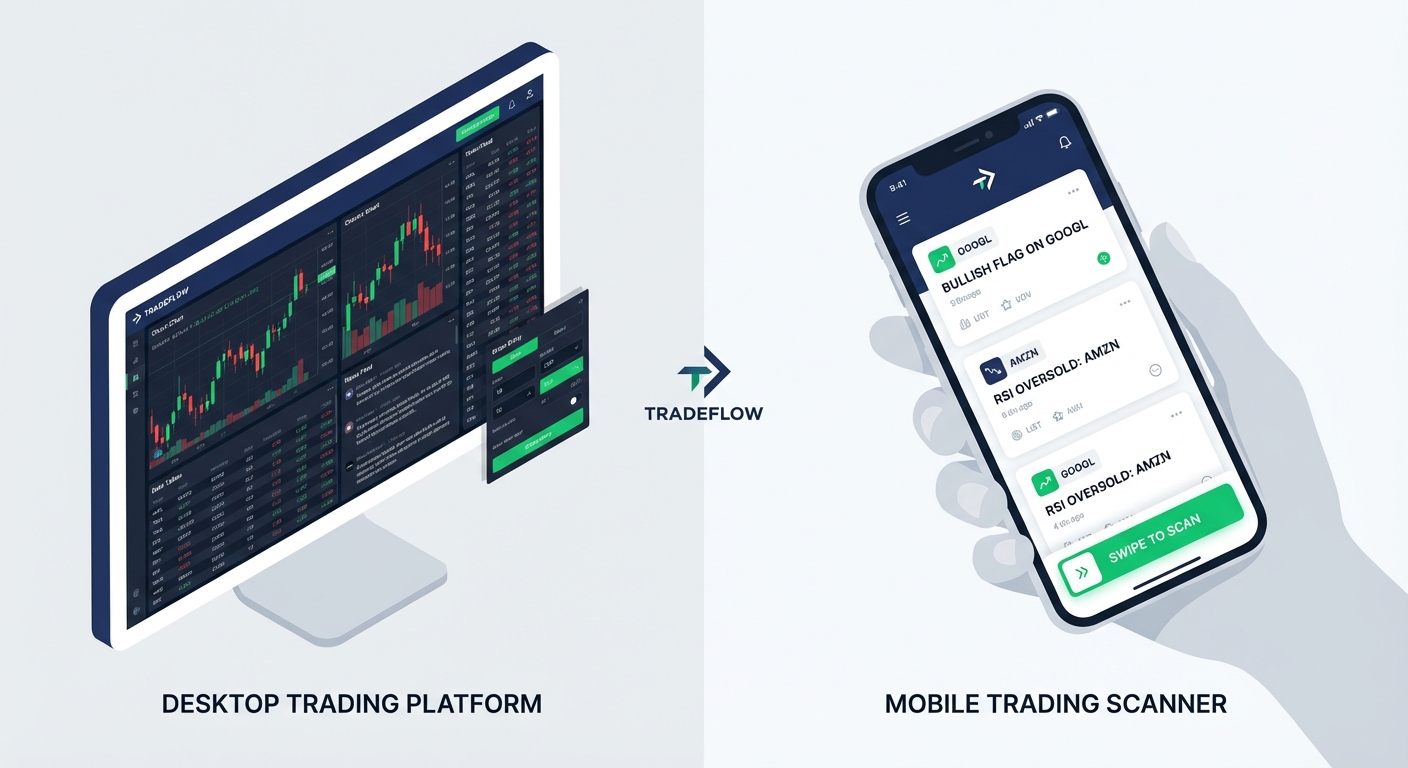
Integration with existing workflows determines whether a scanner becomes a valuable tool or an isolated data source. The best scanners work as companion apps to your existing charting platform, not replacements. When an alert fires, you should be able to quickly jump to your preferred charting software to analyze the setup in detail and execute the trade. This is why mobile accessibility has become so important. A properly integrated alert system delivers notifications to your phone, allowing you to review setups and make decisions even when you're away from your trading desk.
Technical Screening Capabilities: What to Look For
The depth and breadth of technical screening capabilities separate professional-grade real-time stock scanners from basic filtering tools. When evaluating platforms, dig into exactly which technical setups they can identify and how much customization they allow.
Pre-built screens vs custom coding represents a fundamental divide in the scanner market. Platforms like TradingView offer incredible flexibility through Pine Script, allowing advanced users to code virtually any custom indicator or screening logic. The tradeoff is a steep learning curve. If you're not a programmer or don't want to spend weeks learning a proprietary scripting language, you need a platform with comprehensive pre-built screens.
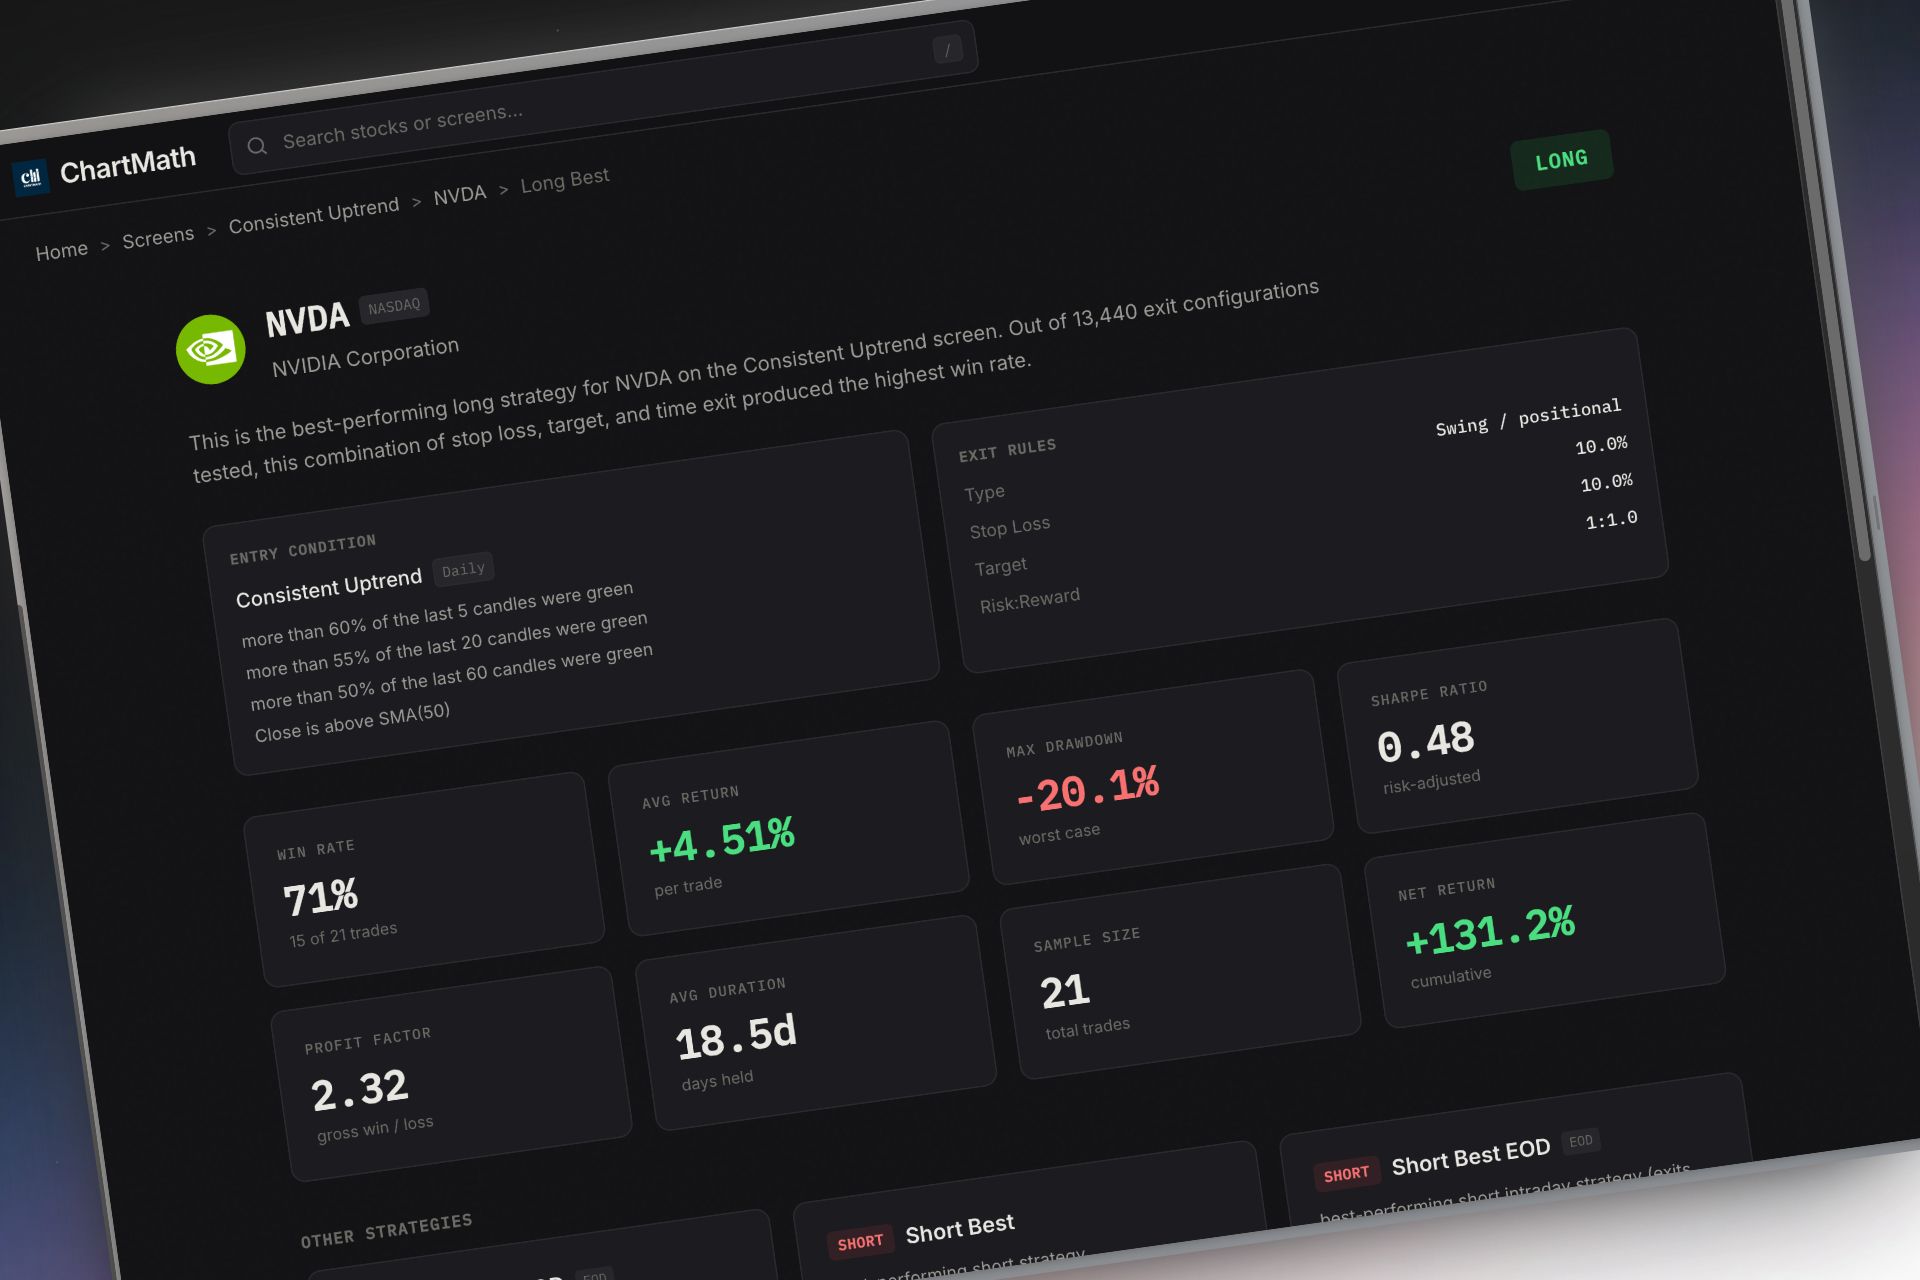
ChartMath takes the opposite approach, providing 200+ curated technical screens that cover the most proven setups without requiring any coding knowledge. Each screen comes with backtested performance data showing historical win rates and expected value per trade. This means you can immediately start using sophisticated technical strategies that would take months to code and backtest yourself. For most traders, especially those focused on execution rather than strategy development, pre-built screens with transparent performance data offer far more practical value than coding flexibility.
Essential technical setups your scanner should cover include:
- Opening Range Breakouts (ORB): Stocks breaking above or below the first 5, 15, or 30 minutes of trading range with volume confirmation
- VWAP crosses and reclaims: Price moving above or below the Volume-Weighted Average Price, a key institutional reference point
- Relative Volume (RVOL) spikes: Unusual volume activity indicating institutional interest or news-driven momentum
- Breakout patterns: Stocks breaking through resistance levels, ascending triangles, bull flags, and other continuation patterns
- Momentum indicators: RSI divergences, MACD crossovers, and other momentum signals that precede directional moves
- Reversal setups: Oversold bounces, failed breakdowns, and other counter-trend opportunities
A comprehensive real-time stock scanner should offer variations of each setup across different timeframes and with different confirmation criteria. For example, a VWAP reclaim on a 5-minute chart with 2x RVOL is a very different setup than a VWAP reclaim on a daily chart with declining volume. The more granular the screening options, the better you can match setups to your specific trading strategy.
Multi-timeframe analysis capabilities determine whether a scanner serves only day traders or supports multiple trading styles. The best platforms simultaneously monitor 1-minute charts for scalpers, 5-minute and 15-minute charts for day traders, hourly charts for swing traders, and daily/weekly charts for position traders. This comprehensive coverage means you can use one platform regardless of your trading timeframe preference. It also enables powerful multi-timeframe confirmation, where you might look for a 5-minute breakout that aligns with a daily uptrend, significantly improving your probability of success.
Volume and volatility filters ensure you're only seeing tradable opportunities. A breakout on a stock with 50,000 shares of daily volume isn't actionable for most traders due to poor liquidity and wide spreads. Quality scanners let you filter by minimum average daily volume, current RVOL, price range, and volatility measures like Average True Range (ATR). These filters eliminate illiquid penny stocks and low-volatility names that don't offer meaningful profit potential, focusing your attention on stocks with genuine trading opportunity.
For traders looking to build a systematic approach, understanding how to validate technical setups through backtesting becomes essential. The screening capabilities are only as valuable as the historical evidence supporting them.
Comparing Real-Time Stock Scanner Platforms
The real-time stock scanner market offers dozens of platforms, each with different strengths, pricing models, and target audiences. Understanding the landscape helps you identify which solution best matches your trading style, technical skill level, and budget. Let's break down the major categories and specific platforms worth considering.
Desktop Scanners: TradingView, Trade Ideas, and TC2000
TradingView dominates the charting space with beautiful visualizations and a massive community of traders sharing ideas. However, as a real-time stock scanner, it requires significant technical knowledge. To create custom alerts, you need to learn Pine Script, their proprietary coding language. While this offers unlimited flexibility for advanced users, it creates a steep barrier for traders who just want to find ORB breaks or VWAP reclaims without becoming programmers. TradingView excels at chart analysis and social trading features, but it's fundamentally a charting platform where scanning is a secondary feature requiring coding skills.
Trade Ideas represents the premium end of the desktop scanner market, starting at $118+ per month. It offers sophisticated AI-driven scanning with impressive speed and depth. The platform targets professional day traders who need institutional-grade tools and are willing to pay for them. Trade Ideas provides excellent real-time scanning capabilities with customizable alerts and backtesting features. The downsides are the premium pricing, desktop-only interface, and complexity that can overwhelm newer traders. If you're a full-time professional trader executing dozens of trades per week, the investment makes sense. For part-time traders or those just starting out, it's likely overkill.
TC2000 combines charting, scanning, and integrated brokerage in a comprehensive desktop platform priced at $25-100 per month with no free tier. Their EasyScan feature allows users to build custom screens using a visual interface, which is more accessible than Pine Script but still requires understanding how to construct screening logic. The platform is powerful and well-regarded among technical traders, but it doesn't provide backtested performance data for screens, leaving you to validate setups yourself. It's also desktop-focused, limiting your ability to monitor alerts when away from your computer.
Mobile-First and Hybrid Solutions
The rise of mobile trading has created demand for scanners that work as well on a smartphone as on a desktop. This shift recognizes that modern traders can't be chained to a desk all day but still need to catch opportunities as they develop.
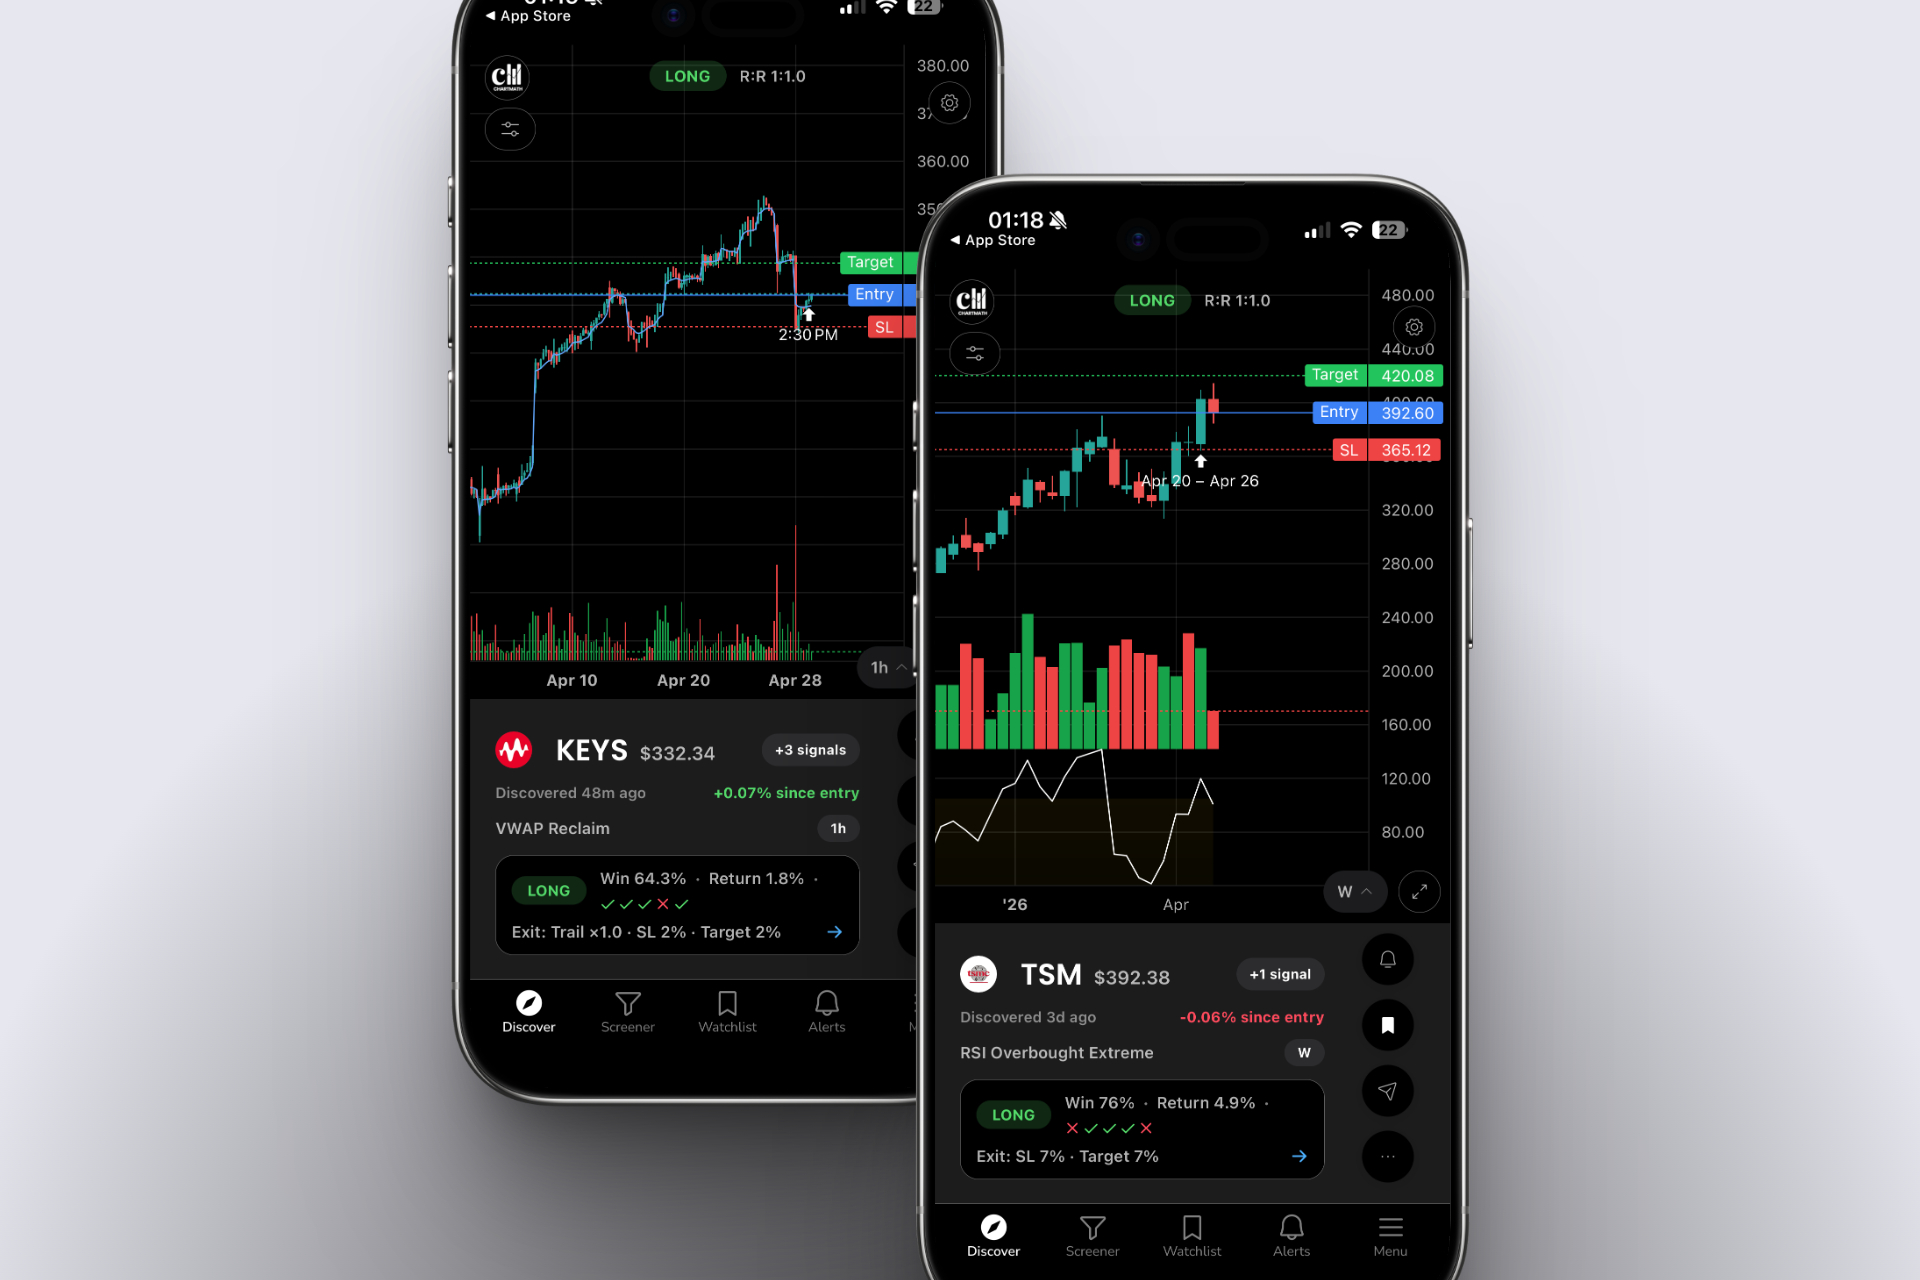
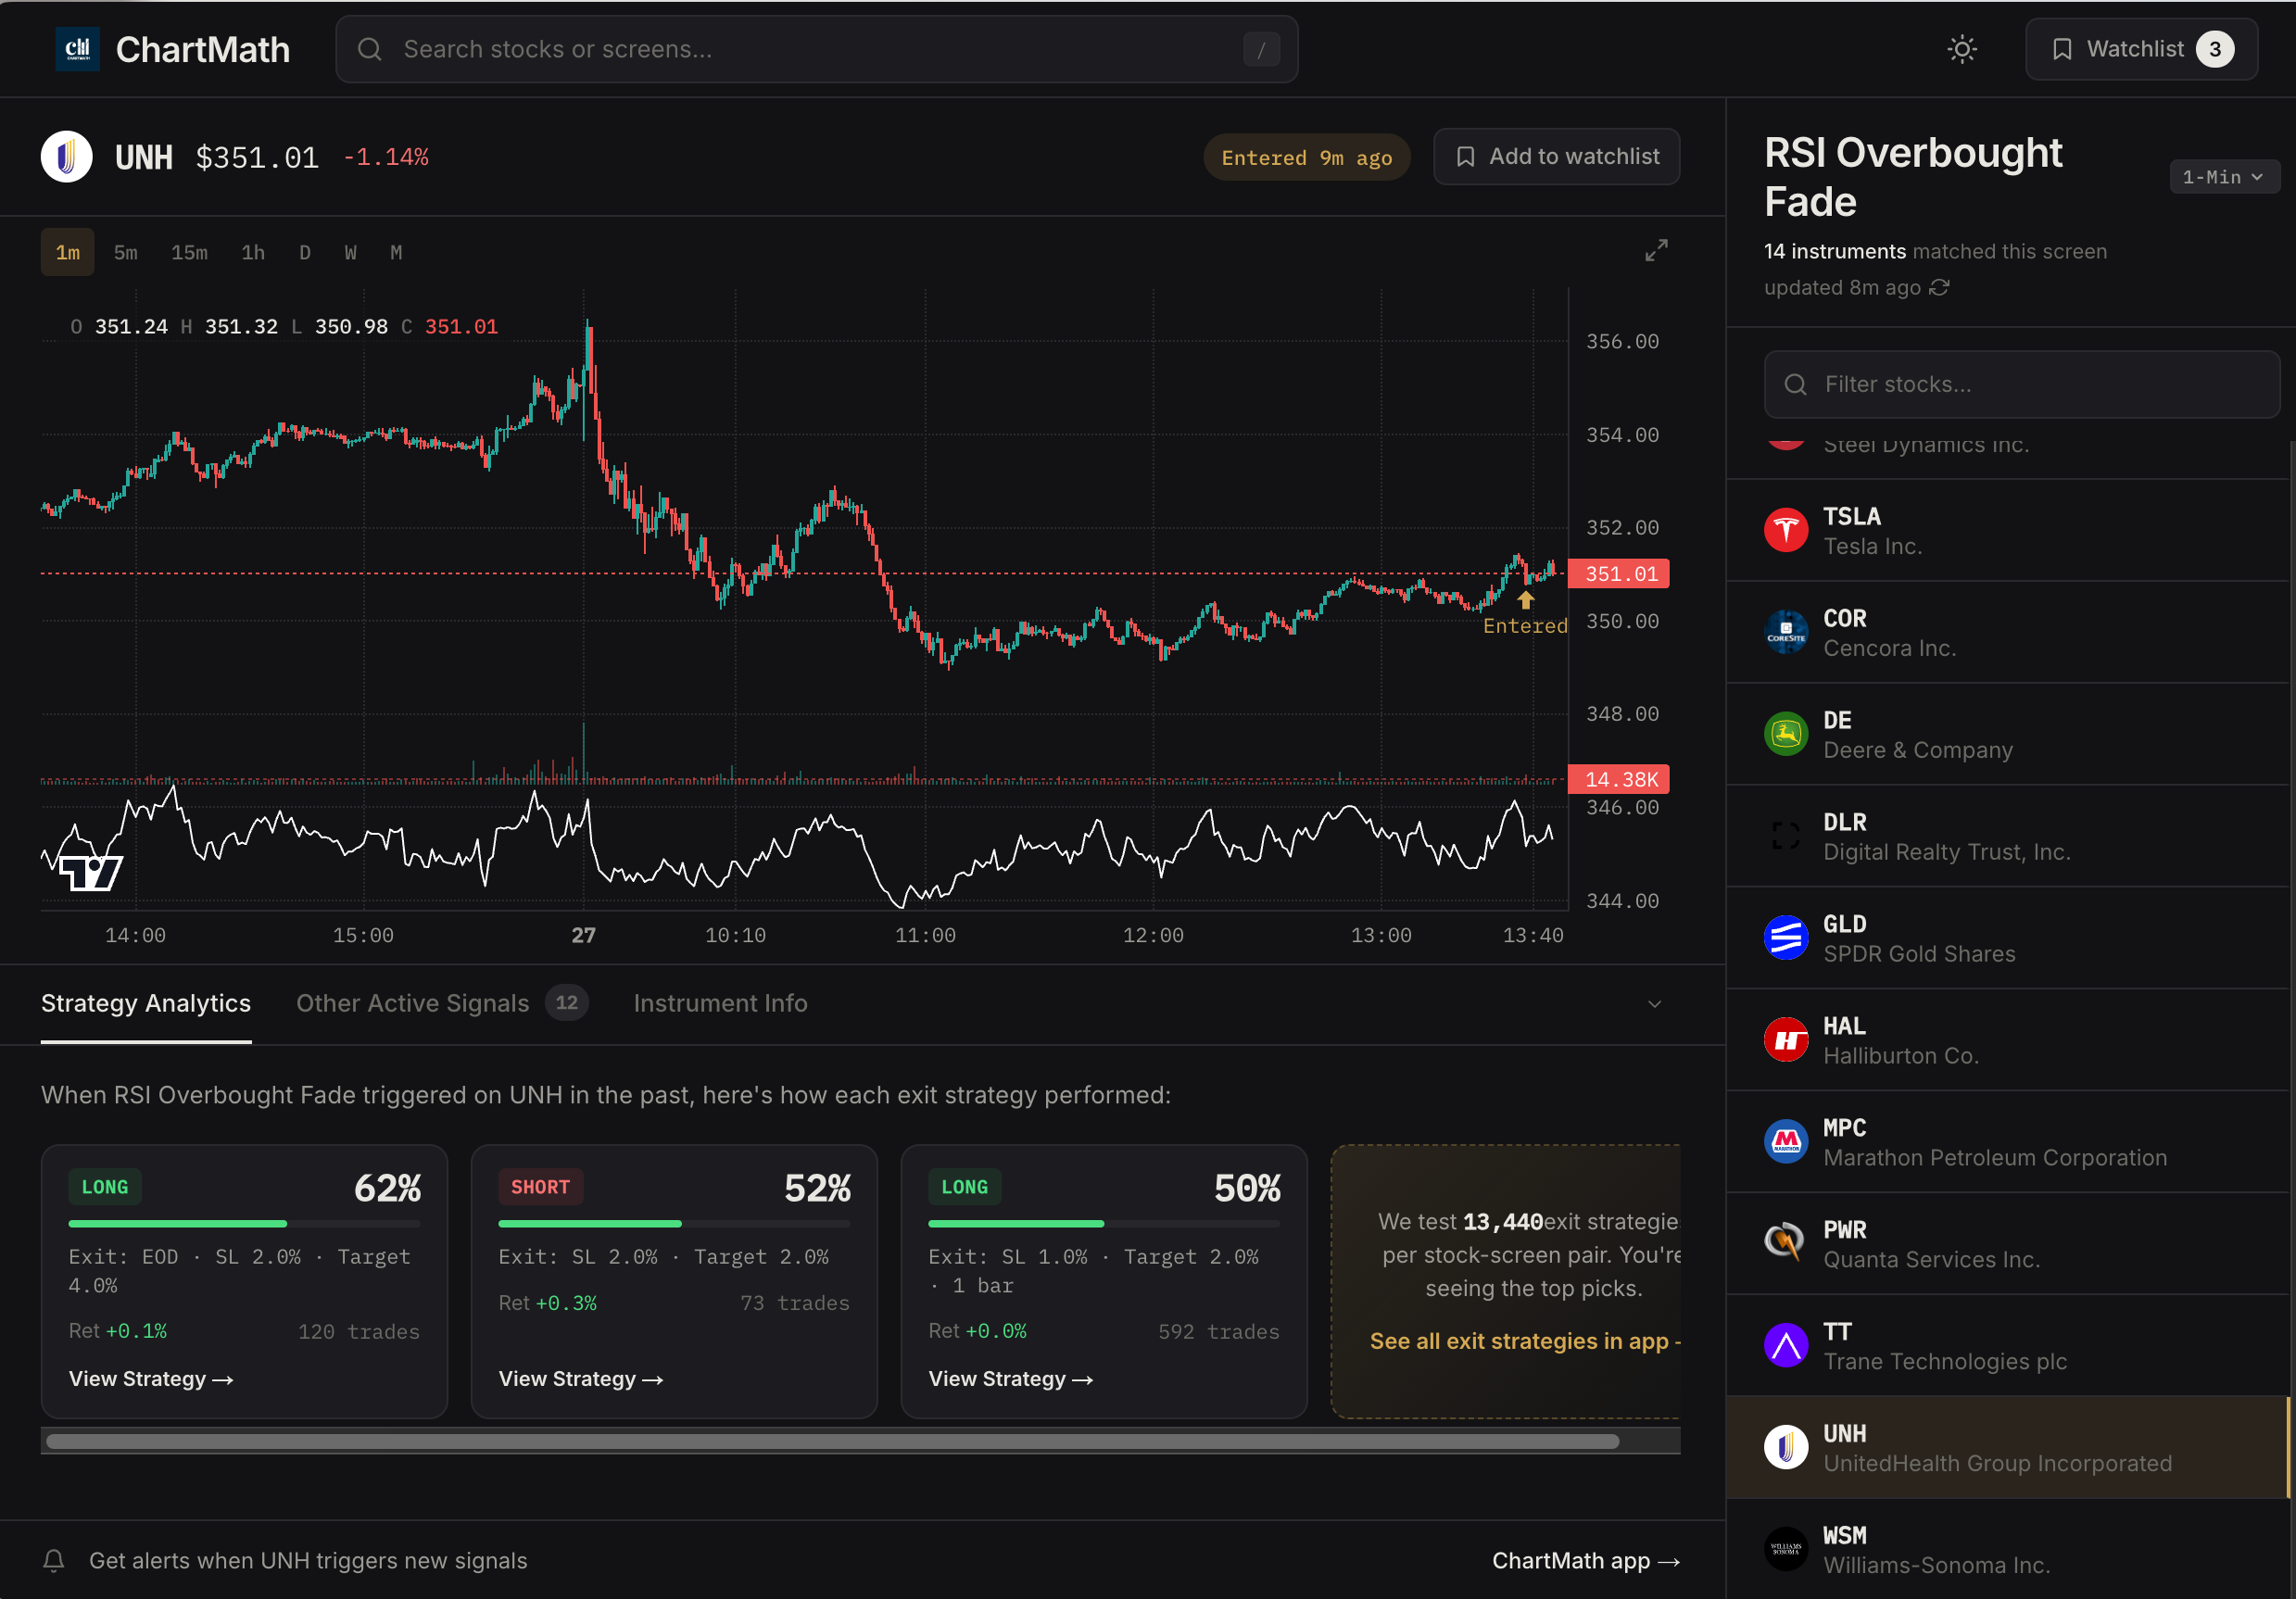
ChartMath pioneered the mobile-first approach to real-time stock scanning with a TikTok-style swipe interface that makes discovering trading setups intuitive and fast. Instead of navigating complex menus or writing code, you swipe through ranked setups organized by quality and freshness. Each alert includes plain-English explanations of why it triggered, backtested win rates, expected value per trade, and historical drawdown data. This transparency allows you to make informed decisions about which setups align with your risk tolerance and trading goals.
The platform offers 200+ pre-built technical screens covering everything from 1-minute scalps to weekly swing trades. Screens include all the essential setups: ORB breaks, VWAP reclaims, RVOL spikes, breakout patterns, momentum indicators, and reversal plays. Because these screens come pre-built and backtested, you can start using proven strategies immediately without coding or manual backtesting. ChartMath works as a companion app to your existing charting platform, delivering push notifications when setups form on your watchlist or across the broader market.
The mobile-first design means you can monitor the market from anywhere. When an alert fires, you review the setup on your phone, check the backtest data, and decide whether to take the trade. If you want deeper analysis, you can quickly jump to your desktop charting platform. This workflow flexibility is particularly valuable for swing traders and busy professionals who have limited time for active market monitoring but don't want to miss high-quality opportunities.
ChartMath also offers a free tier, making it accessible to traders at all experience levels. This contrasts sharply with premium platforms like Trade Ideas that require significant monthly commitments before you can even test the platform. The combination of mobile accessibility, transparent backtesting, pre-built screens, and free tier access makes ChartMath particularly appealing for traders who want professional-grade scanning without the complexity or cost of traditional desktop platforms.
Other platforms like Finviz offer free screening but with end-of-day data and fundamental filters rather than real-time technical scanning. TrendSpider provides excellent automated chart analysis but isn't designed as a market-wide scanner. You can't ask it to "show me all stocks in ascending triangles right now" the way you can with a dedicated real-time stock scanner. Each platform serves different needs, but for traders specifically seeking real-time technical setup discovery with mobile accessibility and transparent performance data, the mobile-first approach offers distinct advantages.
Alert Quality: Avoiding Alert Fatigue While Catching Opportunities
One of the biggest challenges with real-time stock scanners is managing alert volume. Too many alerts create noise that causes you to ignore notifications or miss genuine opportunities buried in the flood. Too few alerts mean you're not seeing enough setups to find consistent trading opportunities. The quality of a scanner's alert system often matters more than the quantity of screens it offers.
The alert fatigue problem is real and widespread. Many traders start with a new scanner, enable every available alert, and quickly find themselves receiving 40-60 notifications per hour. Within days, they start ignoring alerts or turn them off entirely, defeating the entire purpose of real-time scanning. The issue isn't that the setups are invalid; it's that without quality filtering and ranking, you can't distinguish between high-probability opportunities and marginal setups.
Quality filtering and ranking solve this problem by prioritizing alerts based on multiple factors. The best real-time stock scanners rank setups by historical performance, current market conditions, volume confirmation, and alignment with broader market trends. Instead of receiving every VWAP cross on every stock, you see only those that meet minimum volume thresholds, have favorable backtest statistics, and occur on liquid, tradable securities.
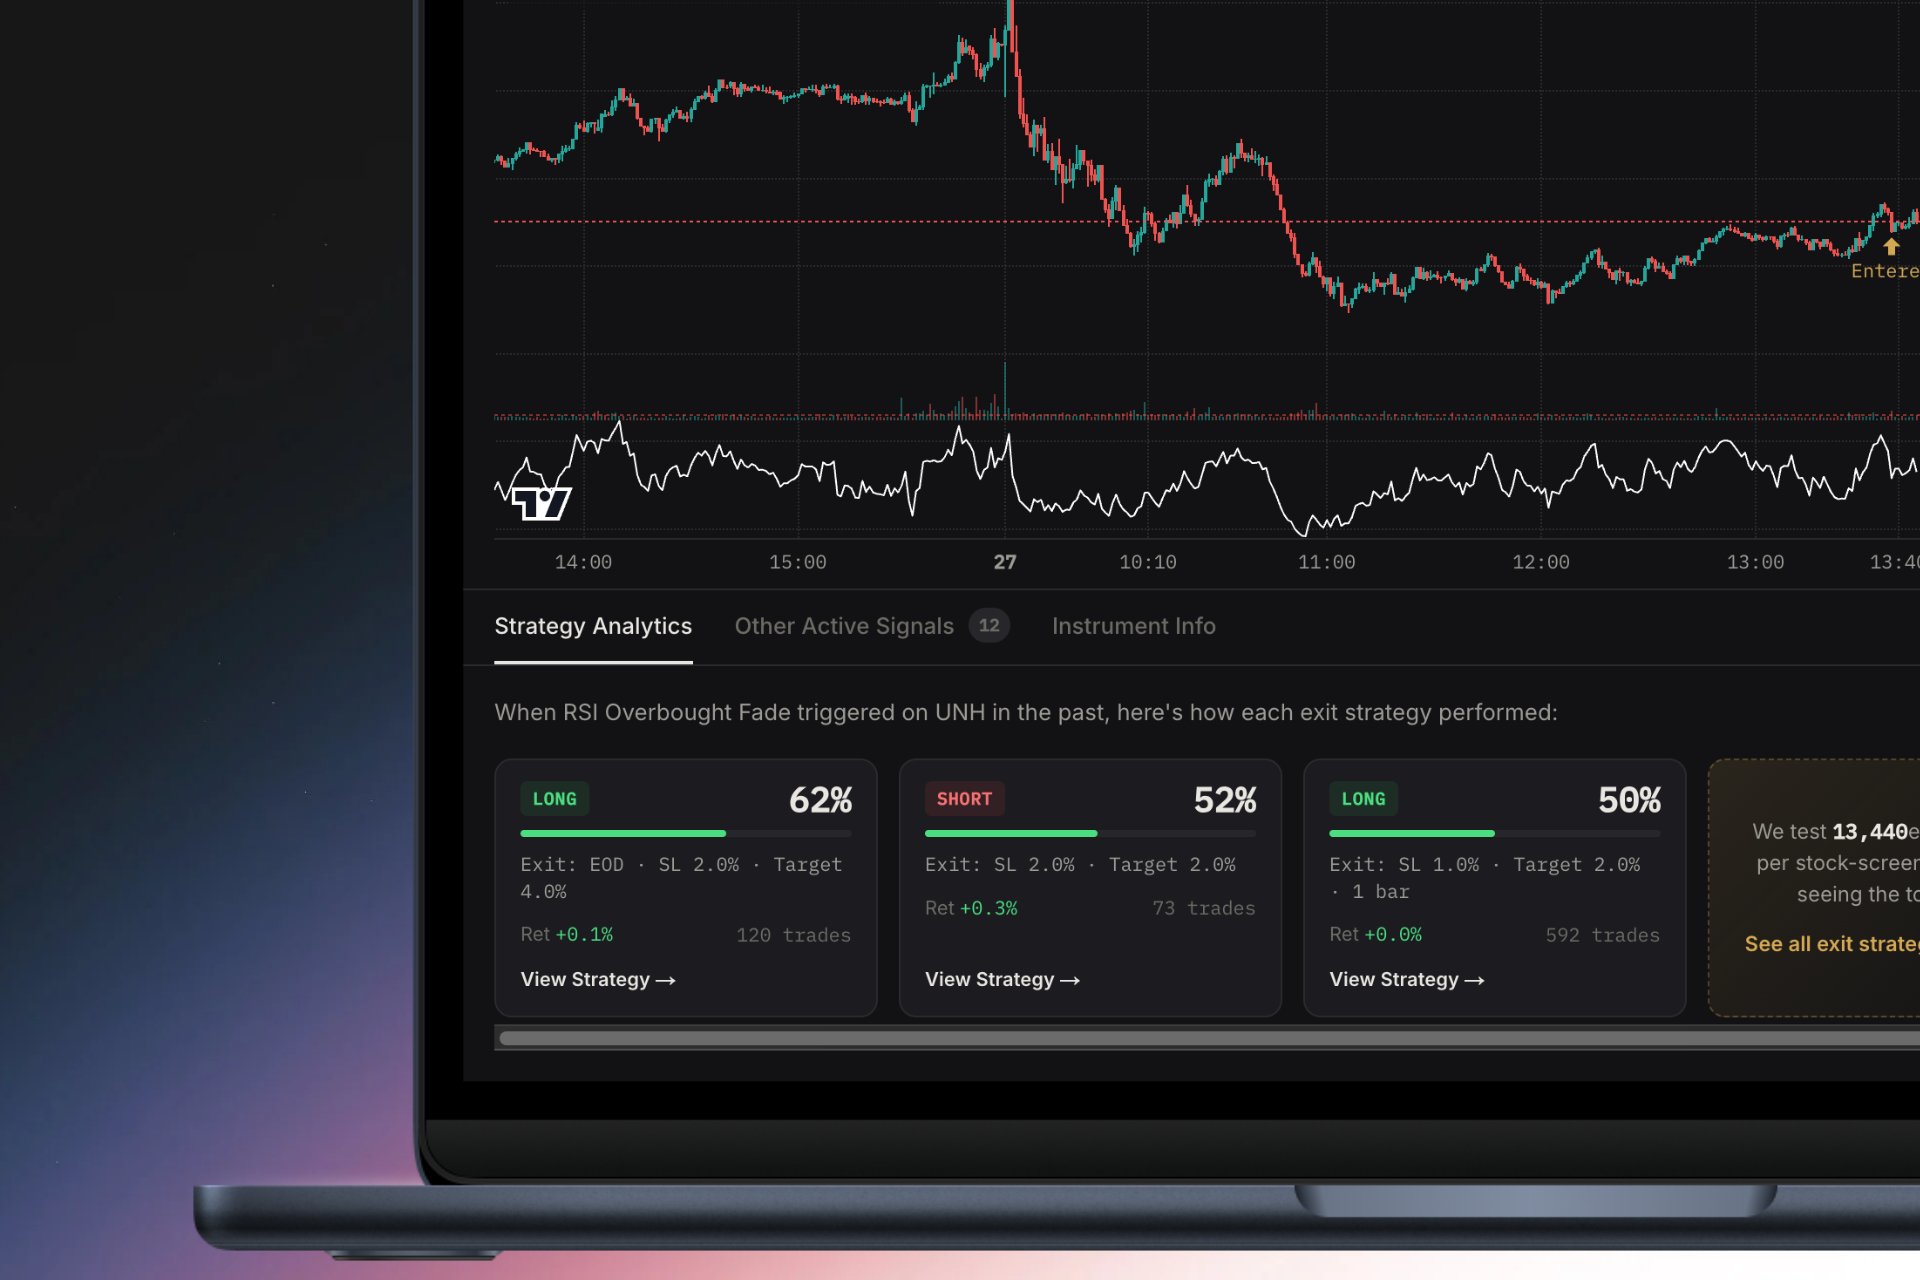
ChartMath addresses this through its discover feed, which ranks setups by quality and freshness. High-probability setups with strong backtested performance and current volume confirmation appear at the top. Lower-quality or older setups appear further down. This ranking system lets you quickly scan the best opportunities without wading through dozens of marginal alerts. You can also customize filters to match your specific criteria, such as minimum stock price, average daily volume, or specific technical setups you prefer.
Context-rich alerts provide another layer of quality. A notification that simply says "AAPL VWAP cross" doesn't give you enough information to make a trading decision. You need to know: Is this a bullish or bearish cross? What timeframe? What's the historical win rate for this setup? What's the expected value per trade? Is volume confirming the move?
Quality scanners provide this context automatically. Each alert includes a plain-English explanation of what triggered, why it matters, and what the historical performance looks like. This educational component is particularly valuable for newer traders who are still learning to recognize and interpret technical setups. Instead of just receiving signals, they're learning the logic behind each setup and building pattern recognition skills.
Right-time alerts consider your availability and trading schedule. Some scanners allow you to set quiet hours or only receive alerts during specific market sessions. If you're a swing trader who only trades the first and last hour of the market day, you can configure alerts to match that schedule. This prevents notification overload during periods when you're not available to act on setups, while ensuring you don't miss opportunities during your active trading windows.
The goal is to create a signal-to-noise ratio that keeps you informed without overwhelming you. For most traders, this means receiving 5-15 high-quality alerts per day rather than 50-100 marginal ones. Those 5-15 alerts should represent genuinely actionable setups with favorable risk-reward profiles and historical evidence of profitability. This focused approach allows you to give each opportunity proper consideration rather than making rushed decisions based on alert volume.
Backtest Validation: The Data-Driven Edge
The single most important differentiator among real-time stock scanners is whether they provide transparent backtested performance data for their screens. Trading based on technical setups without knowing their historical win rates and expected values is essentially gambling. Backtest validation transforms scanning from pattern recognition into data-driven decision making.
Why historical performance data matters is straightforward: not all technical setups are created equal. A VWAP reclaim might have a 65% win rate with a 2:1 reward-risk ratio on one timeframe but only a 45% win rate with 1:1 reward-risk on another. Without backtest data, you're flying blind, treating all signals as equally valid when they demonstrably are not.
Backtesting reveals which setups actually work, under what conditions, and with what frequency. It shows you the expected value per trade, helping you size positions appropriately. It reveals maximum drawdowns, so you know what losing streaks to expect and can manage your psychology accordingly. This data transforms your trading from discretionary guesswork into a systematic approach with quantifiable edges.
Key metrics to evaluate when reviewing backtest data include:
Win rate: The percentage of trades that were profitable. A 60% win rate means 6 out of 10 trades were winners. This metric alone doesn't tell the full story, but it's a starting point.
Expected value (EV) per trade: The average profit or loss per trade after accounting for both winners and losers. A setup with a 50% win rate but 3:1 reward-risk has positive EV. This is the most important metric for long-term profitability.
Average winner vs average loser: The reward-risk ratio. If your average winner is $300 and your average loser is $150, you have a 2:1 ratio, which means you can be profitable even with a sub-50% win rate.
Maximum drawdown: The largest peak-to-trough decline in equity during the backtest period. This tells you the worst losing streak you should expect and helps you size positions to survive inevitable drawdowns.
Sample size: How many historical trades the backtest includes. A 70% win rate over 20 trades is statistically meaningless. A 60% win rate over 500 trades is highly significant.
Transparent backtesting vs black-box AI scores represents a critical philosophical divide. Some platforms like Tickeron use AI to assign confidence scores to patterns, but the methodology is opaque. You see a score of 78% but don't know how it was calculated, what historical data it's based on, or what exit strategy was assumed. This black-box approach requires blind faith in the algorithm.
Transparent backtesting shows you the actual filters used, the actual historical trades, and the actual performance metrics across different exit strategies. ChartMath exemplifies this approach by displaying win rates, average returns, and sample sizes for every one of its 200+ screens. You can see exactly how a setup performed historically with different profit targets and stop losses. This transparency allows you to make informed decisions about which setups align with your risk tolerance and trading goals.
The platform also shows how performance varies across different market conditions, timeframes, and stock characteristics. A breakout strategy might work beautifully in trending markets but fail in choppy conditions. Transparent backtesting reveals these nuances, allowing you to adapt your approach based on current market regime rather than blindly following signals.
Validating setups before risking capital should be non-negotiable. Before you trade any technical setup, you should know its historical win rate, expected value, and maximum drawdown. This doesn't guarantee future performance, but it provides a rational basis for your trading decisions. It also helps you maintain discipline during losing streaks, because you know that a 60% win rate setup will naturally produce 4 losers out of 10 trades. Without this context, three consecutive losses might cause you to abandon a profitable strategy prematurely.
For traders serious about developing a systematic approach, learning how to build and validate backtesting strategies provides the foundation for long-term success. Even if you're using pre-built screens, understanding the backtesting process helps you interpret the data and make better trading decisions.
Mobile Accessibility and Workflow Integration
The days of being chained to a desktop trading station are over. Modern traders need the flexibility to monitor markets, receive alerts, and make trading decisions from anywhere. Mobile accessibility has evolved from a nice-to-have feature to an essential requirement for any serious real-time stock scanner.

Why mobile matters for active traders comes down to opportunity cost. If you can only monitor the market while sitting at your desktop, you're missing setups that form during meetings, commutes, lunch breaks, or any other time you're away from your computer. For day traders, this might mean missing the opening range breakout that happens in the first 15 minutes of trading while you're getting coffee. For swing traders, it might mean missing the daily breakout alert that fires at 2 PM while you're in a client meeting.
Mobile accessibility ensures you never miss opportunities due to location constraints. When a high-quality setup forms, you receive a push notification on your phone, can review the setup details and backtest data, and decide whether to take the trade. If you want deeper analysis, you can quickly open your desktop charting platform. But the initial discovery and evaluation happens on mobile, keeping you connected to the market regardless of where you are.
Companion apps vs standalone platforms represent different approaches to mobile trading. Standalone platforms try to replicate full desktop functionality on a small screen, often resulting in cluttered interfaces and poor user experience. Companion apps, by contrast, focus on the specific tasks that make sense on mobile: receiving alerts, reviewing setups, and making quick decisions.
ChartMath's mobile app exemplifies the companion approach. It doesn't try to be a full charting platform. Instead, it delivers curated alerts, provides context and backtest data for each setup, and allows you to quickly evaluate opportunities. When you want detailed chart analysis, you switch to your preferred desktop charting platform. This division of labor plays to each platform's strengths: mobile for discovery and alerts, desktop for deep analysis and execution.
The TikTok-style swipe interface makes mobile scanning intuitive and fast. You swipe through setups ranked by quality, spending seconds on each to determine if it warrants further investigation. This design recognizes that mobile usage patterns are fundamentally different from desktop. On mobile, you want quick, focused information that helps you make rapid decisions. On desktop, you want comprehensive data and analysis tools.
Integration with existing charting tools determines whether a scanner enhances your workflow or disrupts it. The best scanners work seamlessly with platforms you already use. When an alert fires, you should be able to quickly jump to TradingView, Thinkorswim, TradeStation, or whatever charting platform you prefer to analyze the setup in detail.
This integration is why ChartMath positions itself as a companion app rather than a replacement for your charting platform. It handles the scanning and alerting, which it does exceptionally well through mobile-first design and 200+ pre-built screens. Your existing charting platform handles the detailed analysis and execution, which desktop tools do better. This complementary relationship creates a more efficient workflow than trying to do everything in a single platform.
Building an efficient trading workflow with multiple tools requires thoughtful integration. A typical workflow might look like this: ChartMath continuously scans the market and delivers alerts to your phone. When an alert fires, you review the setup and backtest data on mobile. If it looks promising, you open your desktop charting platform for detailed analysis. If the setup confirms, you execute the trade through your broker. After the trade, you log the results and compare actual performance to the backtest expectations.
This multi-tool workflow is more efficient than trying to do everything in one platform because each tool specializes in what it does best. For more details on optimizing this process, see our guide on building an efficient trading workflow in 2026.
Choosing the Right Scanner for Your Trading Style
Different trading styles have different scanning requirements. A day trader executing 5-10 trades per day needs fundamentally different features than a swing trader taking 2-3 positions per week. Understanding your trading style and matching it to scanner capabilities ensures you invest in tools that actually support your approach rather than offering features you'll never use.
Day traders need real-time intraday alerts across short timeframes. The essential features include 1-minute, 5-minute, and 15-minute scanning for ORB breaks, VWAP crosses, and RVOL spikes. Speed is critical because opportunities on these timeframes move fast. An alert that arrives 5 minutes late is worthless for a 1-minute scalp setup. Day traders also benefit from pre-market scanners that identify stocks with unusual volume or price movement before the opening bell, allowing them to build watchlists for the trading session.
For day traders, platforms like ChartMath offer significant advantages through mobile push notifications and pre-built intraday screens. You don't have time to code custom alerts or manually scan charts every few minutes. You need proven setups delivered instantly with context about why they triggered and what the historical performance looks like. The ability to monitor alerts on mobile is particularly valuable because day trading often requires quick decisions during brief windows of opportunity. For more on executing these rapid plays, see our guide on intraday trading strategies.
Swing traders operate on daily and weekly timeframes, looking for multi-day breakout patterns and momentum plays. They need end-of-day signals that identify stocks setting up for potential moves over the next several days or weeks. Real-time alerts still matter, but the urgency is different. A swing trader can receive an alert at 2 PM about a daily breakout, analyze it that evening, and plan their entry for the next trading day.
Swing traders typically have limited time for market monitoring, often just 30-60 minutes per day. This makes pre-built screens with backtested performance data particularly valuable. Instead of spending hours analyzing charts, they can review curated setups that have already been validated historically. The mobile accessibility allows them to stay connected to the market without dedicating full-time attention. When a high-quality setup forms, they receive an alert, can review it during a break, and make informed decisions without disrupting their primary work schedule. Our swing trading guide for busy professionals provides more detail on this approach.
Beginners learning technical analysis need educational value alongside scanning functionality. The best scanners for beginners provide plain-English explanations of why setups triggered, what the patterns represent, and what the historical performance has been. This educational component accelerates the learning curve by showing real examples of technical setups in live market conditions.
Beginners should avoid platforms that require coding or complex configuration. Starting with Pine Script or building custom screens from scratch adds unnecessary complexity when you're still learning basic technical concepts. Instead, platforms with comprehensive pre-built screens allow beginners to immediately start seeing how proven setups work in practice. Each alert becomes a learning opportunity, building pattern recognition skills and understanding of technical analysis principles.
ChartMath's approach is particularly beginner-friendly because every alert includes context and backtest data. Instead of just seeing "VWAP cross," beginners learn what a VWAP cross means, why it's significant, and what the historical win rate has been. This transparency helps beginners understand not just what to trade, but why certain setups offer edges and how to evaluate them systematically. For those just starting out, reviewing our guide on 15 proven technical setups provides essential foundational knowledge.
Matching scanner features to your technical strategy preferences ensures you're seeing setups that align with your approach. If you trade primarily breakout patterns, you need a scanner with comprehensive breakout screening across multiple timeframes. If you focus on momentum trading, you need screens for RVOL spikes, RSI divergences, and MACD crossovers. If you trade reversals, you need oversold bounce and failed breakdown screens.
The most versatile scanners offer hundreds of pre-built screens covering different technical strategies, allowing you to enable only those that match your approach. This customization prevents alert fatigue while ensuring you don't miss opportunities in your preferred setups. As your skills develop and your strategy evolves, you can enable additional screens to explore new technical approaches without switching platforms.
Pricing and Value: What You Should Expect to Pay
Real-time stock scanner pricing varies dramatically, from free tiers with limited features to premium platforms costing $100+ per month. Understanding the pricing landscape helps you evaluate whether you're getting genuine value or paying for features you don't need.
Free tier options typically offer basic screening with significant limitations. Finviz provides free stock screening, but with end-of-day data and no real-time alerts. TradingView offers a free tier, but you're limited in the number of alerts you can set and you still need to code them yourself using Pine Script. These free options can be useful for casual traders or those just exploring technical analysis, but they lack the real-time capabilities and comprehensive screening that active traders need.
ChartMath offers a free tier that provides access to curated screens and alerts, making it one of the few platforms where you can experience real-time technical scanning without upfront investment. This free access allows you to test the platform, understand how the screens work, and evaluate whether the approach fits your trading style before committing to a paid subscription.
Mid-tier platforms ($20-50/month) represent the sweet spot for most active traders. At this price point, you should expect comprehensive real-time scanning, customizable alerts, mobile accessibility, and quality customer support. Platforms in this range include TC2000 at the lower end and various specialized scanners targeting specific trading styles.
The key evaluation criteria at this price point are the number and quality of pre-built screens, the transparency of backtest data, and the user experience. A platform with 50 screens and no performance data offers less value than one with 200+ screens and comprehensive backtesting, even at the same price. Similarly, a desktop-only platform offers less flexibility than one with robust mobile capabilities, particularly for traders who can't monitor markets full-time.
Premium scanners ($100+/month) target professional full-time traders who need institutional-grade tools and are willing to pay for them. Trade Ideas falls into this category, offering sophisticated AI scanning, extensive customization, and powerful backtesting capabilities. For traders executing dozens of trades per week and generating significant trading income, these premium tools can justify their cost through improved trade discovery and execution.
However, most part-time traders and those still building their skills don't need premium-tier tools. The additional features often add complexity without proportional value for traders who aren't using the platform as their primary income source. A mid-tier platform with solid fundamentals typically serves these traders better than a premium platform with features they'll never use.
ROI consideration provides the most important pricing perspective. If a scanner costs $30 per month but helps you catch one additional high-quality trade that you would have otherwise missed, it pays for itself many times over. A single successful swing trade might generate $500-1000 in profit. A good day trade might generate $200-500. In this context, even a $100/month scanner is inexpensive if it consistently helps you find better opportunities.
The key is ensuring the platform actually improves your trading results. This means it should help you find setups you wouldn't have found manually, provide data that improves your decision-making, or save you significant time in market analysis. If a scanner just replicates what you could do manually in the same amount of time, it's not adding value regardless of price. If it helps you discover opportunities you would have missed or validates setups with backtest data that improves your win rate, it's worth far more than its subscription cost.
Getting Started: Your First Week with a Real-Time Stock Scanner
Starting with a new real-time stock scanner can feel overwhelming given the number of features, screens, and configuration options. A structured approach for your first week helps you learn the platform efficiently while avoiding common pitfalls like alert fatigue or analysis paralysis.
Setting up your watchlists and favorite screens should be your first priority. Most scanners allow you to create custom watchlists of stocks you're interested in and receive alerts when setups form on those specific securities. Start with 10-20 stocks that you're familiar with and that have good liquidity. This focused approach helps you learn how the scanner works without being overwhelmed by alerts on hundreds of unfamiliar stocks.
For screens, start with 3-5 setups that align with your trading style. If you're a day trader, you might enable ORB breaks, VWAP reclaims, and RVOL spikes on 5-minute and 15-minute timeframes. If you're a swing trader, you might enable daily breakouts, ascending triangles, and momentum divergences. Starting with a small number of screens helps you understand how each one works and what kinds of opportunities it identifies. You can always add more screens later as you become comfortable with the platform.
Calibrating alert settings to match your availability prevents notification overload. If you can only actively trade during the first and last hour of the market day, configure your alerts to focus on those periods. If you're a swing trader who reviews setups once per day in the evening, you might disable intraday alerts entirely and focus on end-of-day signals. Most quality scanners allow granular control over when and how you receive alerts.
Also configure quality filters to reduce noise. Set minimum volume thresholds to eliminate illiquid stocks. Set price ranges that match your account size and risk tolerance. Enable only setups with favorable backtest statistics. These filters ensure you're seeing actionable opportunities rather than every marginal setup that technically meets the screening criteria.
Testing setups with small position sizes is critical during your first weeks with a new scanner. Even if the backtest data looks promising, you need to verify that you can actually execute the setups profitably with your specific trading approach, risk management, and market conditions. Start with half your normal position size or even smaller. Focus on learning how the setups behave in real-time rather than maximizing profits.
Pay attention to entry timing, stop placement, and profit targets. The backtest data provides historical averages, but your actual results will vary based on your execution. Some traders might hold for larger gains, others might take quick profits. Some might use tight stops, others might give positions more room. Your first week is about finding what works for you within the framework of the scanner's signals.
Tracking performance and refining your approach completes the learning cycle. Keep a simple trading journal that records which setups you traded, the entry and exit prices, the outcome, and any observations about what worked or didn't work. After a week or two, review your results and compare them to the backtest expectations.
If your win rate is significantly lower than the backtest data, investigate why. Are you entering too late after the alert? Are you using stops that are too tight? Are you trading during unfavorable market conditions? If your win rate matches or exceeds the backtest data, you've validated that the setup works for your trading approach and can increase position sizes accordingly.
Also refine your screen selection based on actual results. If certain setups consistently underperform for you, disable those alerts and focus on the ones that work best with your style. If you're missing opportunities because you don't have the right screens enabled, add those setups to your configuration. This iterative refinement process helps you customize the scanner to your specific needs over time.
Start Scanning Smarter, Not Harder
Choosing the best real-time stock scanner for day trading in 2026 comes down to matching platform capabilities to your specific trading style, technical skill level, and workflow requirements. The right scanner acts as a force multiplier, helping you discover high-probability setups across thousands of stocks without missing opportunities or experiencing alert fatigue.
The essential features to prioritize include genuine real-time data feeds, comprehensive technical screening across multiple timeframes, quality-filtered alerts with context, transparent backtested performance data, and mobile accessibility that keeps you connected to the market regardless of location. Platforms that require coding knowledge or lack performance validation create unnecessary barriers between you and profitable trading opportunities.
For most traders, the ideal real-time stock scanner combines pre-built screens covering proven technical setups, transparent backtest data showing historical win rates and expected values, mobile-first design for on-the-go monitoring, and integration with existing charting platforms. This combination delivers professional-grade scanning capabilities without the complexity or cost of institutional tools designed for full-time professional traders.
ChartMath exemplifies this approach with 200+ curated technical screens, comprehensive backtest data for every setup, a mobile swipe interface for rapid opportunity discovery, and push alerts that explain why each signal triggered. Whether you're a day trader executing rapid intraday plays, a swing trader looking for multi-day breakouts, or a beginner learning technical analysis, the platform provides the scanning capabilities you need without requiring coding knowledge or desktop-only workflows.
The difference between catching opportunities and watching them slip away often comes down to having the right tools working for you. Stop refreshing screeners manually and missing setups while you're away from your desk. Start using a real-time stock scanner that continuously monitors the market, validates setups with historical data, and delivers high-quality alerts directly to your phone.
Ready to experience real-time scanning with transparent backtest data and mobile-first design? Watch a demo to see how ChartMath's 200+ technical screens work in practice, or download the app to start discovering proven setups across multiple timeframes. You can also access the web-based screener to explore the platform's capabilities. Your next high-probability trade is forming right now—make sure you don't miss it.
Ankush Jindal
Co-Founder, ChartMath
Ankush Jindal is the Co-Founder of ChartMath, a real-time trade discovery platform that monitors 200+ technical screens across the market to surface actionable setups for technical traders. He holds a B.Tech in Computer Science from IIT Mandi. Before ChartMath, he co-founded two successful technology ventures spanning hundreds of thousands of users. This experience building data-intensive, real-time systems directly shaped his approach to technical analysis tooling. At ChartMath, Ankush leads product vision, designing intuitive interfaces that translate complex price action into clear, backtested signals. His philosophy: trading decisions should be backed by data, not gut feeling.
LinkedInSee these setups live in ChartMath
200+ curated screens with backtest data. Free to use.
Related Articles
How to Choose the Best Stock Screener App in 2026
Learn how to choose the best stock screener app for technical trading in 2026. Compare features, alerts, backtesting, and mobile tools for every trading style.
How to Choose a Stock Screener with Backtest Data
Learn how to select the best stock screener with backtest capabilities. Discover essential features like win rates, EV metrics, and real-time alerts.
How to Use an RSI Divergence Screener to Find Reversals
Learn how to use an RSI divergence screener to automatically identify bullish and bearish divergence patterns that signal high-probability trend reversals.