How to Build an Efficient Trading Workflow in 2026
You've got TradingView open on one monitor, Finviz refreshing on another, your broker's platform ready for execution, and your phone buzzing with alerts you don't have time to evaluate. By the time you've confirmed the setup, checked the chart, and clicked buy, the breakout already ran 3%. Sound familiar?
The problem isn't your trading strategy. It's your trading workflow. In 2026, successful traders don't just have good setups—they have seamless systems that connect their stock market app, charting tools, and execution platforms into one efficient machine. This guide will show you exactly how to build that system, step by step.
Why Your Trading Workflow Is Costing You Money
Every second you spend switching between platforms, confirming alerts, or manually checking charts is a second the market moves without you. The hidden cost of fragmented trading tools isn't just frustration—it's real money left on the table.
Consider this scenario: Your screener catches a VWAP reclaim on a high-volume stock at 10:47 AM. You get the alert on your phone, but you're in a meeting. By the time you open your laptop, pull up the chart on TradingView, confirm the setup still looks good, and route to your broker, it's 10:52 AM. The stock already moved 2.5% and you're chasing. You either skip the trade or enter at a worse price with a compromised risk-reward ratio.
This happens because most traders cobble together tools that were never designed to work together. Your stock screener doesn't talk to your charting platform. Your charting platform doesn't sync with your mobile alerts. Your execution software lives in its own silo. The result? Execution delays, missed entries, and alert fatigue from notifications you can't act on quickly enough.
The solution isn't working faster—it's working smarter. An integrated trading workflow eliminates the friction between discovery, analysis, and execution. When your tools communicate seamlessly, you spend less time managing technology and more time making profitable decisions.
1. Choose Your Core Trading Stack: Screeners, Charts, and Execution
Before you can integrate anything, you need to understand the three pillars of every trading workflow: discovery (screeners), analysis (charts), and execution (broker platforms). Each serves a distinct purpose, and choosing the right combination determines how efficiently you can trade.
Your stock market app or screener is your discovery engine. It continuously scans thousands of stocks and alerts you when technical setups form. The key question: does it provide real-time data or end-of-day snapshots? For day trading, you need real-time scanning across intraday timeframes (1-minute, 5-minute, 15-minute). For swing trading, end-of-day scans on daily and weekly charts work fine.
Your charting platform is where you confirm setups and plan entries. TradingView dominates this space with its clean interface and social features, while ThinkorSwim offers deeper customization for advanced traders. The critical factor for integration: does it accept external alerts and support watchlist imports? If your screener can't push symbols directly to your charts, you're stuck manually copying ticker symbols, a workflow killer.
Your execution platform is your broker's trading interface. In 2026, most brokers offer API access, which means automation tools can route orders directly from alerts. But even without full automation, you want a broker platform that loads quickly, accepts hotkey commands, and doesn't require five clicks to place a trade.
What Makes a Good Stock Screener for Integration
Not all screeners are built for integration. When evaluating a stock market app for your workflow, look for these features:
- Real-time scanning: Delayed data means delayed entries. Your screener should update continuously throughout the trading session, not every 15 minutes.
- Alert capabilities: Push notifications, email, SMS, or webhook support. The more notification options, the better you can route alerts to the right place at the right time.
- API or webhook support: This is what enables automation. Webhooks let your screener send alerts directly to other platforms like Discord, Slack, or automation tools.
- Mobile accessibility: You won't always be at your desk. A mobile-first stock market app ensures you can monitor setups during commutes, meetings, or lunch breaks.
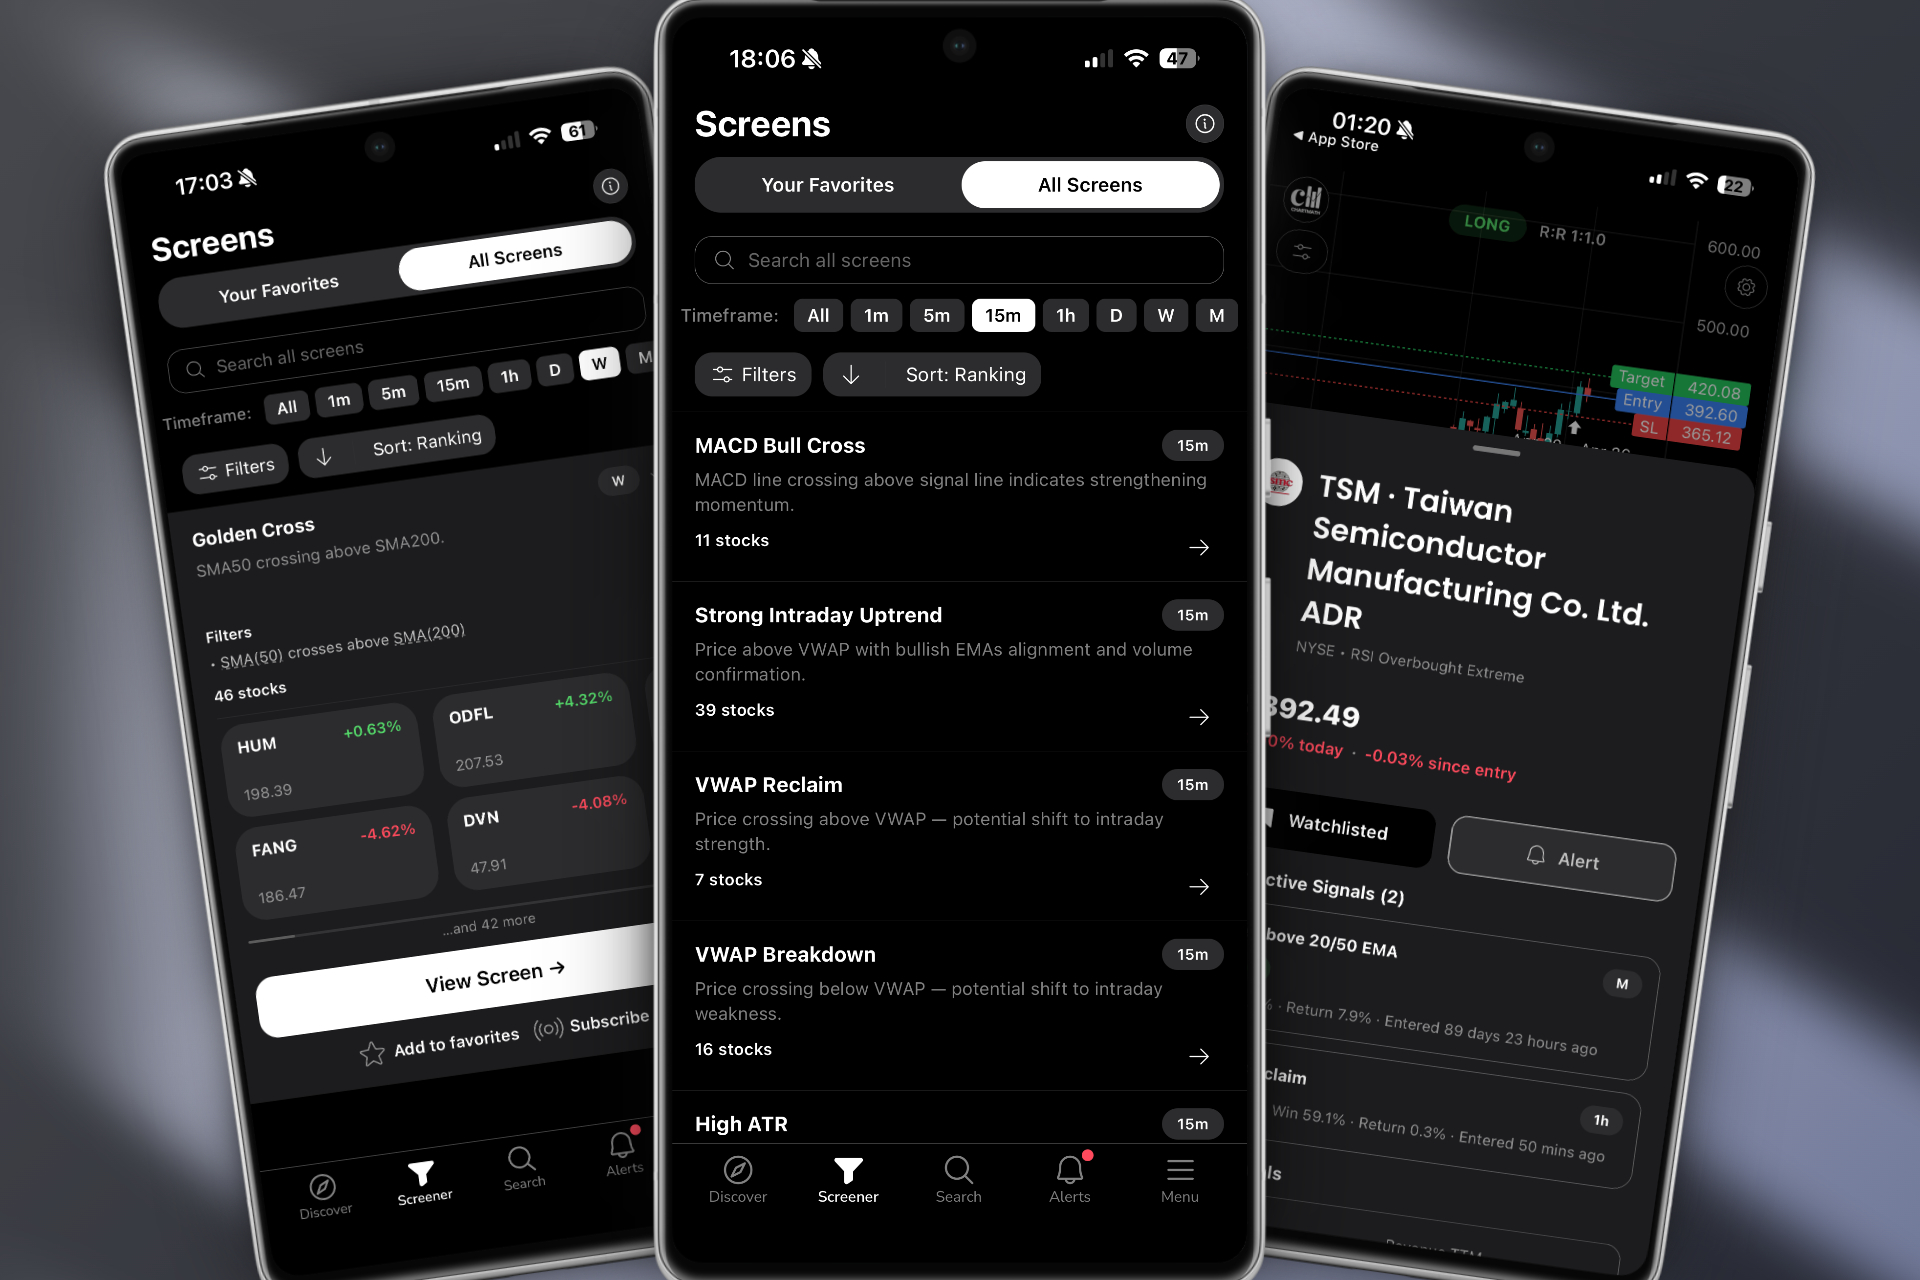
Platforms like ChartMath are designed specifically for integration. With 200+ pre-built technical screens, real-time alerts, and a mobile-first interface, it acts as the discovery layer that feeds your charting and execution platforms. You're not building screens from scratch or writing code, you're getting curated setups with backtested performance data delivered to your phone.
2. Connect Your Stock Market App to Your Charting Platform
Once you've chosen your tools, the next step is making them talk to each other. The goal: when your screener finds a setup, that symbol should appear instantly in your charting platform with minimal manual intervention.

The simplest integration method is watchlist syncing. Many screeners let you export watchlists as CSV files or share them via URL. TradingView, for example, accepts watchlist imports, so you can create a "Morning Breakouts" watchlist in your screener and import it directly into TradingView at market open. This works well for swing traders who prepare watchlists the night before.
For real-time integration, you need webhook alerts. Here's how it works: your stock market app detects a setup (say, an ORB breakout on a 5-minute chart). Instead of just sending you a push notification, it fires a webhook to a URL you've configured. That webhook can trigger actions in other platforms, opening a chart, adding the symbol to a watchlist, or even sending a formatted alert to your phone with a direct link to the chart.
Tools like Zapier and IFTTT act as middleware, connecting platforms that don't natively integrate. For example, you could set up a Zap that says: "When ChartMath sends an alert for a VWAP reclaim, automatically create a TradingView alert for that symbol and send me a Telegram message with the chart link." This eliminates the manual steps between discovery and analysis.
Browser extensions also help bridge gaps. Some traders use tools like AutoHotkey or browser automation scripts to automatically paste ticker symbols from alerts into their charting platform's search bar. It's not as elegant as a native API integration, but it's faster than doing it manually.
The key principle: reduce clicks and context switches. Every time you have to copy a symbol, switch tabs, or manually search for a stock, you're adding friction. The best workflows feel almost automatic, alert fires, chart opens, you make a decision.
3. Automate Alert Routing Between Platforms
Alerts are only valuable if they reach you at the right time, in the right format, with enough context to make a decision. The challenge in 2026 isn't getting alerts, it's getting the right alerts without drowning in noise.
Start by creating an alert hierarchy based on priority and timeframe. High-priority setups (like breakout trading opportunities with strong volume confirmation) should trigger push notifications to your phone. Medium-priority setups might go to email or a Slack channel you check periodically. Low-priority or experimental setups can populate a watchlist you review at the end of the day.
This is where a quality-filtered stock market app becomes essential. If your screener sends you 200 alerts per day with no ranking or context, you'll either ignore them all or waste hours evaluating low-probability setups. Platforms like ChartMath solve this by ranking setups by quality and freshness, showing you the best opportunities first. Each alert includes plain-English explanations of why the setup triggered and what the historical edge is.
For traders using multiple strategies, create separate alert channels for each approach. Your momentum trading alerts might go to your phone for immediate action, while your swing trade setups go to an email digest you review after market close. This prevents intraday noise from interfering with your longer-term planning.
Automation tools like Zapier can route alerts based on conditions. For example: "If ChartMath sends a breakout alert on a stock with RVOL above 3.0, send a push notification. If RVOL is below 3.0, add it to a watchlist for later review." This kind of conditional routing ensures you only get interrupted for the setups that matter most.
Don't forget about time-based filtering. If you're a day trader who only trades the first two hours of the market, configure your alerts to only fire between 9:30 AM and 11:30 AM ET. There's no point getting pinged about a 2:00 PM setup if you're done trading for the day.
4. Build Multi-Timeframe Monitoring Systems
Professional traders don't just watch one timeframe, they monitor multiple simultaneously to catch setups as they develop. A stock might be forming a daily breakout while also showing a 5-minute VWAP reclaim. Both are tradeable, but they require different position sizes and hold times.
The challenge: how do you monitor 1-minute, 5-minute, 15-minute, hourly, daily, and weekly charts across dozens of stocks without losing your mind? The answer is layered screening systems.
For day trading, set up separate screens for each intraday timeframe. Your 1-minute screen catches scalp opportunities and early momentum. Your 5-minute screen identifies ORB breaks and VWAP plays. Your 15-minute screen spots larger intraday trends. Each timeframe gets its own alert channel, so you know immediately what kind of setup you're looking at.
For swing trading, focus on daily and weekly scans. Run these after market close to prepare your watchlist for the next day. Look for stocks setting up near key levels, forming chart patterns, or showing relative strength. Your swing trading workflow should be front-loaded, do the analysis at night so you can execute quickly when setups trigger during the day.
The beauty of a comprehensive stock market app like ChartMath is that it runs all these timeframes simultaneously. You don't need to manually switch between 1-minute and daily charts, the platform monitors everything and alerts you when setups form on any timeframe. You can filter by timeframe in the app to focus on what matters for your current trading session.
Mobile apps are critical here. When you're away from your desk, you need a way to monitor multiple timeframes without lugging a laptop around. A mobile-first platform with swipe-based navigation lets you quickly scan through setups across all timeframes, prioritize the best opportunities, and add them to watchlists for deeper analysis later.
5. Integrate Backtesting Data Into Your Decision Process
Here's a question most traders can't answer: what's the historical win rate of the setup you're about to trade? If you don't know, you're trading blind.
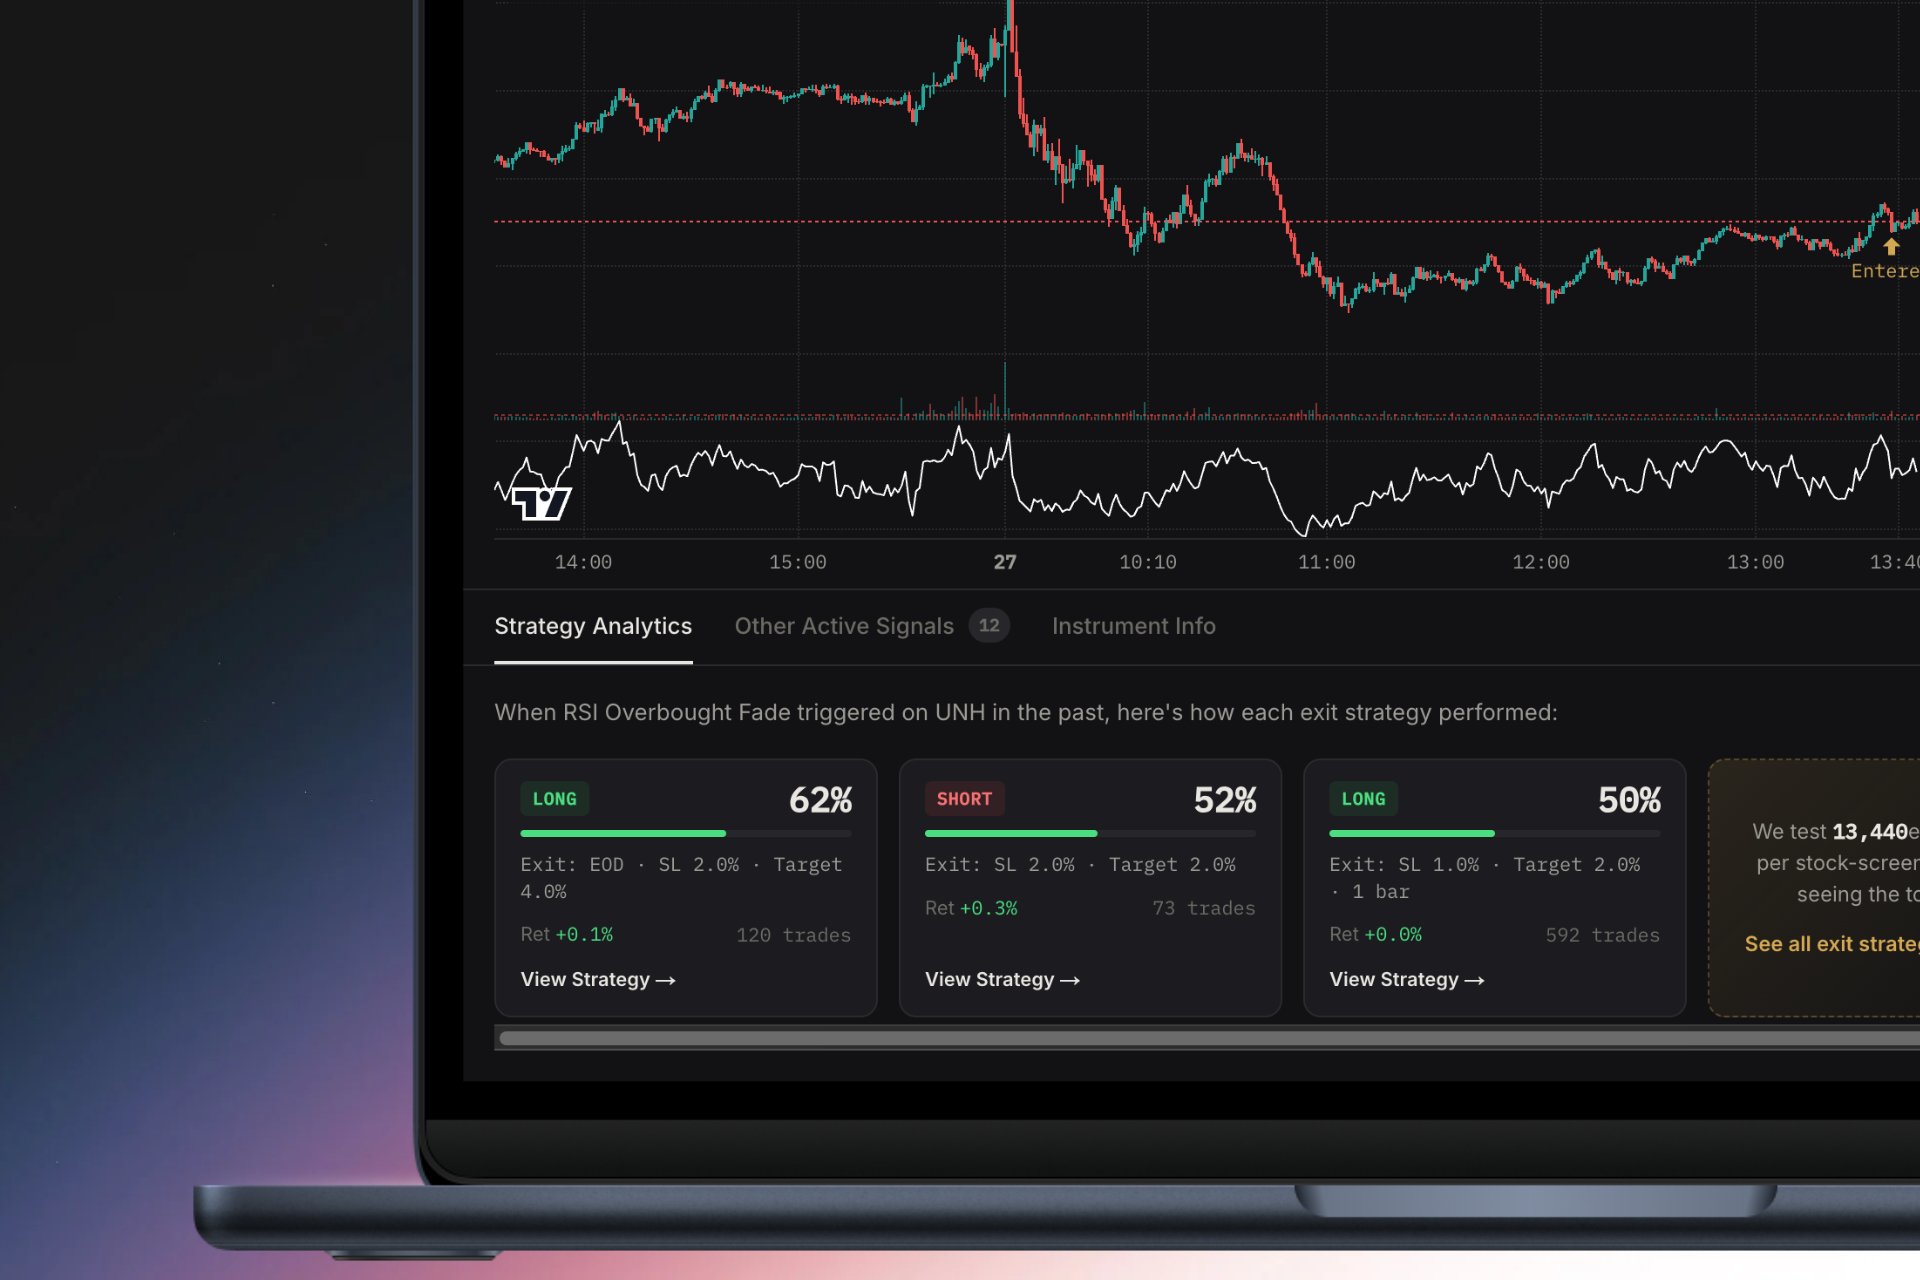
In 2026, the best trading workflows don't just identify setups, they show you backtested performance data before you risk a dollar. This means knowing the win rate, average return, maximum drawdown, and sample size for every technical pattern you trade.
Most screeners tell you what is happening ("Stock XYZ broke above VWAP"). Few tell you why it matters ("This setup has a 64% win rate and averages 2.3% return over the next 3 days"). That context is the difference between a random alert and an actionable trade signal.
When evaluating a stock market app, ask: does it provide backtested data for its screens? Can you see historical performance across different exit strategies (1%, 2%, 5% profit targets)? Is the sample size large enough to be statistically meaningful?
ChartMath builds this into every screen. When you see a VWAP reclaim alert, you also see that this setup has been backtested across thousands of historical occurrences, with transparent data on what percentage of trades were profitable and what the average return was. This lets you filter out low-probability setups and focus on patterns with proven edges.
Backtesting also helps you calibrate position sizing. A setup with a 70% win rate and 3% average return deserves a larger position than a 52% win rate setup with 1.5% average return. Without this data, you're guessing. With it, you're making informed risk-adjusted decisions.
For traders who want to run their own backtests, platforms like TradingView offer Pine Script for custom strategy testing. But this requires coding knowledge and significant time investment. The advantage of a platform with pre-built, backtested screens is that the work is already done, you get the data without writing a single line of code.
6. Create a Mobile-First Workflow for Active Traders
Let's be honest: you're not always at your desk. You're in meetings, commuting, grabbing lunch, or picking up your kids. If your trading workflow only works when you're sitting in front of three monitors, you're going to miss opportunities.
A mobile-first workflow doesn't mean trading exclusively from your phone, it means your phone is a capable companion that keeps you connected to the market when you're away from your primary setup. The goal is situational awareness: knowing when high-quality setups form so you can decide whether to act immediately or wait until you're back at your desk.
The best stock market apps in 2026 are designed mobile-first. They understand that traders need quick, swipeable interfaces that surface the most important information without endless scrolling or tiny charts. Think TikTok-style vertical feeds where each card shows a setup, the key data, and a clear action (add to watchlist, view chart, dismiss).
ChartMath pioneered this approach with a swipe-based discover feed that ranks setups by quality and freshness. You're not scrolling through a spreadsheet of ticker symbols, you're swiping through curated opportunities with visual charts, backtest data, and plain-English explanations. It's designed for the 30 seconds you have between meetings, not the 30 minutes you have at your desk.
Mobile alerts need to be context-rich. A notification that says "AAPL alert triggered" is useless. A notification that says "AAPL: 5m VWAP reclaim + RVOL 2.8x | 64% win rate | View chart" gives you everything you need to make a decision. You can tap through to see the full setup, add it to a watchlist, or dismiss it if it doesn't fit your current strategy.
Balance is important. You don't want to be glued to your phone all day, but you also don't want to miss a perfect setup because you were offline. Configure your mobile alerts to only fire for your highest-conviction setups, and use watchlists for everything else. Review your watchlists during natural breaks in your day, before market open, at lunch, after market close.
7. Optimize Your Workflow to Eliminate Alert Fatigue
Alert fatigue is real. When you get 50 notifications a day and only 3 of them are worth trading, you start ignoring all of them. The solution isn't fewer alerts, it's better alerts.
Quality filtering is the first line of defense. Your stock market app should have built-in filters for volume, price, market cap, and other criteria that define tradeable setups. If you only trade stocks above $10 with average volume over 1 million shares, configure those filters once and never see alerts for penny stocks or illiquid names.
Ranking systems are equally important. Not all breakouts are created equal. A breakout with 5x relative volume and a tight consolidation is higher quality than a breakout on weak volume with a sloppy base. Platforms that rank setups by quality, using factors like volume confirmation, pattern tightness, and historical performance, help you focus on the best opportunities first.
Context is critical. An alert that just says "Breakout detected" requires you to do all the work: pull up the chart, check the volume, evaluate the pattern, decide if it's worth trading. An alert that says "Tight consolidation breakout | RVOL 3.2x | 68% win rate | Avg return 2.8%" gives you the context to make an instant decision. This is where ChartMath's plain-English explanations shine, every alert tells you why it triggered and what the edge is.
Time-based scheduling prevents alert overload. If you're a premarket scanner user, you only want alerts between 4:00 AM and 9:30 AM ET. If you're a swing trader, you want end-of-day alerts, not intraday noise. Configure your alerts to match your actual trading schedule.
Finally, use separate channels for different strategies. Your VWAP trading alerts shouldn't mix with your swing trade setups. Create distinct watchlists, alert channels, or notification groups for each strategy so you can focus on one approach at a time without distraction.
8. Test and Refine Your Integrated Trading Workflow
You've built your workflow. Now you need to test it under real market conditions, without risking real money. This is where paper trading becomes essential.
Run your integrated workflow in simulation mode for at least two weeks. Track these metrics:
- Alert-to-chart time: How long does it take from receiving an alert to viewing the chart? Target: under 10 seconds.
- Chart-to-execution time: How long from confirming the setup to placing the order? Target: under 30 seconds.
- Missed opportunities: How many setups triggered while you were away or unable to act? This tells you if your mobile workflow needs improvement.
- False alerts: How many alerts didn't meet your criteria when you reviewed them? This indicates your filters need tightening.
- Execution slippage: How much did the stock move between alert and execution? This reveals workflow bottlenecks.
Identify friction points. Maybe your charting platform takes 15 seconds to load. Maybe your broker's app requires too many clicks to place an order. Maybe you're getting alerts for setups that don't match your strategy. Each friction point is an opportunity to optimize.
Iterate based on real data. If you're missing too many opportunities because you're away from your desk, invest more in your mobile workflow. If you're getting overwhelmed by alerts, tighten your quality filters or reduce the number of screens you're monitoring. If your backtested setups aren't performing as expected, review your entry timing and exit strategy.
The best workflows evolve. What works in January might need adjustment by March as market conditions change. Schedule monthly reviews where you analyze your workflow efficiency, update your filters, and test new integration tools. Trading technology improves constantly, your workflow should too.
Common Integration Mistakes to Avoid
Even experienced traders make these workflow mistakes. Avoid them and you'll save yourself months of frustration:
Over-complicating your stack: You don't need seven different screeners and four charting platforms. More tools create more complexity, not better results. Choose one excellent stock market app, one charting platform, and one execution platform. Master that stack before adding anything else.
Ignoring mobile accessibility: If your workflow only works at your desk, you're limiting your opportunities. In 2026, mobile-first design isn't optional, it's essential. Make sure every component of your workflow has a mobile version or companion app.
Not validating setups with backtested data: Trading patterns because they "look good" is gambling. Always know the historical performance of the setups you trade. If your screener doesn't provide backtest data, you're flying blind.
Failing to filter alerts by quality: Volume matters. Pattern quality matters. Historical performance matters. If your screener treats all alerts equally, you'll waste time on low-probability setups. Use platforms that rank and filter setups by quality metrics.
Relying on platforms without real-time data: For day trading and intraday trading, delayed data is useless. A 15-minute delay means you're seeing setups that already ran. Invest in real-time data feeds or use platforms that include them.
Skipping the testing phase: Don't go live with a new workflow on day one. Paper trade it first. Identify the bugs, bottlenecks, and friction points before you risk real capital.
Building Your Workflow with ChartMath
If you're looking for a stock market app designed specifically for workflow integration, ChartMath checks every box. It's built to be the discovery layer that feeds your existing charting and execution platforms, not replace them.
Here's how ChartMath fits into a modern trading workflow:
Discovery: ChartMath runs 200+ technical screens in real-time across all timeframes, 1-minute, 5-minute, 15-minute, hourly, daily, weekly, and monthly. You're not building screens from scratch or writing code. The platform monitors ORB breaks, VWAP reclaims, RVOL spikes, breakout trading setups, momentum plays, and dozens of other proven patterns. Every screen includes backtested performance data: win rate, average return, drawdown, and sample size.
Mobile-first design: The TikTok-style swipe interface lets you discover ranked setups in seconds. Each card shows the chart, the setup explanation, the backtest data, and clear actions (add to watchlist, view full chart, dismiss). You can monitor the market from anywhere, commuting, between meetings, or waiting in line for coffee.
Context-rich alerts: ChartMath doesn't just tell you what happened, it tells you why it matters. Every alert includes a plain-English explanation of why the setup triggered and what the historical edge is. No more guessing whether an alert is worth your attention.
Quality filtering: Setups are ranked by quality and freshness, so you see the best opportunities first. You can filter by timeframe, strategy type, volume, and other criteria to match your trading style. This eliminates alert fatigue and keeps you focused on high-probability setups.
Seamless integration: ChartMath is designed to complement your existing tools, not replace them. Use it to discover setups, then route to TradingView or ThinkorSwim for detailed chart analysis. Add symbols to custom watchlists that sync across devices. Configure alerts to fire only when your highest-conviction setups form.
Getting started is simple. Download the app and explore the discover feed. Swipe through setups, add interesting stocks to watchlists, and configure alerts for your preferred strategies. You can start with the free tier to test the workflow, then upgrade as you see value. Watch the demo to see how the platform works in action.
For traders who want the full web experience, the web-based screener offers the same 200+ screens with larger charts and more detailed filtering options. Use the web version for deep research and watchlist building, then monitor those watchlists on mobile throughout the day.
The key insight: ChartMath doesn't try to be everything. It's laser-focused on one job, helping you discover high-quality technical setups backed by data. It integrates into your workflow as the discovery engine, feeding your charting and execution platforms with actionable opportunities. No coding required. No manual scanning. Just curated setups delivered to your phone when they matter most.
In 2026, the traders who win aren't the ones with the most tools, they're the ones with the most efficient workflows. By integrating a quality stock market app like ChartMath with your charting and execution platforms, you eliminate the friction that costs you money. You spend less time managing technology and more time making profitable trades. Start building your integrated workflow today, and stop missing opportunities because your tools don't talk to each other.

Ankush Jindal
LinkedInSee these setups live in ChartMath
200+ curated screens with backtest data. 14-day free trial.