How to Build Winning Backtesting Strategies: A Complete Guide
You've found a setup that looks perfect. The chart screams "buy," the momentum is there, and you pull the trigger. Then it reverses. Again. You start to wonder: is this setup actually profitable, or are you just gambling on patterns that look good in hindsight?
This is where backtesting strategies become your competitive edge. Instead of trading on gut feeling or cherry-picked examples, backtesting lets you validate whether a technical setup actually works across hundreds of historical trades. You'll discover the real win rate, the average profit per trade, and the maximum drawdown before you risk a single dollar of real capital.
In this complete guide, you'll learn the exact 7-step process for building winning backtesting strategies that improve your trading performance. Whether you're a day trader chasing ORB breaks or a swing trader looking for breakout setups, you'll discover how to evaluate historical data, track key metrics, and use modern tools to automate the entire process without writing a single line of code.
What Are Backtesting Strategies and Why Do They Matter?
Backtesting strategies are systematic methods for testing trading setups against historical market data to determine whether they would have been profitable in the past. Think of it as a time machine for your trading ideas. You define specific entry and exit rules, then run those rules against months or years of real price action to see what would have happened.
Here's why this matters: most traders lose money because they trade patterns that feel right but have no statistical edge. A breakout might look explosive on one chart, but when you test that same pattern across 200 occurrences, you might discover it only wins 35% of the time with a negative expected value. Without backtesting, you're flying blind.
The difference between theoretical edge and proven edge is everything. You might read that VWAP reclaims work well for momentum plays, but does that setup actually deliver consistent profits with your specific entry rules, timeframe, and exit strategy? Backtesting gives you the answer with hard data instead of hopeful assumptions.
Common mistakes traders make without backtesting include chasing setups based on recent wins (recency bias), abandoning strategies after a few losses (small sample size), and trading emotionally instead of systematically. When you have backtested data showing a setup wins 58% of the time with an average return of 2.3% per trade, you can execute with confidence even during losing streaks because you know the math is on your side.
1. Choose the Technical Setups You Want to Backtest
Before you can build backtesting strategies, you need to identify which technical setups are worth testing. Start with proven patterns that align with your trading style and schedule. Day traders should focus on intraday setups like Opening Range Breakouts (ORB), VWAP reclaims, and RVOL spikes on 1-minute, 5-minute, and 15-minute timeframes. Swing traders should test breakout patterns, momentum indicators, and chart patterns on daily and weekly charts.
Popular technical setups worth backtesting include:
- ORB (Opening Range Breakout): Stocks breaking above or below the first 5, 15, or 30 minutes of trading
- VWAP reclaims: Price crossing back above VWAP after trading below, signaling potential momentum shift
- Breakout patterns: Stocks breaking resistance levels, consolidation ranges, or chart patterns like ascending triangles
- Momentum indicators: RSI divergences, MACD crossovers, or relative volume spikes above 2x average
- Reversal setups: Oversold bounces, support tests, or failed breakdown patterns
The key is to focus on 3-5 core setups instead of trying to backtest dozens of patterns simultaneously. Master a few high-probability setups that match your personality and schedule. If you can only check charts once per day, don't backtest 5-minute scalping setups. If you hate holding overnight risk, don't test swing trading strategies. Your backtesting strategies should reflect how you actually want to trade.
Timeframe considerations matter significantly. A breakout setup that works beautifully on the daily chart might fail miserably on the 5-minute chart due to noise and false signals. Similarly, an ORB strategy optimized for the first 15 minutes might not translate to end-of-day breakouts. Test each setup on the specific timeframe you plan to trade, and be prepared to discover that some patterns only work in certain contexts.
2. Define Your Entry and Exit Rules Clearly
Vague rules kill backtesting strategies. You can't backtest "buy when it looks strong" or "sell when momentum fades." Every decision point must be specific, measurable, and repeatable. This is where most traders struggle because they trade discretionarily but try to backtest systematically.
Your entry criteria should answer these questions with precision:
- What exact price level triggers the entry? (e.g., "Buy when price closes above the 15-minute ORB high")
- What confirmation is required? (e.g., "Volume must be 1.5x the 5-minute average")
- What time restrictions apply? (e.g., "Only take setups between 9:45 AM and 3:00 PM EST")
- What filters eliminate low-quality setups? (e.g., "Stock must have RVOL above 1.5 and price above $5")
Exit rules are equally critical. You need to define profit targets and stop losses before you run the backtest. Percentage-based targets work well for systematic testing: "Take profit at 3% gain, stop loss at 1.5% loss." Technical level exits add complexity but can improve results: "Exit when price closes below VWAP or reaches the prior day's high."
Time-based exits matter for day traders who don't hold overnight. A rule like "close all positions 15 minutes before market close regardless of profit/loss" prevents overnight gaps from skewing your backtest results. This is especially important when testing day trading strategies that rely on intraday momentum.
Consistency is everything. If you apply a 2% stop loss on winning trades but give losing trades "room to breathe" with a 5% stop, your backtest results will be meaningless. The rules must apply identically to every single trade, no exceptions. This discipline separates profitable systematic traders from gamblers who bend their rules based on how they feel.
3. Gather Historical Data for Your Backtesting Strategies
The quality of your backtesting strategies depends entirely on the quality and quantity of your historical data. Garbage data produces garbage results, and insufficient data produces unreliable conclusions.
How much data do you need? At minimum, test across 6-12 months of historical price action. Ideally, gather 2-3 years of data to capture different market conditions: bull markets, bear markets, high volatility periods, and choppy sideways action. A strategy that only works during the 2024 bull run isn't a strategy—it's luck.
Data granularity matters based on your trading style. Day traders need tick-level or minute-level data to accurately test intraday setups. End-of-day data won't capture the nuances of a 5-minute ORB break or a VWAP reclaim at 10:30 AM. Swing traders can use daily or weekly data since they're holding positions across multiple sessions.
Free data sources include Yahoo Finance for daily data and some brokers provide limited historical intraday data. Paid sources like Polygon.io, Alpha Vantage, or IQFeed offer higher quality tick data with fewer gaps and errors. The investment is worth it if you're serious about building reliable backtesting strategies.
Market condition diversity is critical. If you only test during a raging bull market where everything goes up, your backtest will show inflated win rates that evaporate during the next correction. Make sure your data set includes:
- Trending markets (both up and down)
- Range-bound choppy periods
- High volatility events (earnings seasons, Fed announcements)
- Low volatility summer doldrums
Sample size determines statistical significance. Testing a setup across 10 trades tells you almost nothing. You need a minimum of 30-50 occurrences to start drawing conclusions, and 100+ trades gives you much higher confidence. If your backtest only finds 15 examples of your setup over two years, either your filters are too restrictive or the setup is too rare to trade consistently.
4. Run Your Backtest and Track Key Performance Metrics
Now comes the moment of truth: running your backtest and discovering whether your setup actually makes money. But raw profit/loss numbers don't tell the whole story. You need to track specific performance metrics that reveal the true quality of your backtesting strategies.
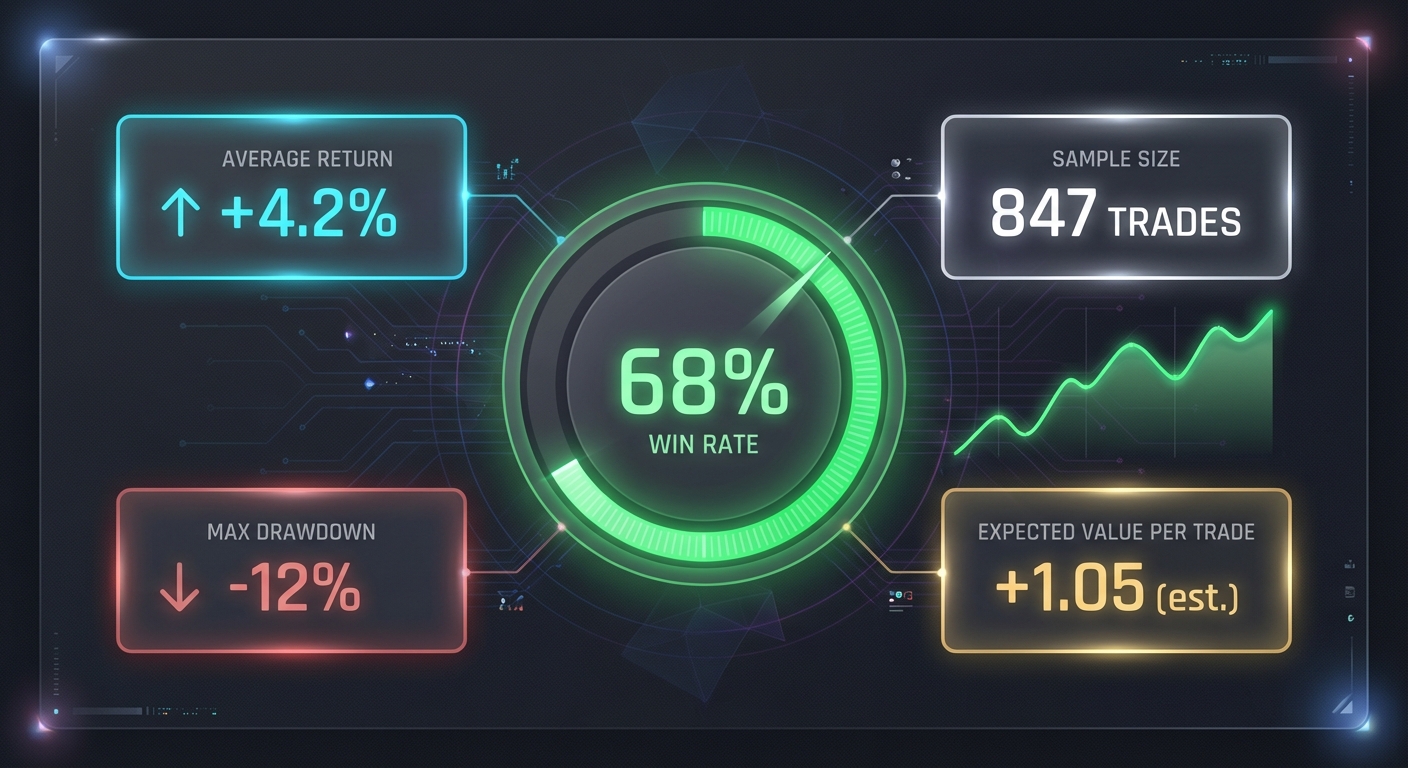
Win rate is the percentage of trades that close profitably. A 60% win rate means 6 out of 10 trades make money. But here's the trap: high win rates don't guarantee profitability. A strategy with a 70% win rate that makes $100 on winners but loses $300 on losers will destroy your account.
Expected value per trade (EV) is the average profit or loss per trade across all occurrences. This is the single most important metric. Calculate it by adding up all profits and losses, then dividing by the number of trades. A positive EV means the strategy is profitable over time. An EV of $45 per trade means you expect to make $45 on average every time you take this setup.
Maximum drawdown measures the largest peak-to-trough decline in your account during the backtest period. If your strategy made steady gains but had one brutal losing streak that dropped your account 25%, you need to know that before going live. Most traders can't psychologically handle drawdowns above 15-20%, even if the strategy eventually recovers.
Other critical metrics include:
- Profit factor: Total profits divided by total losses (above 1.5 is solid, above 2.0 is excellent)
- Average win vs average loss: Your winners should be larger than your losers for positive expectancy
- Consecutive losses: How many losing trades in a row occurred? Can you handle that emotionally?
- Time in trade: How long do positions typically last? Does this match your schedule?
For traders without coding knowledge, manual backtesting is tedious and error-prone. You'd need to scroll through hundreds of charts, record every setup occurrence, calculate entries and exits, and track all the metrics in spreadsheets. This is where modern tools change the game.
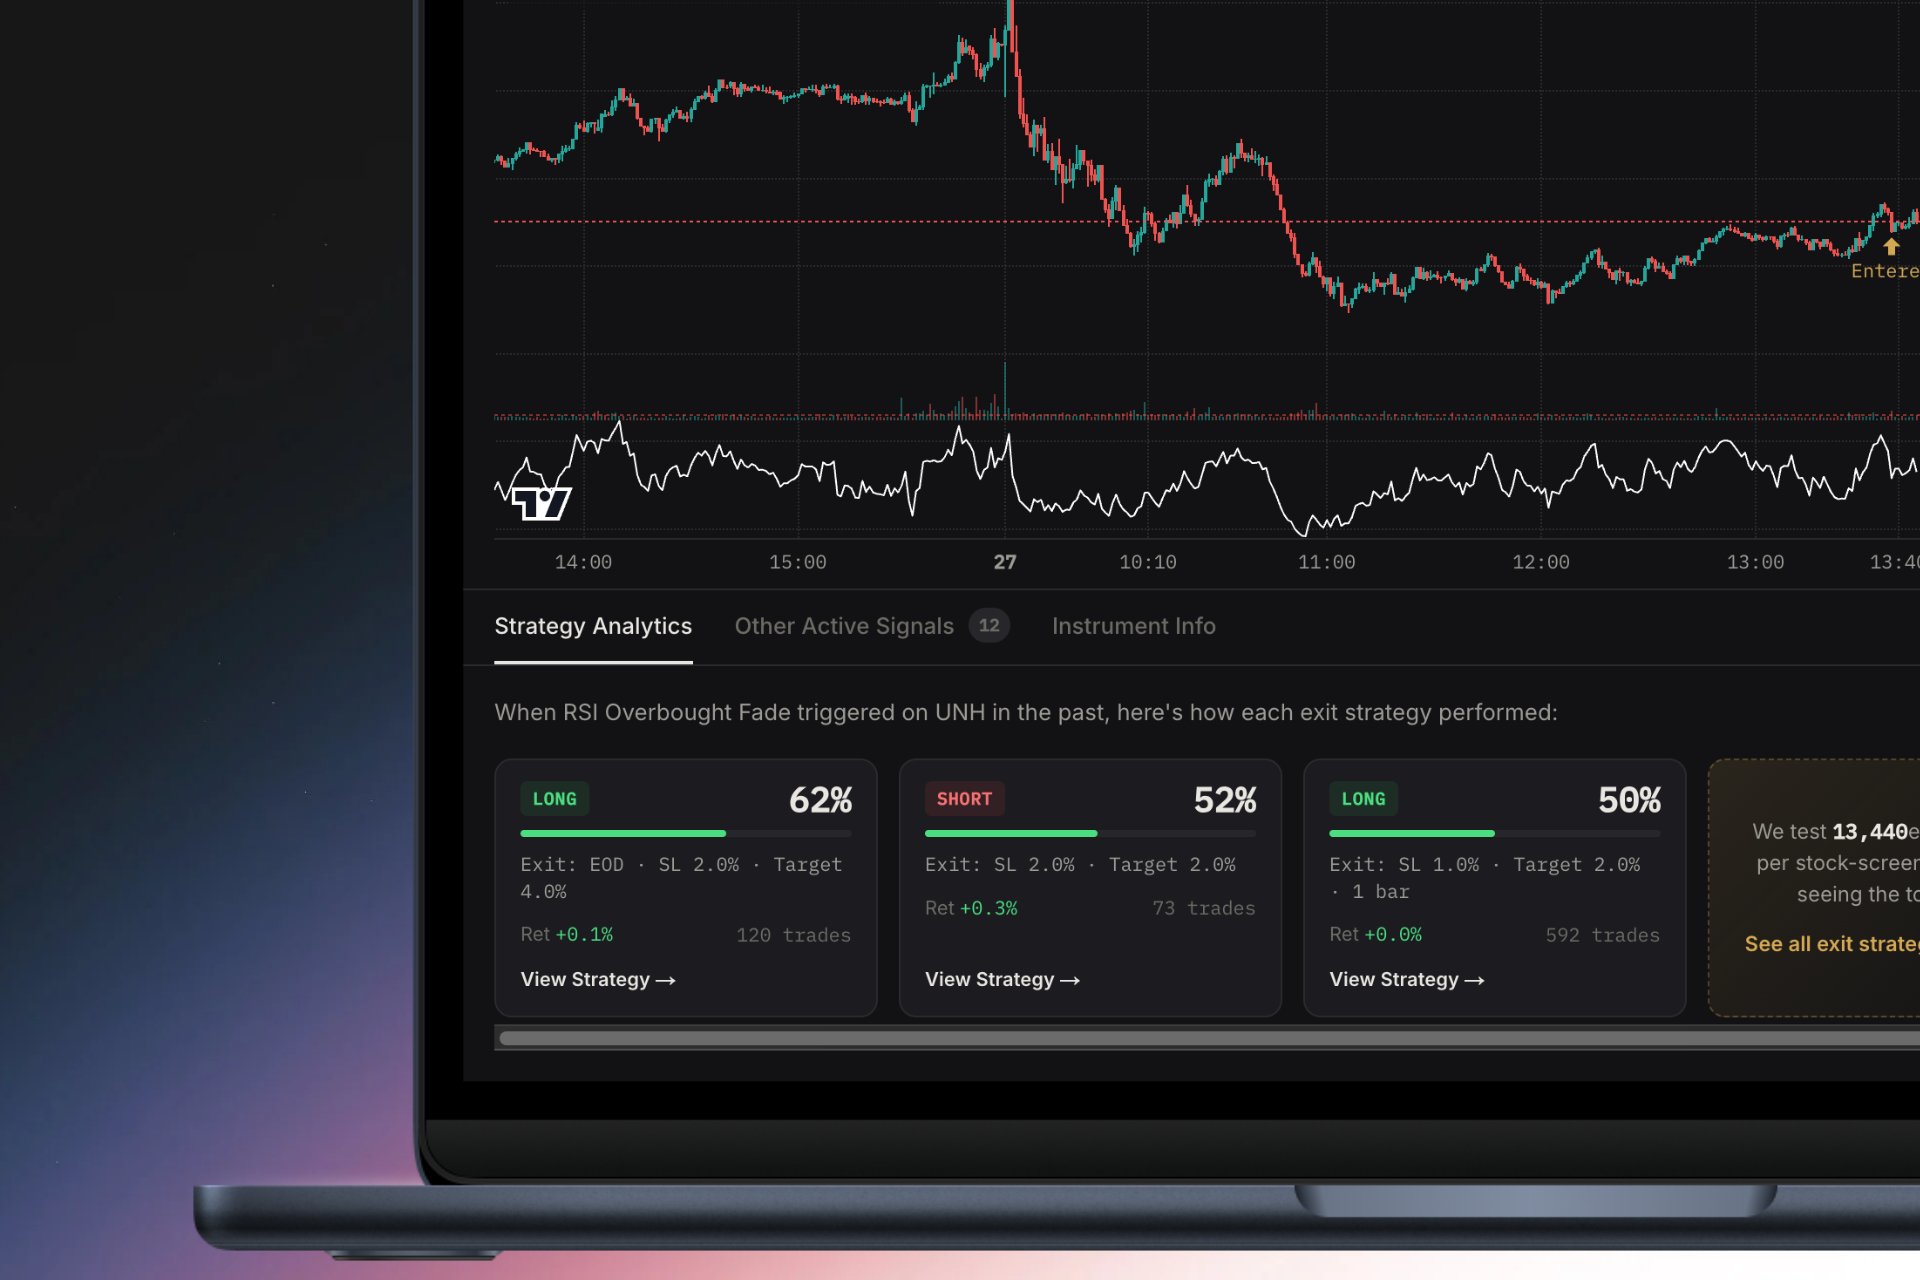
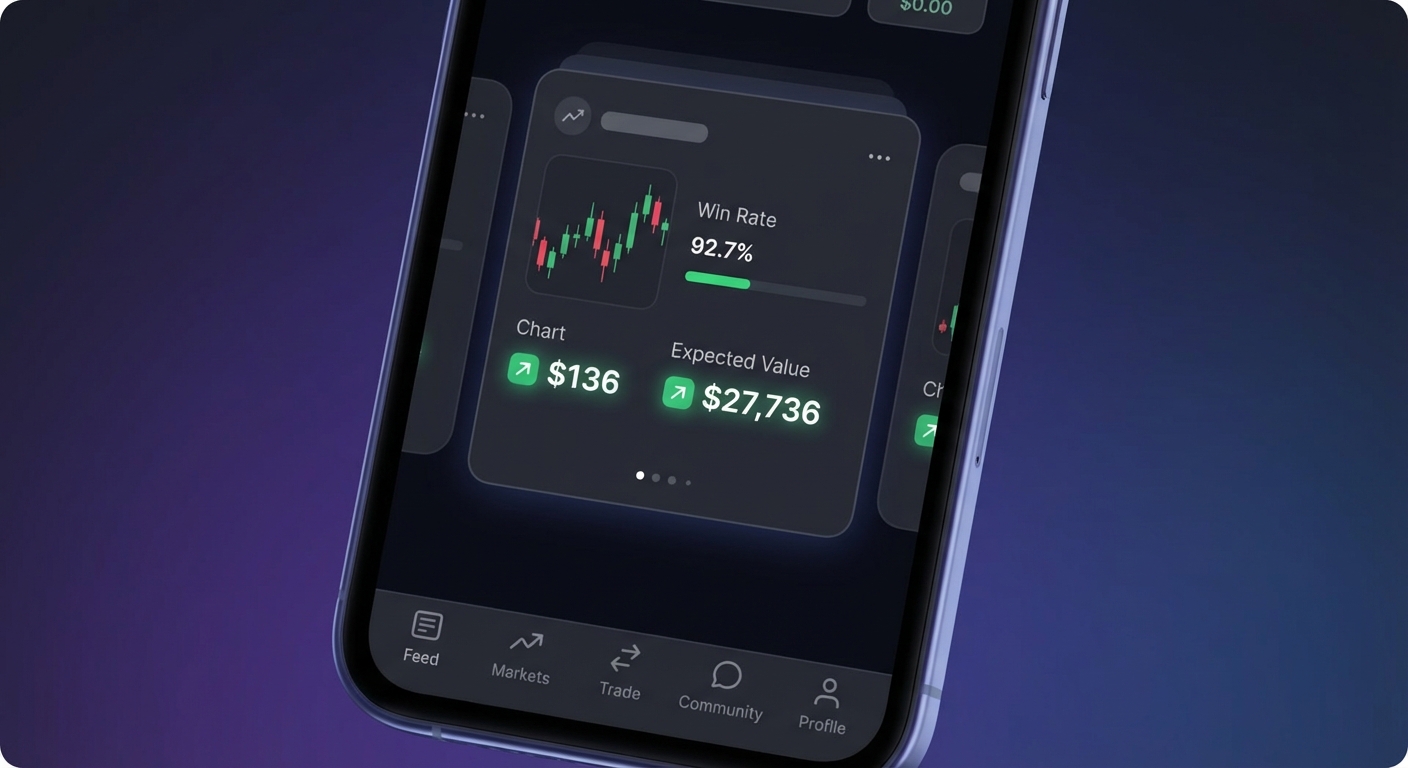
Platforms like ChartMath automate the entire process by providing pre-built backtested data for 200+ technical screens including ORB, VWAP, breakouts, and momentum indicators. Instead of spending weeks coding and testing, you can instantly see the historical win rate, expected value per trade, and drawdown for each setup. The platform scans the market in real-time and shows you which setups are forming right now, backed by the same backtest data you'd spend months generating manually.
This approach lets you focus on execution and refinement instead of data collection and calculation. You can compare the performance of different setups, timeframes, and filters in minutes instead of weeks.
5. Analyze Results and Identify What's Working
You've run your backtest and collected the metrics. Now comes the detective work: figuring out why certain trades won and others lost, and identifying patterns that can improve your backtesting strategies.
Start by comparing win rate to expected value. A strategy with a 45% win rate but an EV of $60 per trade is more profitable than a 65% win rate with an EV of $20 per trade. The first strategy wins less often but makes much more when it wins. The second strategy feels better psychologically (more frequent wins) but makes less money. Choose based on your personality and goals.
Identify which market conditions favor your strategy. Sort your backtest results by market environment:
- Does the setup work better in trending markets or range-bound conditions?
- Do you see higher win rates during high volatility or low volatility periods?
- Are certain days of the week more profitable? (Monday gaps vs Friday profit-taking)
- Does time of day matter? (Morning momentum vs afternoon chop)
Analyze your losing trades for patterns. If 80% of your losses occur when RVOL is below 1.5, you've discovered a valuable filter. If breakouts fail more often when they occur in the final hour of trading, add a time restriction. Every losing trade contains information that can refine your rules.
Compare performance across different timeframes and symbols. A VWAP reclaim strategy might work beautifully on large-cap tech stocks but fail on small-cap biotech. An ORB setup might crush on the 15-minute chart but produce mediocre results on the 5-minute chart. Test variations to find the sweet spot. You can learn more about comparing different technical setups in our guide on VWAP vs RVOL vs ORB indicators.
Watch for red flags that indicate overfitting or curve-fitting:
- Results that seem too good to be true (90%+ win rates, no losing months)
- Performance that degrades significantly when you change parameters slightly
- Strategies with 10+ filters that seem designed to avoid every historical loss
- Backtest results that don't match forward testing performance
Overfitting happens when you optimize a strategy so heavily to past data that it has no predictive power for future trades. It's like memorizing last year's test answers instead of learning the material. The strategy "worked" historically because you designed it to avoid every historical loss, but it falls apart in live trading.
6. Optimize and Refine Your Backtesting Strategies
Your first backtest rarely produces optimal results. The refinement process is where good strategies become great, but it's also where traders fall into the overfitting trap. The key is making incremental, logical adjustments based on what you learned in the analysis phase.
Start with simple refinements to entry and exit rules. If your analysis showed that trades entered in the first 30 minutes had lower win rates, adjust your rule to avoid that period. If your average winner is 4% but you're taking profit at 2%, test a 3% or 3.5% target. Make one change at a time so you can measure its impact.
Test variations of the same core setup across different parameters:
- Different timeframes: Does the 15-minute ORB outperform the 5-minute version?
- Different profit targets: 2% vs 3% vs 5% take-profit levels
- Different stop losses: 1% vs 1.5% vs 2% risk per trade
- Different time windows: First hour only vs all-day vs avoiding lunch chop
Adding quality filters can dramatically improve results without overfitting. Common filters that improve most backtesting strategies include:
- RVOL (Relative Volume): Only take setups when volume is 1.5x or 2x average
- Price range: Avoid penny stocks under $5 or illiquid stocks under 500K average volume
- Trend alignment: Only take long setups when price is above the 20-day moving average
- Market environment: Avoid trading when the SPY is down more than 1% (risk-off days)
The danger of over-optimization is real. If you keep tweaking parameters until your backtest shows perfect results, you've created a strategy that worked in the past but won't work in the future. Signs you're over-optimizing include:
- Adding filters specifically to eliminate historical losses without logical reasoning
- Using very specific parameter values (e.g., "only trade when RSI is exactly between 47.3 and 52.8")
- Creating strategies with 8+ conditions that must all align perfectly
- Constantly adjusting rules every time you see a losing trade
Know when to abandon a strategy versus when to refine it. If a setup shows a negative expected value across 100+ trades in multiple market conditions, it's not a viable strategy—move on. But if a setup shows promise with a positive EV and reasonable drawdowns, refinement can turn it into a reliable edge.
7. Validate with Forward Testing and Paper Trading
Backtesting strategies tell you what would have worked in the past. Forward testing tells you what actually works right now. This is the critical validation step that separates theoretical strategies from real trading systems.
Forward testing means running your strategy in real-time market conditions without risking capital. You watch for your setup to trigger, record the entry, and track the outcome according to your rules. This reveals issues that backtesting can't capture: slippage, execution delays, emotional reactions, and changing market dynamics.
Paper trading is forward testing with simulated money. Most brokers offer paper trading accounts where you can execute your strategy as if it were real, but without financial risk. This is essential before going live because it exposes practical challenges:
- Can you actually get filled at your target entry price, or does slippage eat your edge?
- Do you receive alerts in time to act, or do you miss entries while away from your screen?
- Can you execute the strategy consistently, or do emotions cause you to bend the rules?
- Does the setup occur frequently enough to trade regularly, or are opportunities too rare?
Track live performance versus backtested expectations. If your backtest showed a 58% win rate but your forward testing shows 42% after 30 trades, something is wrong. Either market conditions have changed, your execution differs from your backtest assumptions, or the backtest was flawed. Don't ignore this gap—investigate it.
How long should you forward test before going live? At minimum, track 20-30 occurrences of your setup in real-time. If your setup triggers daily, that's a month of forward testing. If it triggers weekly, that's 5-7 months. The goal is to build confidence that the strategy performs similarly to the backtest before risking real capital.
Using real-time alerts makes forward testing practical for busy traders. Instead of watching charts all day waiting for your setup, you can receive notifications when your backtested strategy triggers. ChartMath provides real-time alerts when stocks match 200+ technical setups, each backed by historical win rate and expected value data. You get notified the moment an ORB break, VWAP reclaim, or breakout pattern forms, with plain-English explanations of why the setup triggered. This lets you forward test multiple strategies simultaneously without being glued to your screen. Learn more about setting up effective trading alerts with your charting platform.
How Modern Tools Simplify Backtesting Strategies for Traders
Traditional backtesting has a massive barrier to entry: coding knowledge. Platforms like TradingView require Pine Script. Python backtesting libraries require programming skills. Most traders don't have time to learn coding, they want to trade, not become software developers.
This is where modern platforms change the game by providing pre-built, pre-tested strategies with transparent performance data. Instead of spending months learning to code and gathering data, you get instant access to backtested results for proven technical setups.
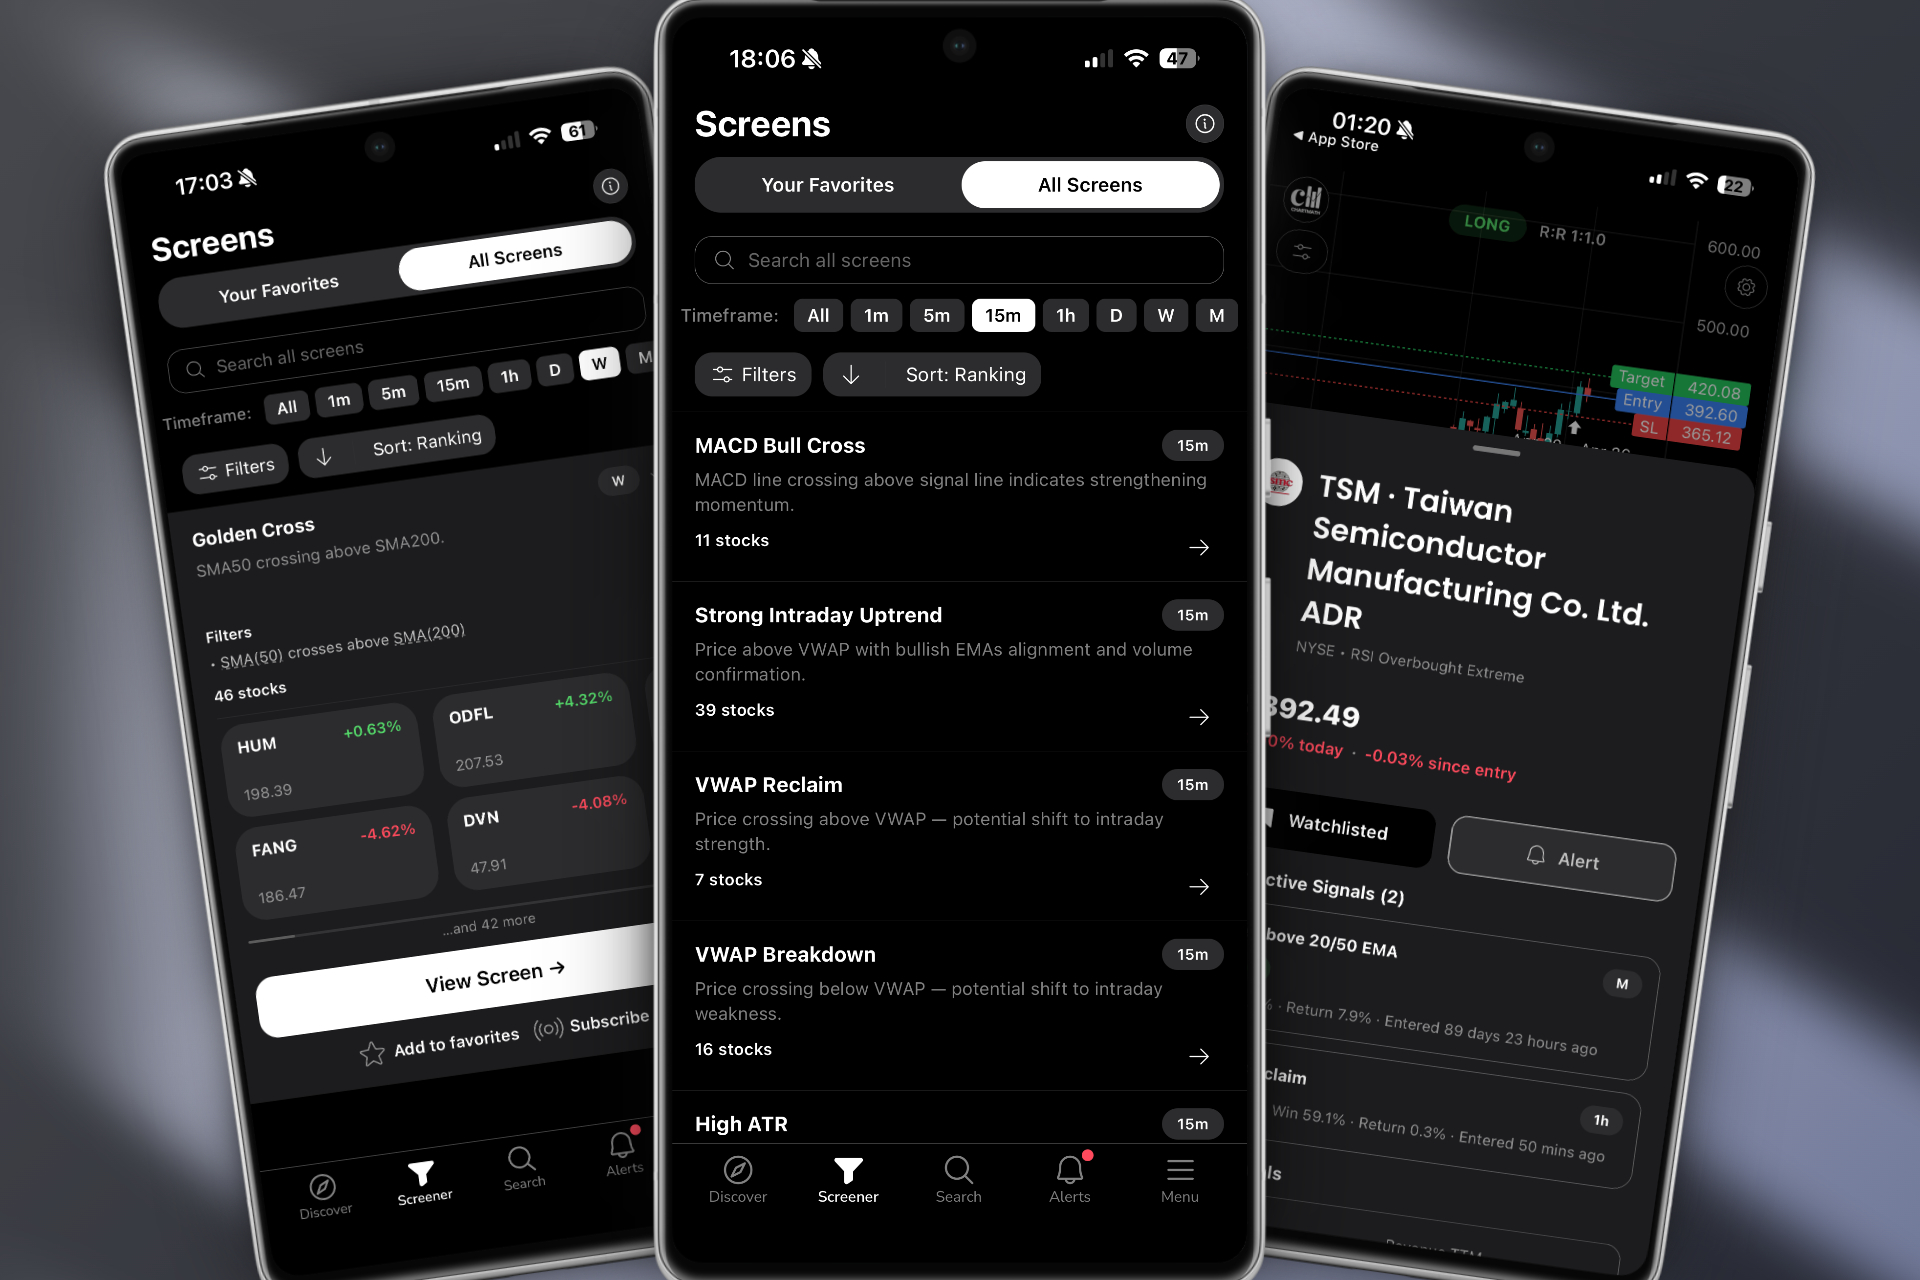
ChartMath takes a different approach: 200+ curated technical screens with backtested win rates and average returns built in. Every setup, from ORB breaks to VWAP reclaims to breakout patterns, comes with historical performance data showing exactly how that strategy performed across hundreds of past occurrences. You can see the win rate, expected value per trade, and maximum drawdown before you ever take a trade.
The mobile-first approach means you can discover backtested setups on the go. Instead of being chained to a desktop running complex backtesting software, you get a TikTok-style swipe interface that shows you the highest-quality setups forming right now, ranked by backtest performance and freshness. Each alert includes plain-English explanations of why the setup triggered and what the historical edge is.
Comparing manual backtesting versus automated platforms:
- Manual backtesting: Weeks of work, coding required, prone to errors, limited to setups you can program
- Automated platforms: Instant results, no coding needed, professionally tested, covers 200+ proven setups
The platform integrates with your existing charting tools. ChartMath isn't trying to replace TradingView or your broker's charts, it's a companion app that tells you which setups to look for and when they're forming. You get the alert, verify the setup on your preferred charting platform, and execute the trade with confidence knowing the backtest data supports your decision.
This approach democratizes backtesting strategies for traders who don't have programming skills or months to spend gathering data. You get the same edge that institutional traders have, data-driven decision making, without the technical barriers.
Common Mistakes to Avoid When Building Backtesting Strategies
Even experienced traders make critical errors when backtesting that invalidate their results. Avoid these common pitfalls:
Overfitting to historical data is the most dangerous mistake. When you optimize a strategy to avoid every historical loss, you create a system that worked perfectly in the past but has no predictive power for the future. The strategy is memorizing history instead of identifying genuine edges. Keep your rules simple and logical.
Using insufficient sample size leads to false conclusions. Testing a setup across 12 occurrences tells you nothing statistically significant. You need 30+ trades minimum, and 100+ trades for high confidence. If your backtest doesn't find enough examples, either expand your date range or loosen your filters.
Ignoring transaction costs and slippage inflates your results. Every trade has costs: commissions, SEC fees, and the spread between bid and ask. Slippage happens when you can't get filled at your exact target price. A strategy that makes $50 per trade before costs might only make $30 after costs. Factor in realistic transaction costs of $5-10 per round trip for active traders.
Cherry-picking favorable time periods is a form of self-deception. If you only backtest during the 2023-2024 bull market, your results will look amazing. Test across multiple years and market conditions to see how the strategy performs during corrections, bear markets, and choppy periods.
Not accounting for survivorship bias skews results upward. If you only test on stocks that still exist today, you're excluding all the companies that went bankrupt or got delisted. Those failed trades would have been losses in your backtest. Use data sets that include delisted stocks for accurate results.
Failing to test across different market conditions creates strategies that only work in specific environments. A momentum breakout strategy might crush during trending markets but bleed slowly during range-bound periods. Test your strategy across trending, choppy, high volatility, and low volatility periods to understand when it works and when to step aside.
Start Building Data-Driven Backtesting Strategies Today
You now have the complete 7-step framework for building winning backtesting strategies that improve your trading performance:
- Choose technical setups that match your trading style and timeframe
- Define specific, repeatable entry and exit rules
- Gather sufficient historical data across multiple market conditions
- Run backtests and track win rate, expected value, and drawdown metrics
- Analyze results to identify what's working and what needs refinement
- Optimize incrementally without overfitting to historical data
- Validate with forward testing and paper trading before risking capital
The competitive advantage of data-driven trading cannot be overstated. While other traders chase setups based on gut feeling or recent wins, you'll execute with confidence knowing the historical probabilities are in your favor. When a losing streak hits, you won't panic and abandon your strategy because you know the backtest data shows it's profitable over 100+ trades.
Backtesting builds confidence and removes emotion from trading decisions. Instead of wondering "will this work?" you know "this works 58% of the time with an average return of 2.4% per trade." That knowledge transforms your psychology and execution.
Your next step is simple: choose your first setup to backtest. Start with a proven pattern like ORB breaks, VWAP reclaims, or breakout trading opportunities. Define your rules, gather your data, and run the test. If you want to skip the months of manual work and coding, try ChartMath to access 200+ pre-built backtested strategies with real-time alerts delivered to your phone.
The platform scans the market continuously and notifies you the moment a high-probability setup forms, complete with the historical win rate and expected value that took months to calculate. You can watch a demo to see how backtested strategies translate into real-time trading opportunities, or download the app to start discovering data-driven setups today. For traders who prefer web-based tools, the web-based screener provides the same backtested data with a desktop-friendly interface.
Stop trading on hope and start trading on data. Your backtesting strategies are the foundation of consistent, profitable trading. Build them right, test them thoroughly, and execute them with discipline. The market rewards traders who do the work to understand what actually works, not what feels like it should work.

Ankush Jindal
LinkedInSee these setups live in ChartMath
200+ curated screens with backtest data. 14-day free trial.