Find the setup. Verify the edge.
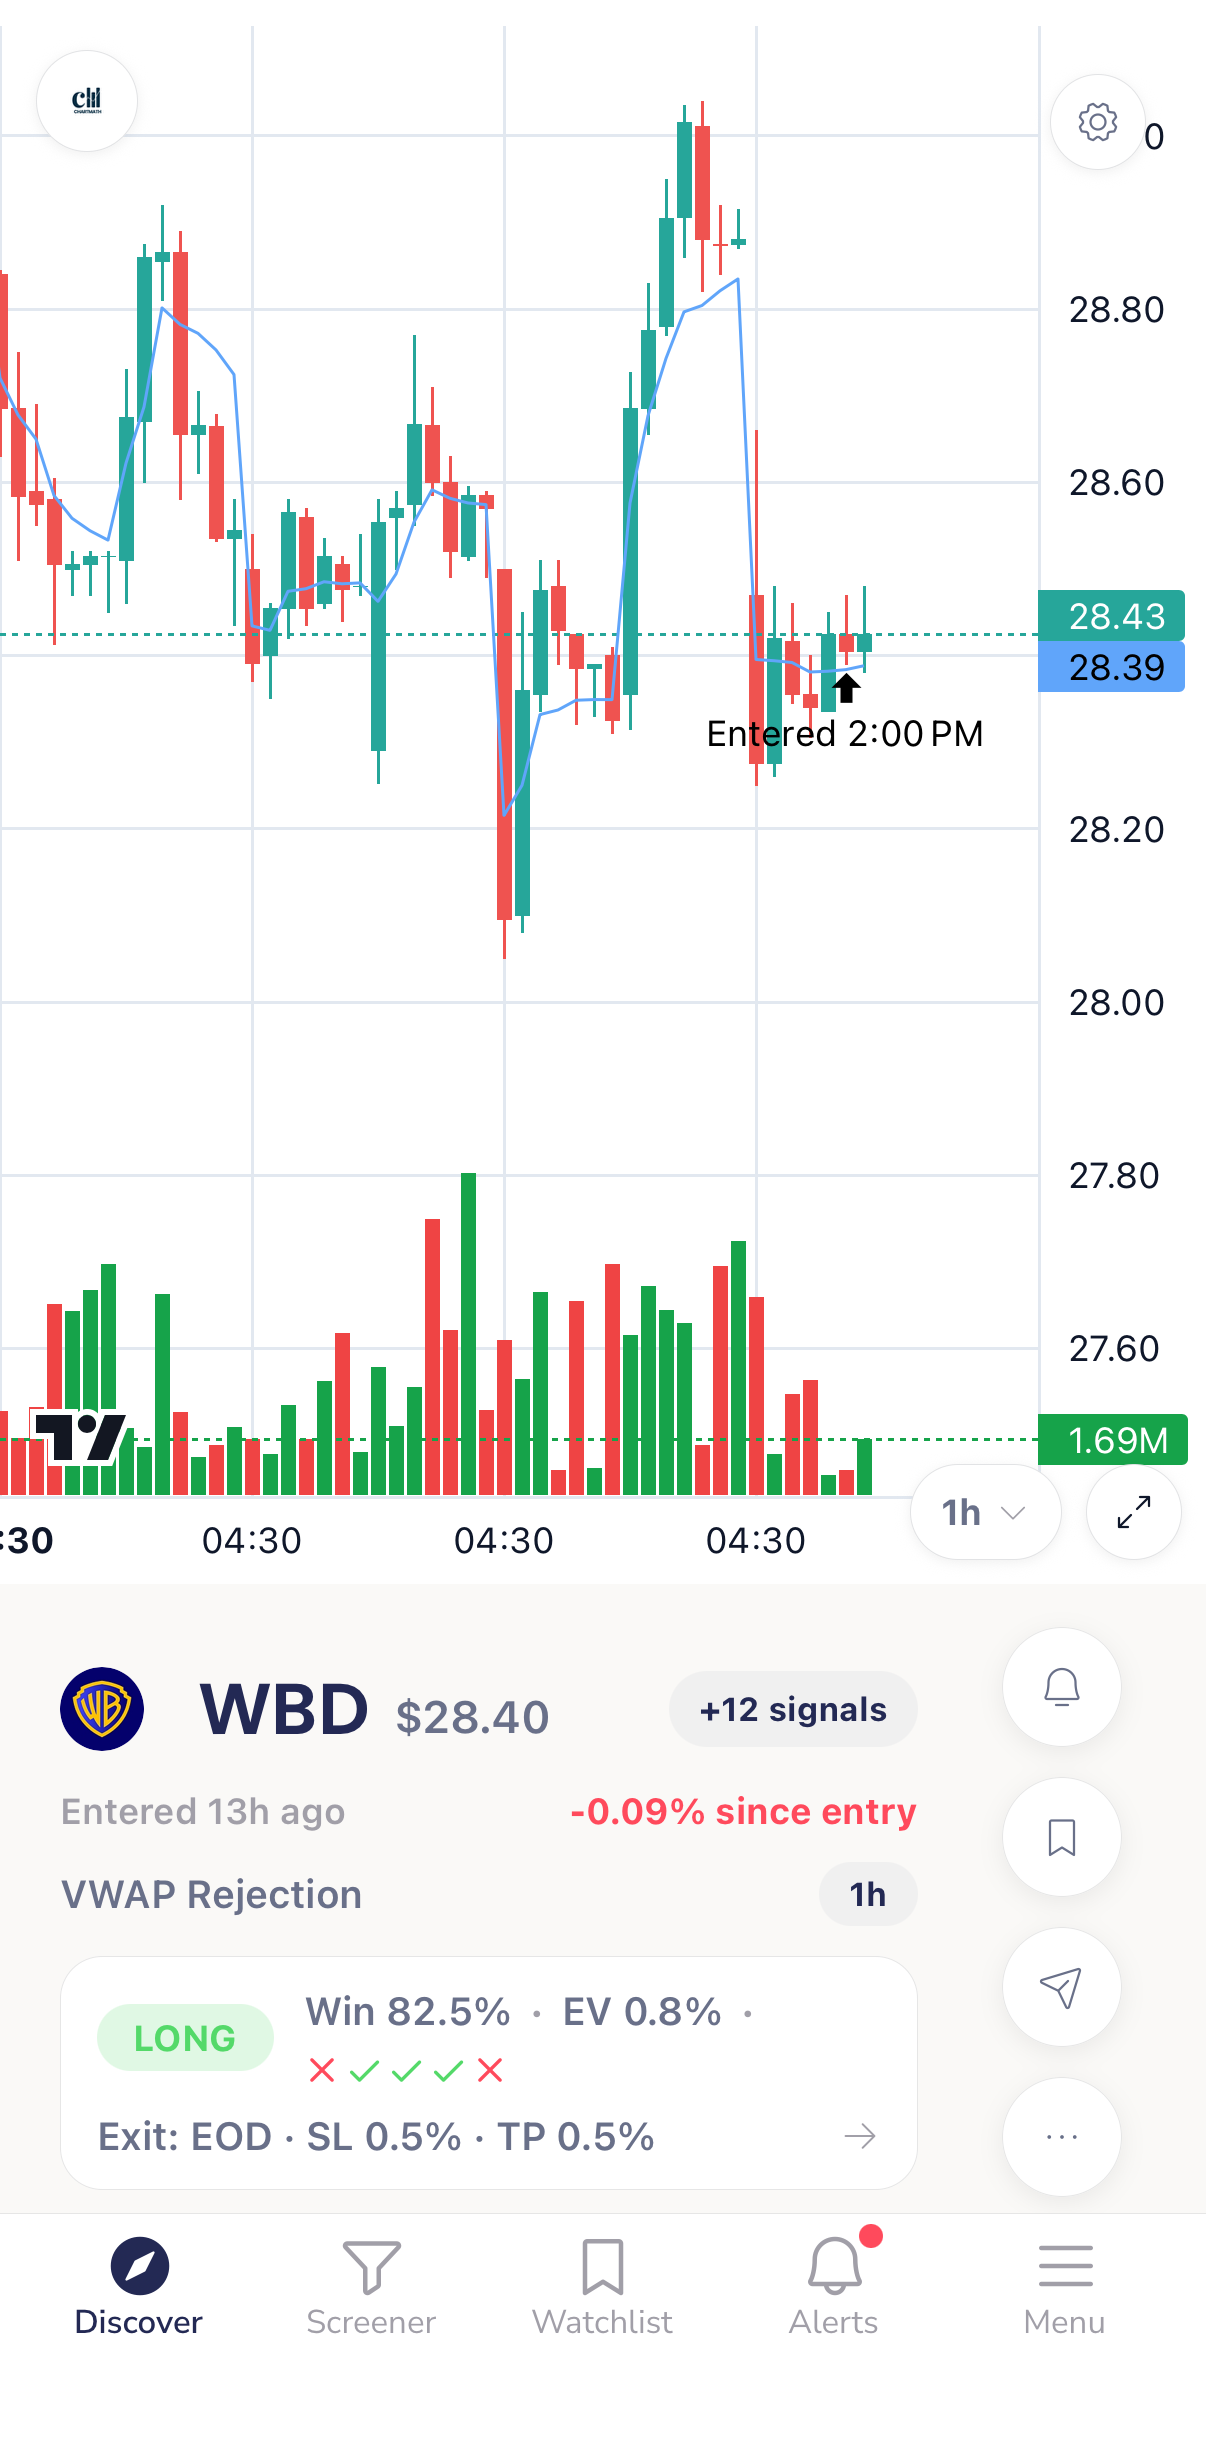
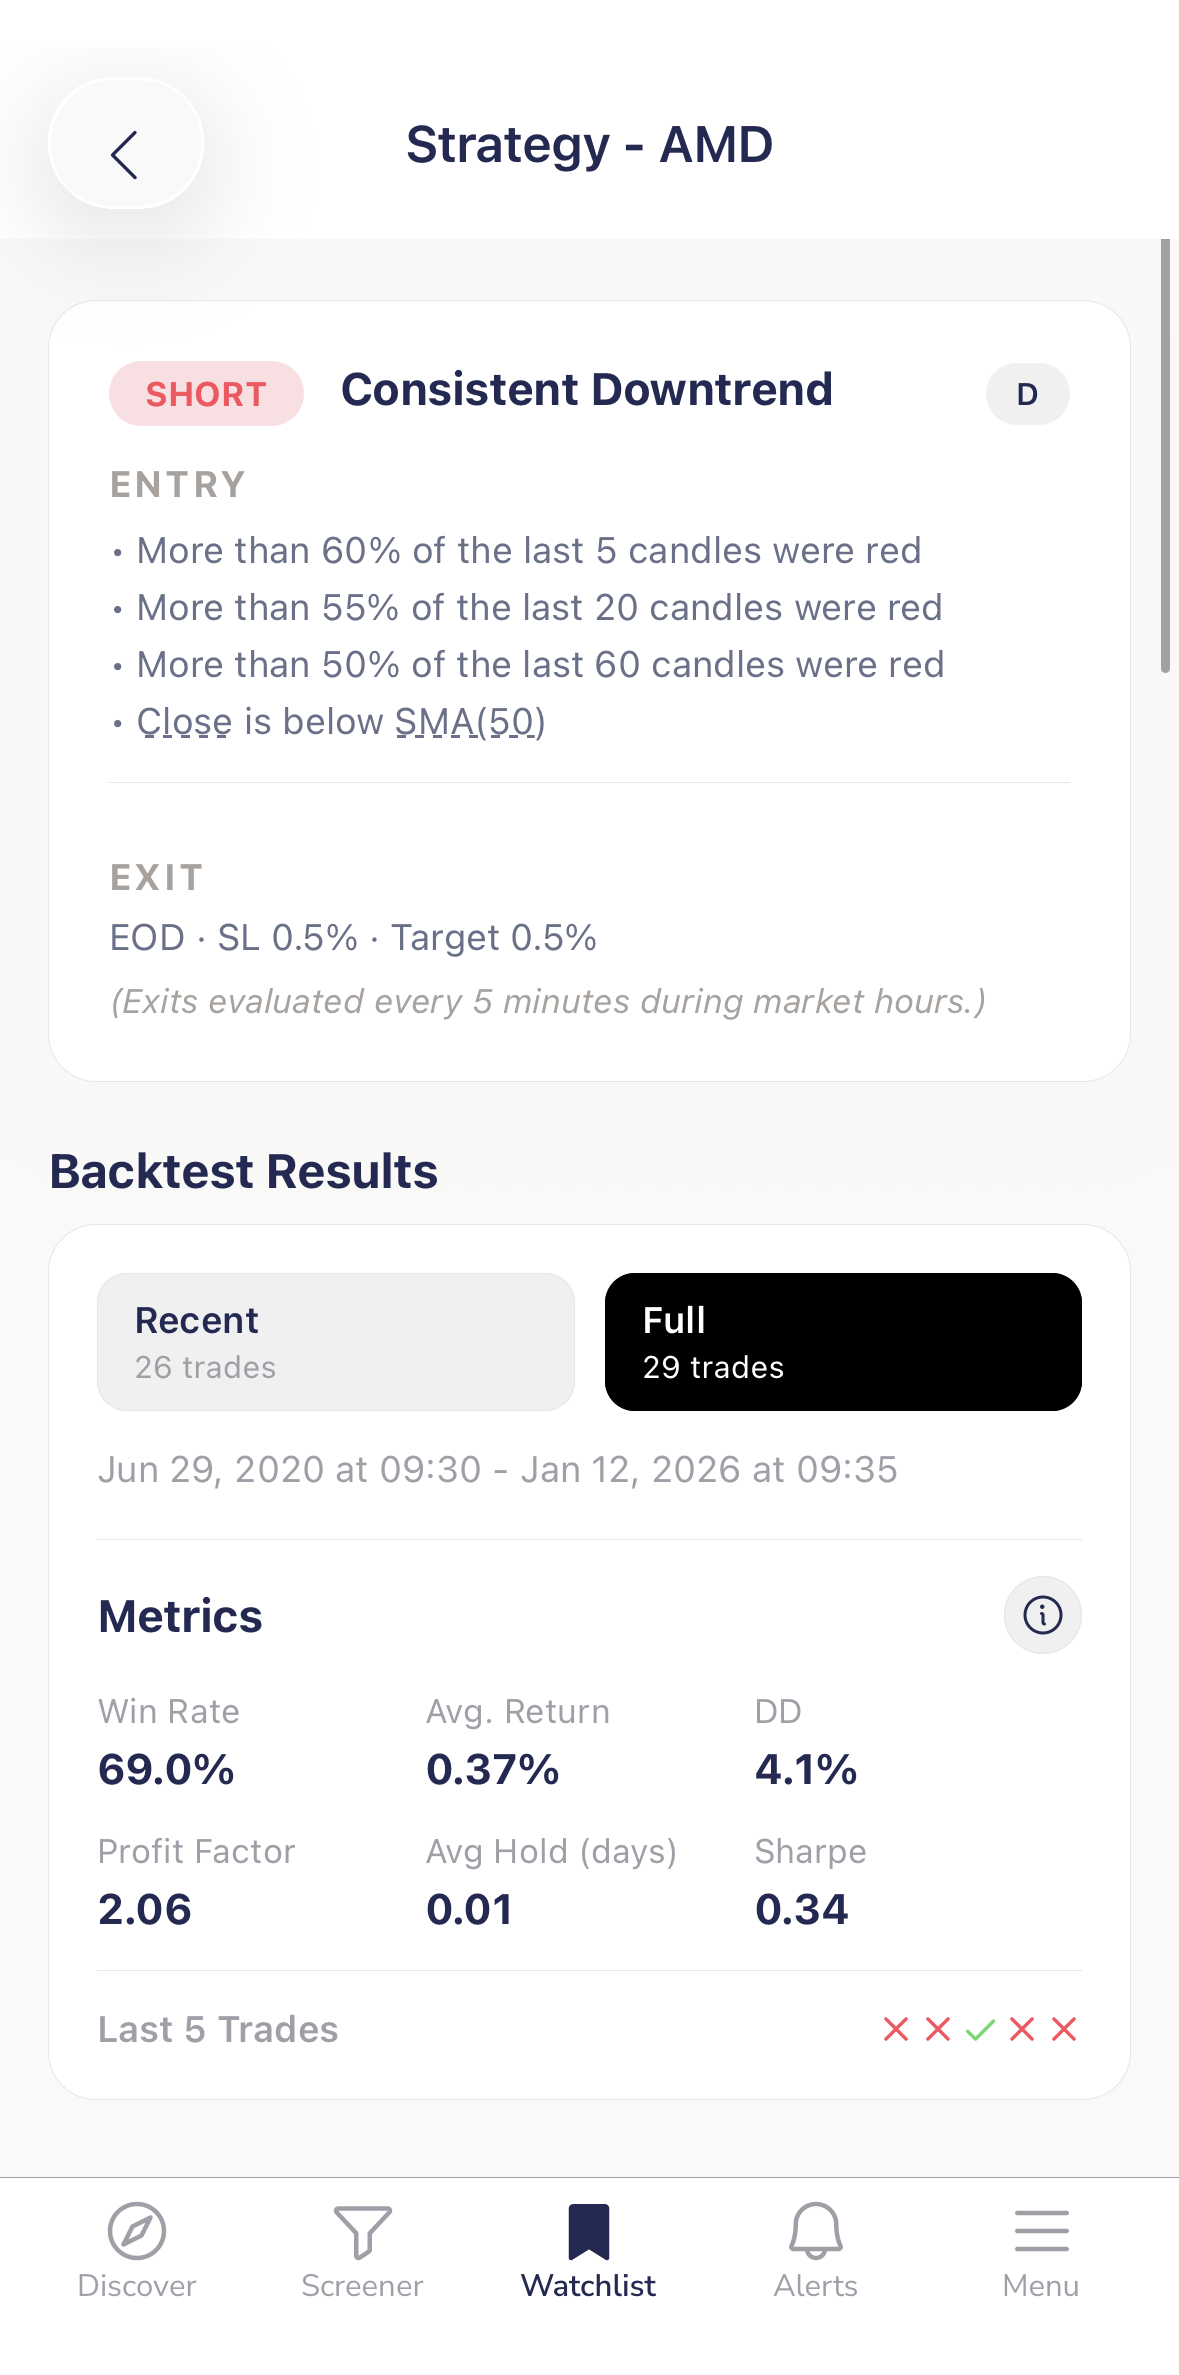
ChartMath scans the market, explains why a setup fired, and puts its historical results beside the chart.
See how we research ↗Find setups. Verify the evidence. Execute with a plan. Review what happened. Then close the app and get back to your day.
Free. No credit card required.Research does the heavy lifting. Execution carries the plan into the market. Feedback makes the next decision better.


ChartMath scans the market, explains why a setup fired, and puts its historical results beside the chart.
See how we research ↗
Define the entry, stop, target, and size before real capital is involved.
See paper trading ↗
Bring the result back to the evidence. Improve the system, not the story you tell yourself.
Then close the app.Trading above the 15-minute opening range high while above VWAP.
Daily range is smaller than the range of the previous 3 days (NR4).
RSI above 70 — overbought condition for potential fade/pullback.
Price above VWAP with bullish EMAs alignment and volume confirmation.
MACD line crossing above signal line indicates strengthening momentum.
Price trading within 5% of its 52-week high, positioning for a potential major breakout.
Volume at least 2x the 20-bar average — unusual activity.
Stock gapped up 1% or more at open — potential continuation or fade.
Scanning hell
Missed the entry
Alert noise
Why did this trigger?
Every name in our universe is scored against 200+ technical setups every minute. Type one, see what’s firing, the win rate, the chart.
The feed is only how the research reaches you. Every screen begins with a rule you can read and historical evidence you can inspect.
See how we research ↗ChartMath is built for traders who hold positions for days and trade around a 9 to 5.
Swing trader with a day job
You can't watch the screen from a meeting. ChartMath watches your watchlist during market hours and pings you the moment a name sets up, with the backtested win rate behind it. By the time you get a window, premarket, lunch, or after the close, the handful worth your attention is already shortlisted.
Day trader
If you're at the screen all day, ChartMath won't replace your process. It adds push alerts when 1m, 5m, or 15m setups fire, each one filtered to screens with a backtested track record.
Learner
Every signal comes with a plain-English explanation of which indicator fired and what it means.
Trading is not passive income. But it can be a disciplined process that fits around a day job. You do not need to be a trader already: learn how evidence, risk, and review work before you risk money.
Start Becoming Systematic ↗Why five trades are not enough to tell you whether a process works.
The entry, stop, expected return, and sample size behind a planned trade.
What a calm, repeatable week can look like before, during, and after the market.
01“I have been using ChartMath Discover function to backtest on a paper account to check the accuracy of the depicted stocks. I also checked the screeners, specifically the day trading ones for the 5m timeframe. I must admit I am positively surprised of the accuracy. Since I installed the app, I got more than $5K USD on my paper account.”
02“Definitely better than TradingView screeners off the bat. Very powerful filters. Will be recommending this.”
03“The backtest data is the main reason I'm here, that stuff is super cool.”
04“I've been using the VWAP alerts. Chef Kiss.”
05“I haven't gotten up from the toilet yet been sitting here checking out the app.”
Every screen, every backtest, every alert. No feature gates. Get the app, sign in, and start scanning.
An account is all we ask for. Nothing is locked behind a checkout.Curated technical screens across every timeframe.
Win rate and avg return on every match. See what worked.
Push when a stock enters a screen. No noise, no spam.
Free. No credit card required. Get the app and start scanning the market with evidence on your side.