01Research example
Breakouts
Research into price moving beyond an established range.
You have a day job, so let the screens do the watching. Major NSE stocks run through the same backtested research process, so every setup arrives with evidence behind it. When you choose to act, Dhan carries the ticket with the stop, target, and position size decided before entry.
Open the app, switch your region to India from the menu, and the NSE screens are there.
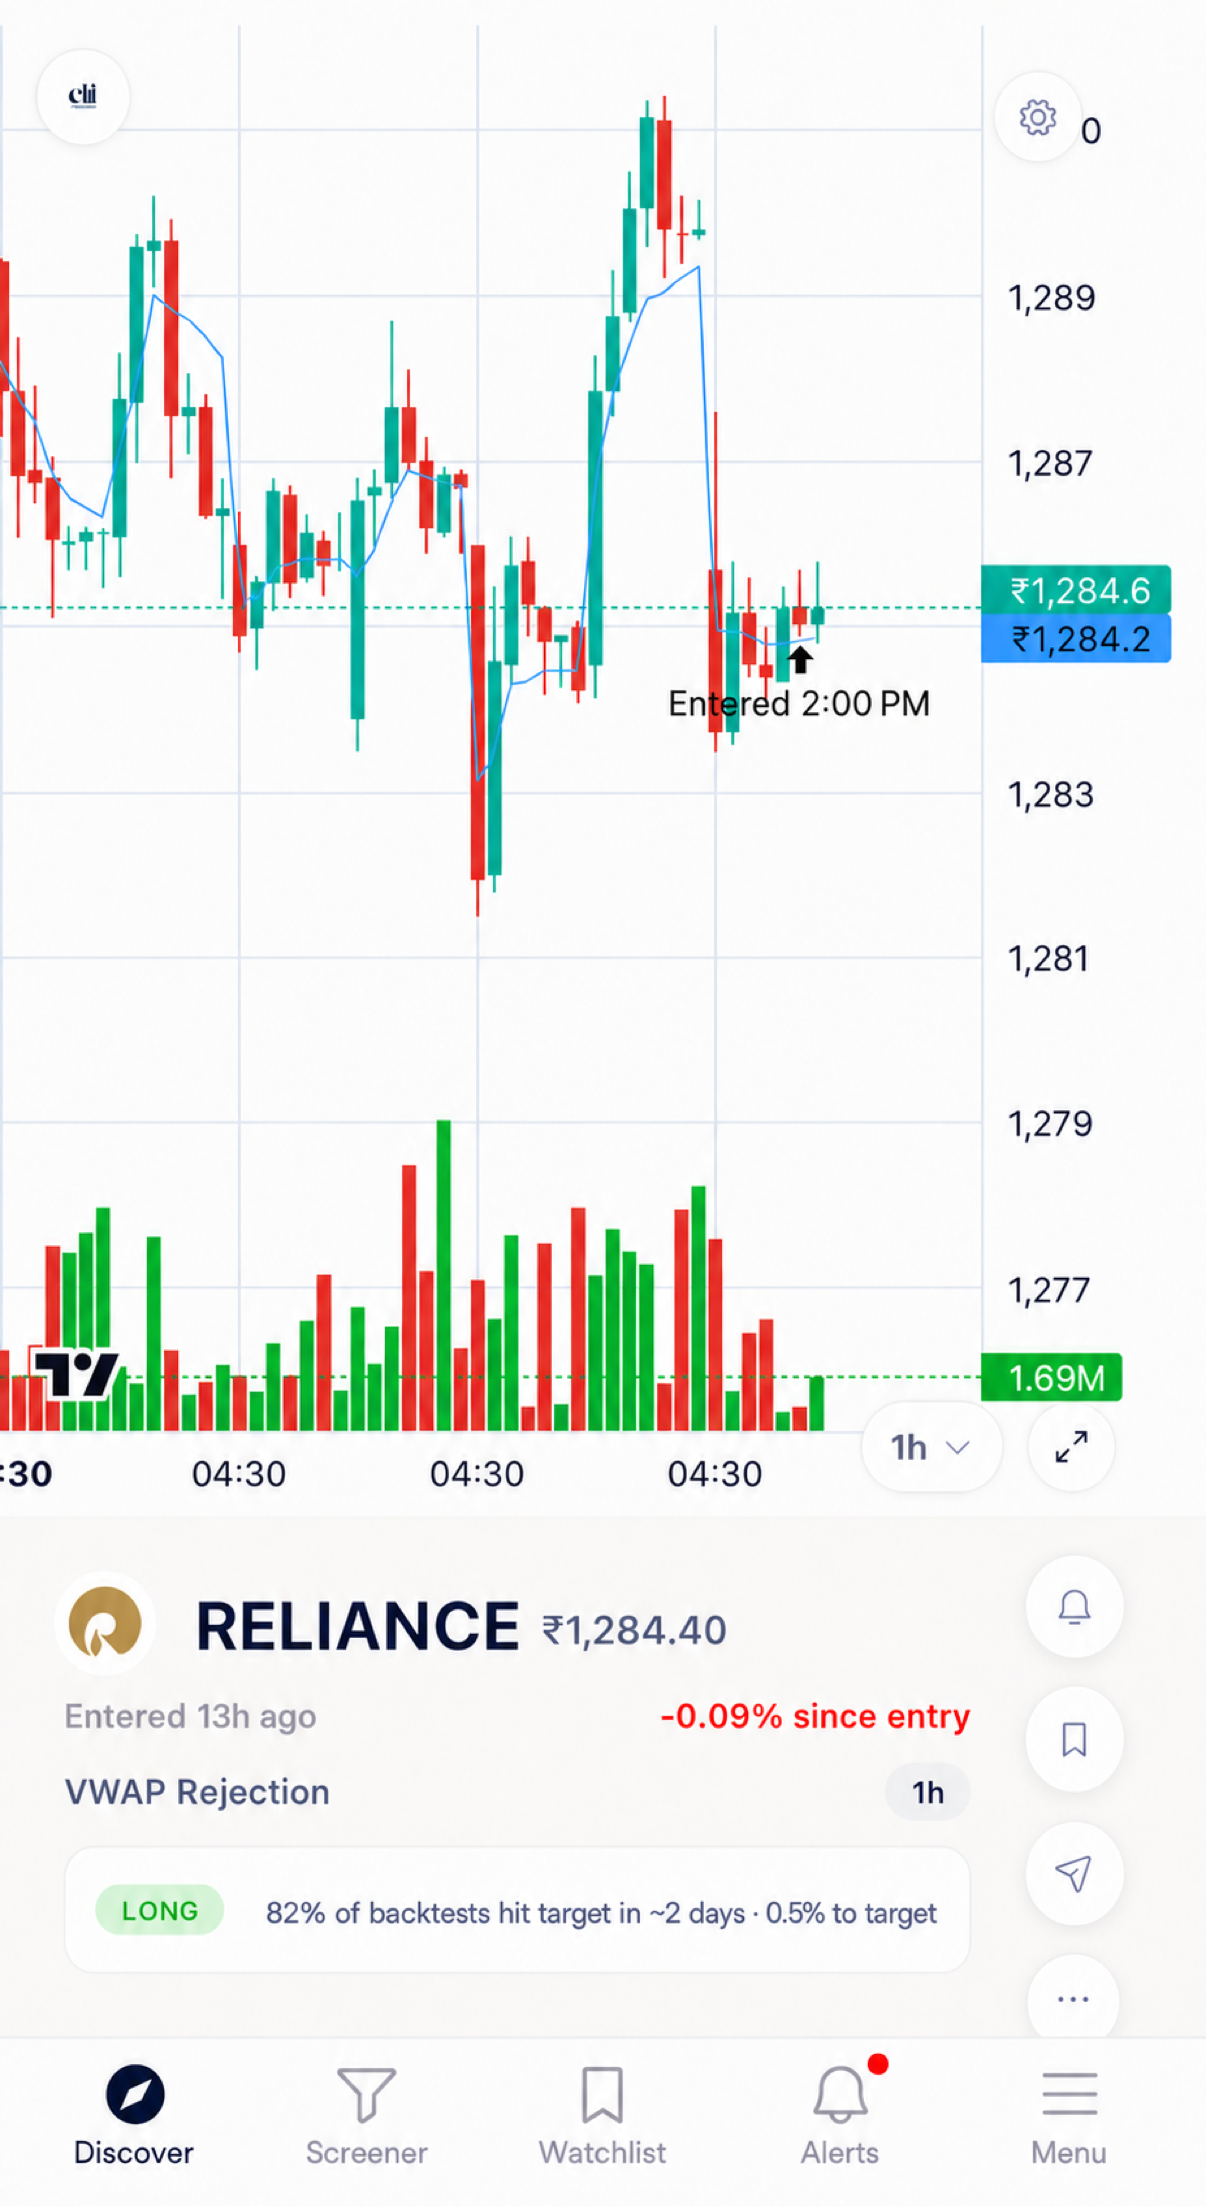
Here is the whole intervention. A setup surfaces with its win rate and its sample size. You open the ticket: entry, stop and target are already there, sized from your capital. You swipe. Dhan works the order and your phone buzzes when it fills. Your money never leaves your broker account. Then the app has nothing more to ask of you today.
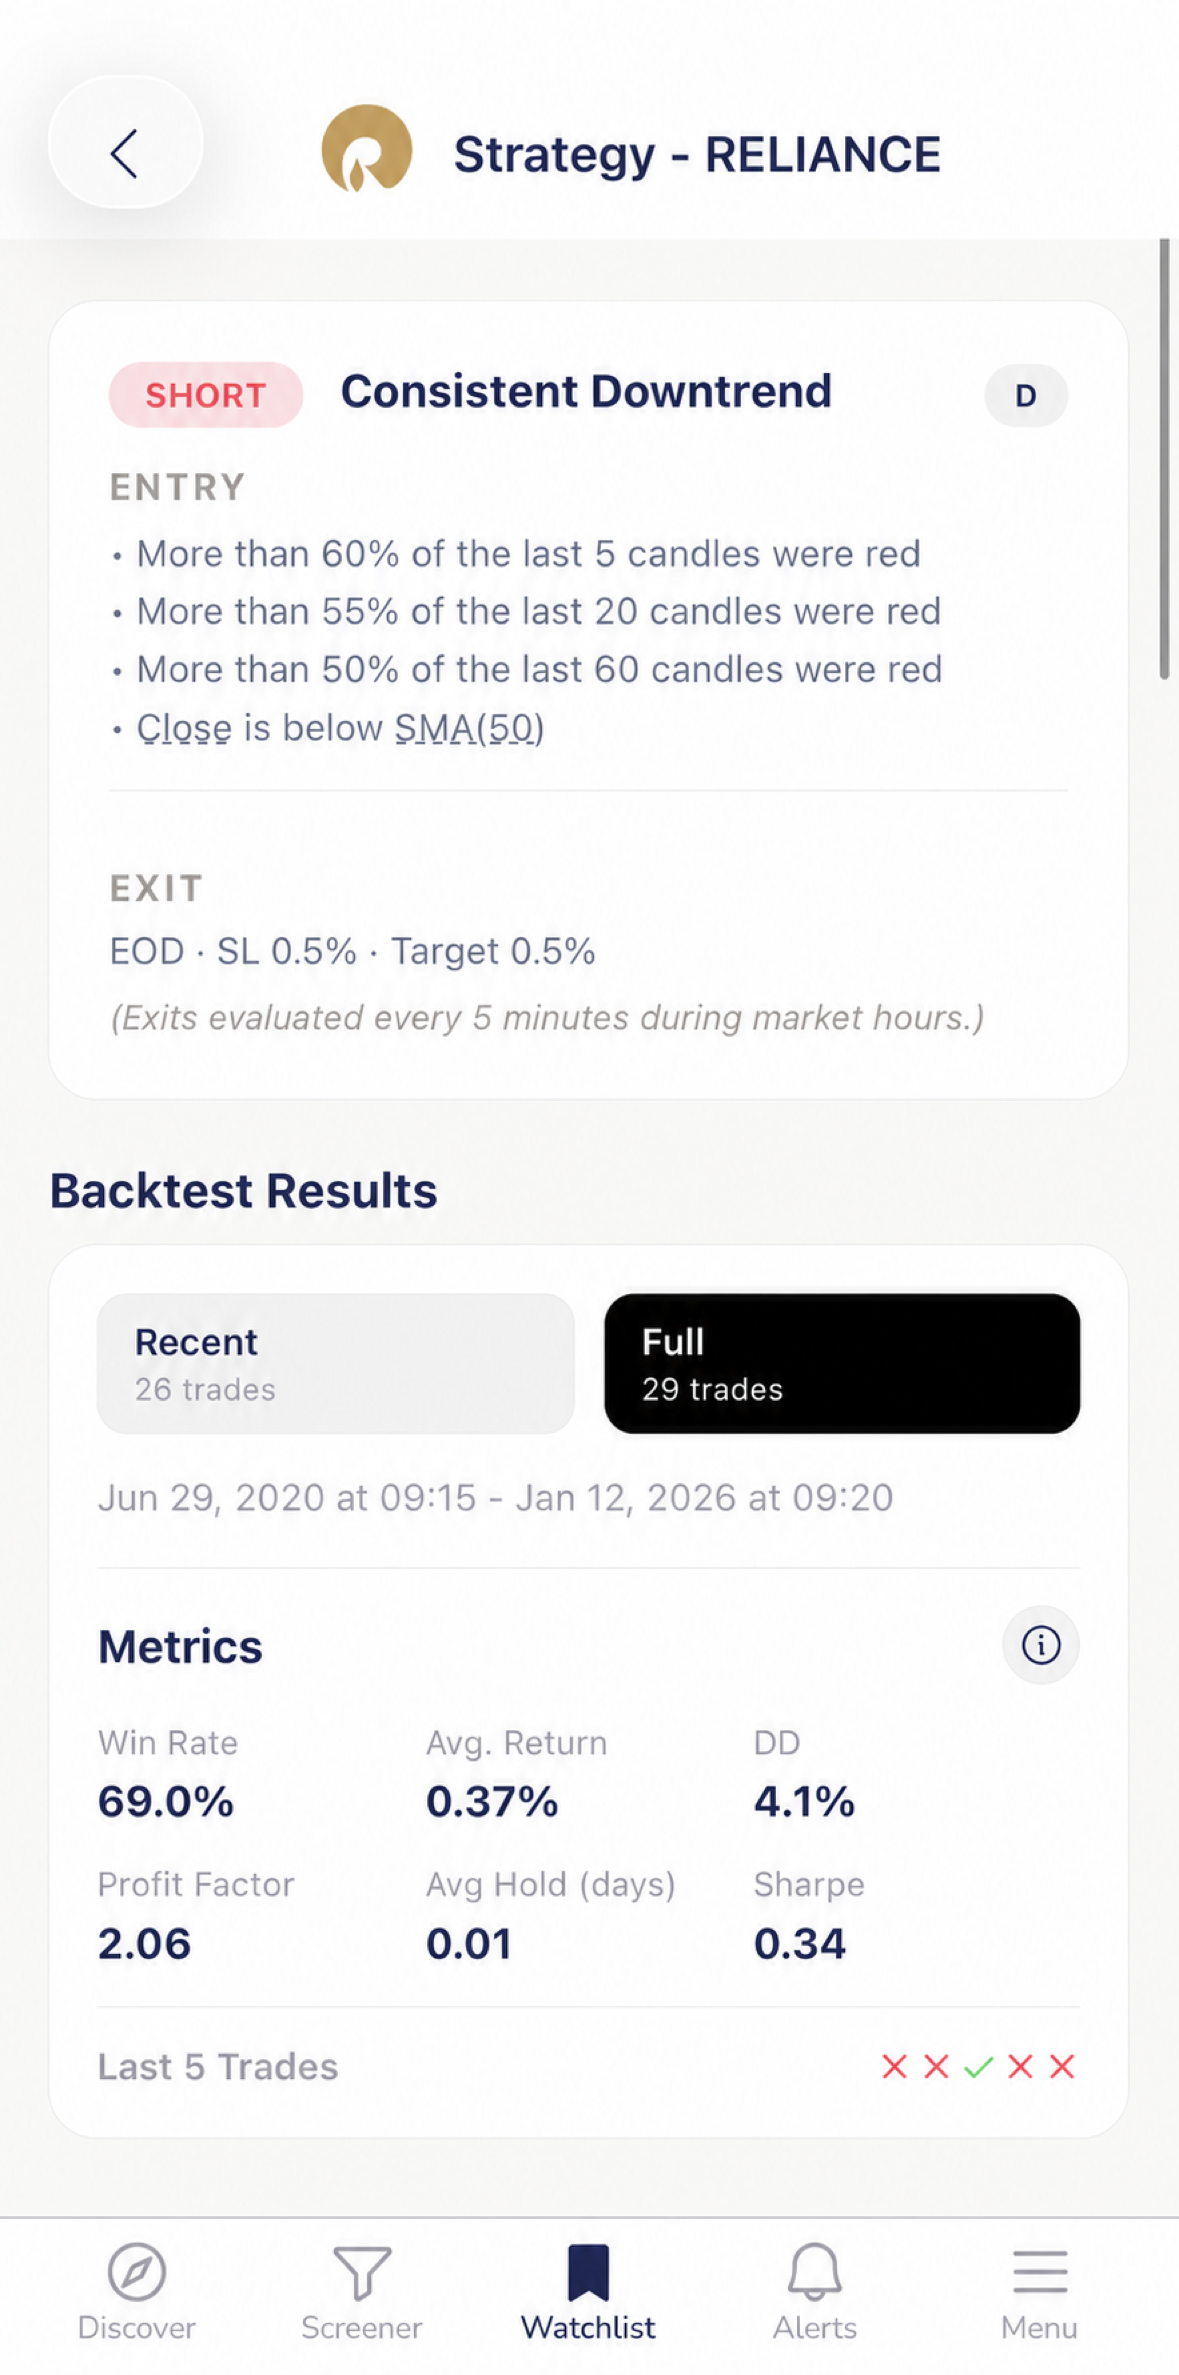
Most tools hand you a signal and ask you to trust it. ChartMath does the opposite. Every screen runs against years of price history first, and the result travels with the setup: the win rate, the sample size, and the plain-English reason it fired. You decide with the evidence in front of you.
Curated technical screens, each tested on years of historical data before it goes live.
Every match shows how the same setup performed in the past, with the number of trades behind it.
Get notified the moment a screen matches, so you can look while the setup is still fresh.
Every live screen carries its readable rule and historical evidence, so you can inspect the setup before you act.
How we test every screen374 NSE equities today, with the same backtest behind every screen. US markets and 100 crypto pairs are in the same app.
Every screen, every backtest, every alert is included.
Research into price moving beyond an established range.
Research into trends and the strength behind them.
Research into pauses within a broader trend.
Research into changes in trading activity.
Learn how to evaluate research and understand risk before acting on a setup.
Prateek posts the setups he takes, with the backtested win rate, stop and target on every one.
Free. No credit card required. Every screen, every backtest, every alert is included.