Volume Analysis for Day Traders: How to Use RVOL and Volume Spikes
You've spotted the perfect chart pattern. The stock is coiling at resistance, ready to break out. You enter the trade with confidence, only to watch it reverse minutes later, leaving you with a loss and a bruised ego. Sound familiar?
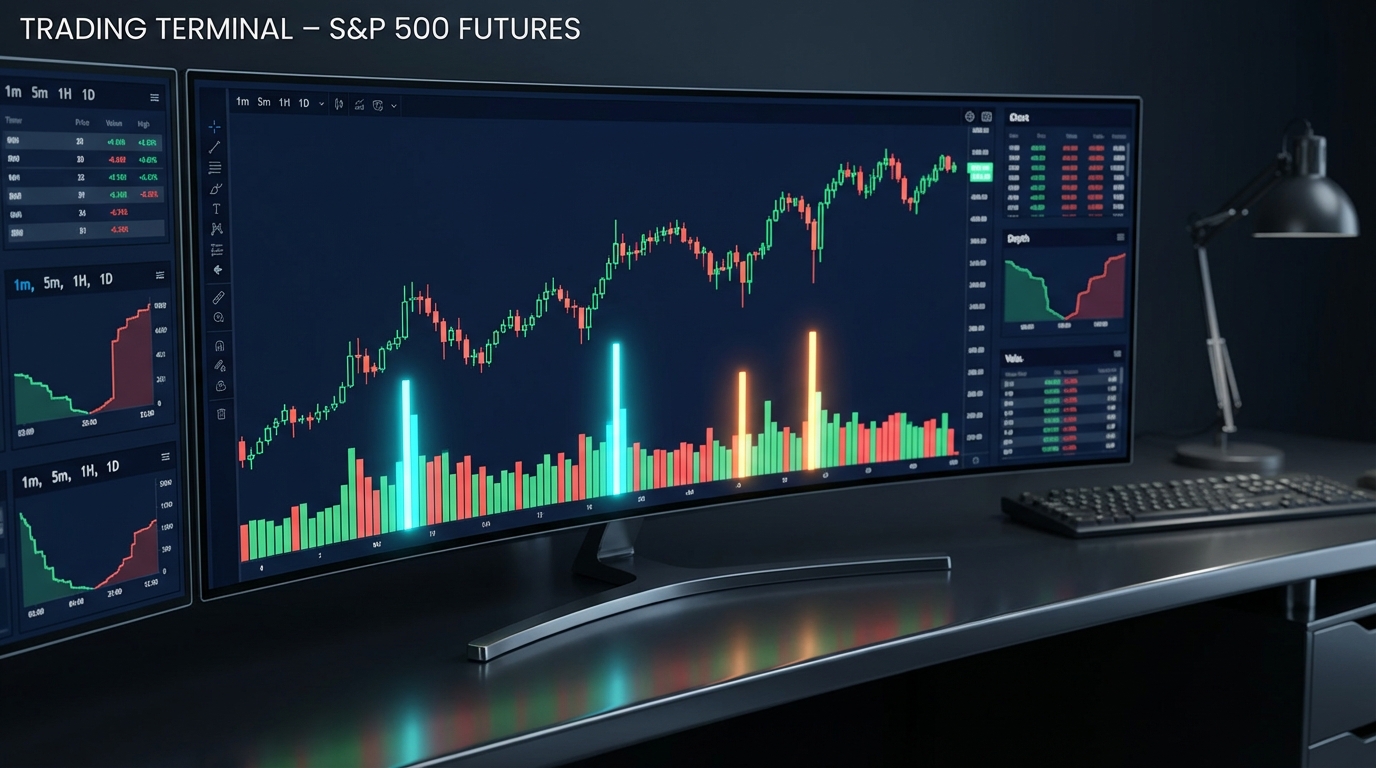
Here's what most traders miss: price tells you what's happening, but volume tells you why it matters. Without volume analysis, you're trading blind—reacting to price movements without understanding the institutional force behind them. In 2026, successful day traders don't just watch candlesticks; they decode volume signals like RVOL (Relative Volume) and volume spikes to separate high-probability setups from traps.
This comprehensive guide will teach you how to use volume analysis to predict price moves before they happen. You'll learn how to interpret RVOL readings, identify meaningful volume spikes, and combine these signals with price action to confirm breakouts and spot institutional activity. Whether you're scalping 1-minute charts or holding intraday momentum plays, mastering volume analysis will transform how you identify and execute trades.
What Is Volume Analysis and Why It Matters for Day Traders
Volume analysis is the study of trading activity—the number of shares exchanged during a specific period—to gauge the strength and conviction behind price movements. Think of volume as the fuel that powers price action. A stock can move up or down on the chart, but without sufficient volume, that movement lacks the institutional backing needed to sustain momentum.
When you analyze volume alongside price, you gain critical insights that price action alone cannot provide. A breakout above resistance on heavy volume signals strong buying interest and institutional participation. The same breakout on light volume? That's likely a fakeout waiting to reverse. Volume is the truth serum of the market, it reveals whether smart money is actually participating or if retail traders are chasing shadows.
Institutional traders, hedge funds, market makers, and large asset managers, move significant capital that creates detectable volume footprints. When a stock suddenly trades 3x its average volume in the first hour, that's not retail traders clicking buy buttons. That's institutional accumulation or distribution. By learning to read these volume signals, you position yourself alongside the smart money instead of being their exit liquidity.
The most common mistake traders make is ignoring volume data entirely. They focus exclusively on chart patterns and price levels, then wonder why their breakout trades fail 60% of the time. Price patterns without volume confirmation are like weather forecasts without satellite data, educated guesses at best. Volume analysis transforms those guesses into data-driven decisions backed by measurable market participation.
Understanding RVOL (Relative Volume): The Foundation of Volume Analysis
Raw volume numbers are meaningless without context. A stock trading 5 million shares might sound impressive, but what if it normally trades 50 million? That's actually unusually quiet. This is where RVOL (Relative Volume) becomes essential for day traders.
RVOL measures current trading volume relative to the average volume for the same time period over previous days. It's calculated by dividing current volume by the average volume at that specific time. An RVOL of 2.0 means the stock is trading at twice its normal volume for that time of day. An RVOL of 0.5 indicates half the usual activity.
Why does this matter? Because volume patterns change throughout the trading day. The first 30 minutes typically see the highest volume as overnight news gets priced in and institutional orders execute. Volume then tapers during mid-day before potentially picking up again into the close. RVOL normalizes these patterns, allowing you to identify when something unusual is happening regardless of the time.
Here are the RVOL thresholds that matter for day traders:
- RVOL 1.5x to 2.0x: Elevated interest worth monitoring. The stock is seeing above-average participation, which could signal the early stages of a move.
- RVOL 2.0x to 3.0x: Significant volume spike indicating strong institutional interest. These stocks should be on your watchlist for potential setups.
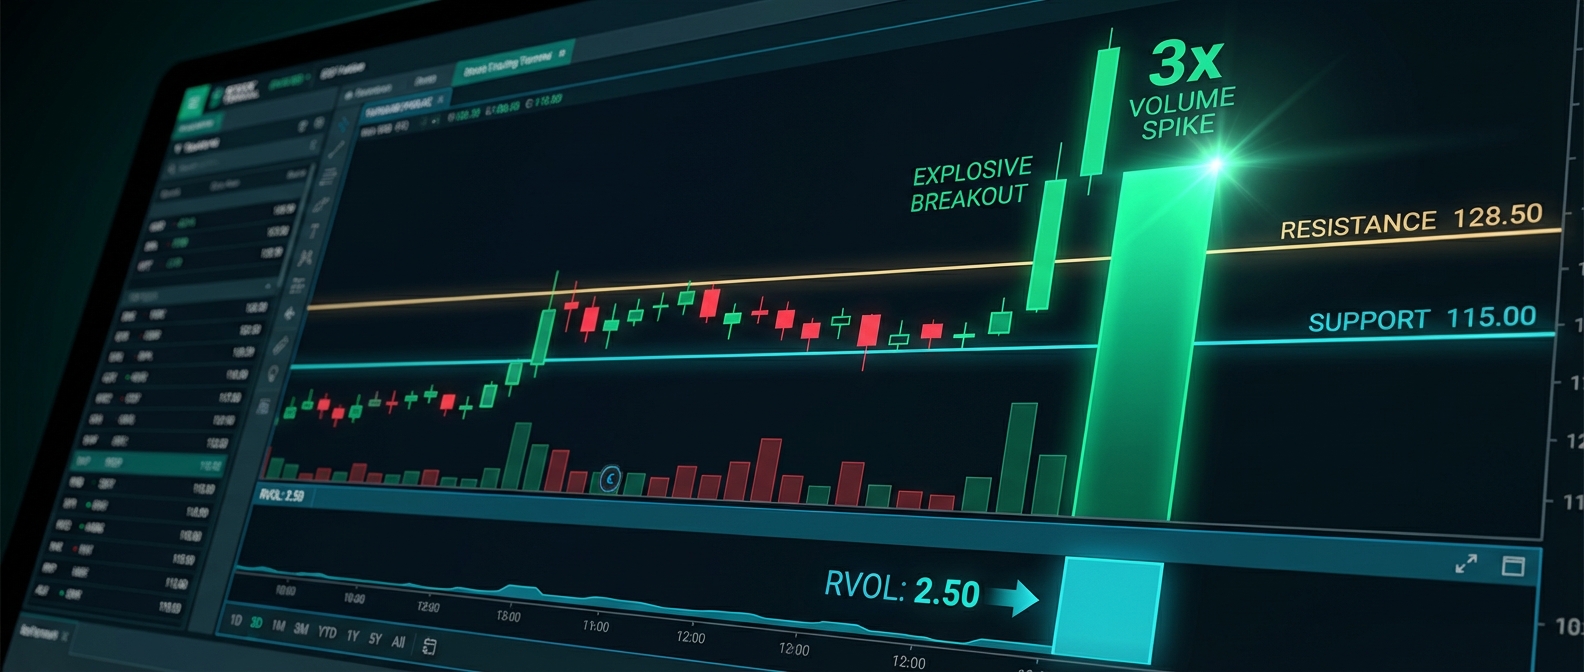
- RVOL 3.0x+: Extreme volume suggesting major news, earnings, or institutional accumulation/distribution. These are your highest-probability candidates for momentum plays.
Interpreting RVOL requires understanding the time-of-day context. An RVOL of 2.5x at 9:45 AM is less remarkable than the same reading at 2:00 PM. Morning volume naturally runs higher, so elevated RVOL during market open needs to be even more extreme to signal something truly unusual. Conversely, an RVOL spike in the afternoon when volume typically dries up is a powerful signal that smart money is actively positioning.
Real-world example: You're scanning for momentum trading opportunities at 10:30 AM. Stock A shows 8 million shares traded with RVOL of 1.2x. Stock B shows 2 million shares with RVOL of 3.5x. Which deserves your attention? Stock B. Despite lower absolute volume, it's trading at 3.5 times its normal pace for this time of day, indicating something significant is happening. Stock A is just experiencing typical morning activity.
How to Identify and Trade Volume Spikes
A volume spike is a sudden, dramatic increase in trading activity compared to recent bars. While RVOL gives you the big-picture context, volume spikes show you the exact moment when institutional interest intensifies. These spikes often precede or confirm significant price movements, making them invaluable for timing entries and exits.
Not all volume spikes are created equal. A meaningful volume spike should be at least 2-3 times the average volume of recent bars on your timeframe. On a 5-minute chart, compare the current bar's volume to the average of the previous 20 bars. A spike that's only 20-30% above average is just noise. You're looking for bars that visually jump off the chart, the ones that make you say "something just happened."
The location of the volume spike matters as much as its size. Volume spikes at key technical levels carry the most significance:
- At support levels: Heavy volume on a bounce suggests strong buying interest and potential reversal
- At resistance levels: Volume spikes during a breakout confirm institutional participation and reduce fakeout risk
- During consolidation: Sudden volume without price movement often indicates accumulation before a directional move
- On trend continuation: Volume spikes in the direction of the trend validate momentum and suggest the move has legs
Here's the critical distinction between breakouts and fakeouts: real breakouts are accompanied by volume spikes; fakeouts happen on declining volume. When a stock breaks above resistance on volume that's 3x the recent average, institutions are buying aggressively. When it breaks on volume that's below average, retail traders are chasing while smart money is selling into the excitement.
To trade volume spikes effectively, you need price action confirmation. A volume spike alone isn't a trade signal, it's an alert that something is happening. Wait for the price to confirm the direction. If you see a volume spike at resistance, wait for the candle to close above that level before entering. If volume spikes but price immediately reverses, that's distribution, institutions selling into demand.
Setting up alerts for volume spike detection is essential because you can't watch every stock simultaneously. Modern stock screeners can monitor thousands of stocks and notify you the moment volume exceeds your threshold. This allows you to focus on execution rather than manual scanning, ensuring you never miss high-probability setups while you're analyzing other positions.
Step-by-Step: Combining Volume Analysis with Price Action
Volume analysis becomes powerful when integrated with price action in a systematic workflow. Here's the exact process professional day traders use to identify and execute high-probability setups using volume signals:
1. Identify Stocks with Elevated RVOL
Start your trading day by scanning for stocks with RVOL above 2.0x. This filters the market down to securities experiencing unusual institutional interest. Don't waste time analyzing stocks with normal volume, focus your attention where the action is happening. Your trading workflow should begin with this volume filter before you even look at charts.
Use a premarket scanner to identify stocks with elevated RVOL before the opening bell. These are your candidates for opening range breakout plays and early momentum trades. Then continue monitoring for RVOL spikes throughout the session to catch mid-day setups that develop as news breaks or technical levels are tested.
2. Look for Volume Spikes at Key Technical Levels
Once you've identified high-RVOL candidates, drill down to the chart and identify key technical levels: previous day's high/low, premarket high/low, major support and resistance zones, and round numbers. Watch for volume spikes as price approaches these levels. A volume spike at a key level signals that institutions are making decisions, either defending the level or breaking through it.
Pay special attention to volume behavior during the first test of a level versus subsequent tests. The first test on heavy volume often fails as early buyers get trapped. The second or third test on increasing volume frequently succeeds as institutions accumulate positions at favorable prices.
3. Confirm with Price Action Patterns
Volume tells you institutions are active, but price action tells you their intent. After identifying a volume spike, look for confirming price patterns. Is the candle closing near its high (bullish) or low (bearish)? Are you seeing a technical setup like a bull flag, ascending triangle, or VWAP reclaim forming on the volume spike?
The strongest setups combine volume spikes with clear price structure. For example: a stock consolidates in a tight range for 20 minutes, then breaks out on a volume spike that's 4x the recent average while forming a 5-minute bull flag. That's institutional accumulation with a defined risk level, a high-probability long setup.
4. Set Entry and Exit Criteria
Define your entry trigger based on both volume and price confirmation. A common approach: enter when price breaks above the high of the volume spike candle, confirming that the buying pressure is continuing. Your stop loss goes below the low of the consolidation or volume spike candle, giving you a defined risk level.
For exits, monitor volume throughout the trade. Declining volume as price extends suggests the move is losing steam, consider scaling out or tightening stops. A volume spike in the opposite direction (heavy selling volume on a long position) is your signal to exit immediately, as the character of the trade has changed.
5. Monitor Volume Throughout the Trade
Volume analysis doesn't stop at entry. Successful intraday trading requires continuous volume monitoring to manage positions effectively. Healthy trends show consistent volume in the direction of the move. When you're long and see increasing volume on green candles but decreasing volume on red candles, the trend is intact.
Warning signs include: volume drying up as price extends (exhaustion), volume spikes on counter-trend moves (reversal), or price making new highs/lows on declining volume (divergence). These volume clues often signal trend changes before price action makes it obvious, giving you an edge in timing exits.
Volume Analysis Across Different Trading Timeframes
Volume behavior and interpretation change significantly across timeframes. What constitutes a meaningful volume spike on a 1-minute chart differs from a daily chart, and your volume analysis approach must adapt accordingly.
1-Minute and 5-Minute Volume Analysis for Scalpers: On these ultra-short timeframes, you're looking for sudden volume bursts that indicate immediate institutional interest. A volume spike on a 1-minute chart might represent a large market order or algorithmic execution. These spikes are often short-lived, so scalpers must act quickly. Look for volume spikes that are 3-5x the recent average, and expect the resulting price move to last only a few minutes. The key is catching the initial momentum before it dissipates.
15-Minute Volume Patterns for Intraday Momentum Plays: The 15-minute timeframe smooths out the noise of shorter intervals while still capturing intraday momentum. Volume analysis on 15-minute charts is ideal for identifying sustained institutional interest rather than one-off orders. Look for consecutive 15-minute bars with above-average volume in the same direction, this indicates accumulation or distribution rather than random volatility. These setups typically offer better risk/reward than 1-minute scalps because the moves have more room to develop.
Daily Volume Analysis for Swing Traders: On daily charts, volume analysis focuses on multi-day patterns and trends. A volume spike on a daily chart represents a full day of unusual activity, a much more significant signal than an intraday spike. Swing traders use daily volume to identify breakout trading opportunities that could run for days or weeks. Look for volume on breakout days to be at least 50% above the 20-day average volume, ideally 2x or higher for the strongest setups.
Volume behavior differs across timeframes in predictable ways. Intraday timeframes show more volatility in volume, spikes and lulls throughout the session based on news, order flow, and time of day. Daily timeframes smooth these variations into a single data point, making patterns easier to identify but reducing granularity. Understanding these differences prevents you from applying 1-minute volume logic to daily charts or vice versa.
Multi-timeframe volume confirmation is a powerful technique where you verify volume signals across multiple timeframes before entering a trade. For example: you spot a volume spike on a 5-minute chart as a stock breaks resistance. Before entering, check the 15-minute and hourly charts. Is volume elevated on those timeframes too? If yes, you have multi-timeframe confirmation that institutional interest is sustained, not just a brief spike. This dramatically improves your win rate by filtering out false signals.
Advanced Volume Analysis Techniques for 2026
Beyond basic RVOL and volume spikes, advanced traders use sophisticated volume analysis techniques to gain deeper insights into institutional behavior and market structure. These methods separate professional traders from amateurs in 2026's competitive markets.
Volume-Weighted Average Price (VWAP) Integration
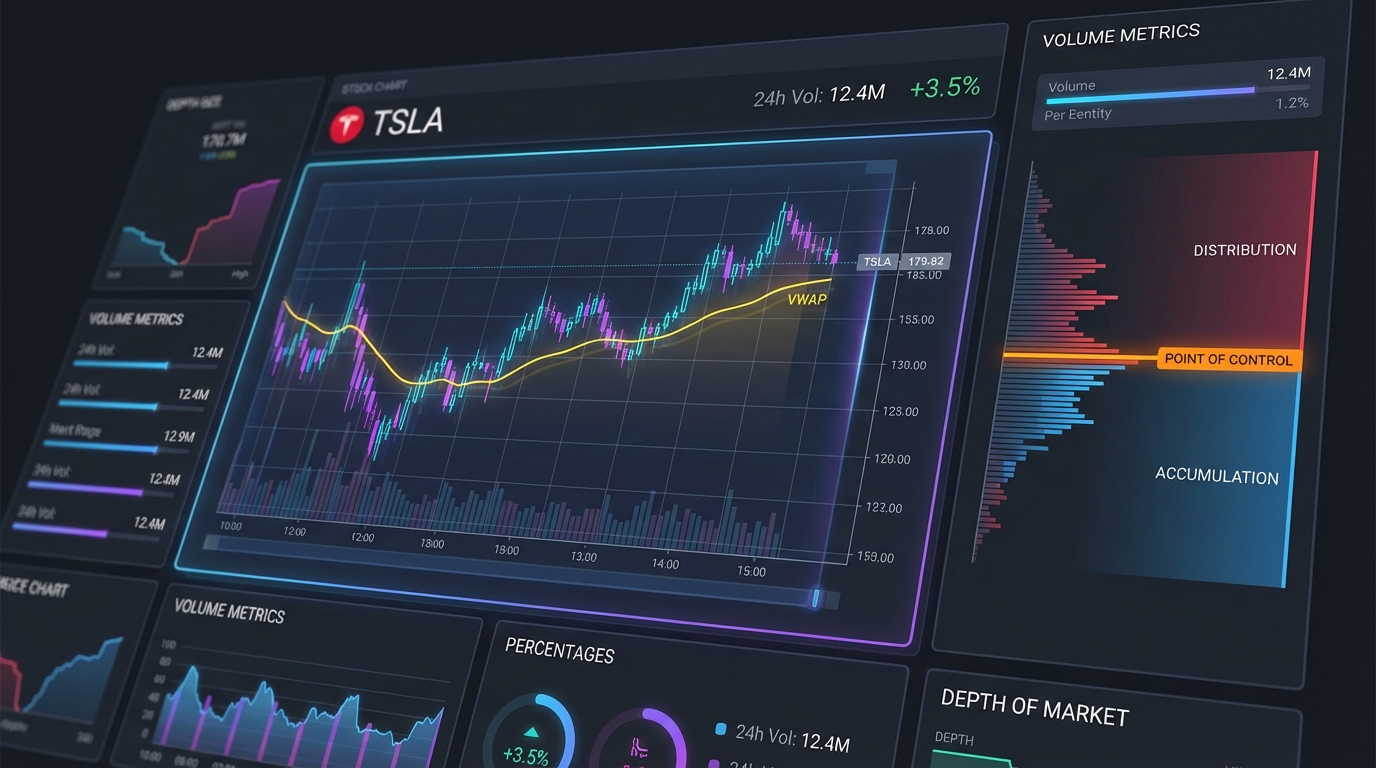
VWAP combines price and volume data to show the average price weighted by volume throughout the session. Institutional traders use VWAP as a benchmark for execution quality, making it a critical level for volume analysis. When price trades above VWAP on increasing volume, institutions are willing to pay premium prices, a bullish signal. Price below VWAP on heavy volume indicates distribution.
The most powerful volume analysis setup combines VWAP reclaims with volume spikes. When a stock that's been trading below VWAP suddenly spikes in volume and reclaims above VWAP, that's institutional buying pressure shifting the character of the stock from bearish to bullish. This setup is covered in detail in our guide on VWAP trading strategies.
Volume Profile and Point of Control
Volume profile displays volume traded at each price level rather than over time. The Point of Control (POC) is the price level with the highest volume, where the most shares changed hands. This represents a fair value area where both buyers and sellers agreed on price. Volume profile helps you identify where institutional positions are concentrated and which price levels are likely to act as support or resistance.
When price returns to the POC after moving away, watch for volume spikes. Heavy volume at the POC often indicates institutions defending their positions or adding to them. Light volume at the POC suggests the level may not hold, as there's insufficient interest to support price at that level.
Accumulation vs. Distribution Patterns
Advanced volume analysis distinguishes between accumulation (institutional buying) and distribution (institutional selling). Accumulation appears as increasing volume on up moves and decreasing volume on pullbacks, often within a consolidation range. Price may not move much, but volume tells you institutions are quietly building positions.
Distribution shows the opposite pattern: heavy volume on down moves and light volume on bounces. Price may even make new highs, but if those highs come on declining volume while selloffs show volume spikes, institutions are exiting into retail buying. This divergence between price and volume is one of the most reliable reversal signals in technical analysis.
Dark Pool Volume and Institutional Activity
In 2026, a significant portion of institutional trading occurs in dark pools, private exchanges where large orders execute without immediately impacting public markets. While you can't see dark pool orders in real-time, you can detect their footprints through unusual volume patterns. When a stock shows elevated RVOL but price remains range-bound, dark pool accumulation may be occurring. The eventual breakout from this consolidation often happens on explosive volume as the accumulated position gets marked up.
Using Volume Analysis with Other Technical Indicators
Volume analysis becomes even more powerful when combined with complementary technical indicators. Pair volume spikes with RSI divergences to identify reversal points. Use volume confirmation with moving average crossovers to validate trend changes. Combine RVOL filters with opening range breakout (ORB) strategies to find the highest-probability morning setups.
The key is using volume as a confirmation tool rather than a standalone signal. Every technical indicator becomes more reliable when validated by volume. A golden cross (50-day MA crossing above 200-day MA) on heavy volume is far more significant than the same crossover on declining volume.
Common Volume Analysis Mistakes and How to Avoid Them
Even experienced traders make critical errors when interpreting volume signals. Avoiding these common mistakes will dramatically improve your volume analysis accuracy and trading results.
Mistake #1: Chasing Volume Spikes Without Price Confirmation
Seeing a massive volume spike triggers FOMO, the fear of missing out. Traders jump into positions based solely on volume without waiting for price to confirm direction. The result? Entering at the top of a spike that immediately reverses. Always wait for price action confirmation. A volume spike tells you something is happening; price action tells you what that something is.
Mistake #2: Ignoring the Context of Volume
Not all volume spikes are created equal. A volume spike on earnings day is expected and less significant than the same spike on a random Tuesday. Volume increases around major news events, options expiration, and index rebalancing. Context matters. Before trading a volume signal, ask yourself: is there a fundamental catalyst explaining this activity, or is it purely technical?
Mistake #3: Using Volume Analysis in Isolation
Volume analysis is powerful but incomplete on its own. Traders who focus exclusively on volume signals while ignoring price structure, trend, and broader market conditions set themselves up for failure. Volume should confirm your other analysis, not replace it. The best trades combine volume confirmation with solid technical setups, favorable risk/reward, and alignment with the overall market trend.
Mistake #4: Misinterpreting Low-Volume Moves
Low volume doesn't always mean a move is invalid. In trending markets, pullbacks often occur on light volume as there's simply no selling pressure, holders aren't exiting. This is actually bullish. The mistake is treating all low-volume moves as weak. Learn to distinguish between low-volume pullbacks in strong trends (healthy) and low-volume breakouts (suspect).
Mistake #5: Not Adjusting for Different Market Conditions
Volume patterns change in different market environments. During high-volatility periods, average volume increases across the board, so your RVOL thresholds need adjustment. In low-volatility grinding markets, even modest volume increases can be significant. Successful volume analysis requires adapting your interpretation to current market conditions rather than applying rigid rules regardless of context.
Tools and Platforms for Real-Time Volume Analysis
Effective volume analysis in 2026 requires technology that can scan thousands of stocks simultaneously, identify volume anomalies in real-time, and deliver actionable alerts before opportunities disappear. Manual volume analysis simply can't compete with the speed and scale of modern trading platforms.
Why real-time volume scanning matters: By the time you manually identify a volume spike, institutional traders have already positioned themselves and the best entry point has passed. Real-time scanning detects volume anomalies within seconds, giving you the opportunity to analyze the setup and enter while the move is still developing rather than chasing after it's already extended.
When evaluating volume analysis tools, look for these essential features:
- Real-time RVOL calculations that update continuously throughout the session, not just end-of-day
- Customizable volume spike alerts with threshold settings for different timeframes
- Multi-timeframe volume analysis allowing you to verify signals across 1-minute to daily charts
- Integration with price action so volume signals are presented alongside chart patterns and technical levels
- Historical backtesting data showing how volume-based setups have performed in the past
- Mobile accessibility so you can monitor volume signals even when away from your desk
ChartMath automates RVOL and volume spike detection across 200+ technical screens, continuously scanning the market and alerting you the moment stocks match proven volume-based setups. Instead of manually refreshing screeners and calculating RVOL, ChartMath delivers ranked opportunities directly to your phone with plain-English explanations of why each signal triggered and what the historical edge is.
The platform combines volume analysis with price action patterns, showing you not just which stocks have elevated RVOL, but which ones are forming high-probability technical setups at key levels with volume confirmation. Each alert includes backtested performance data, win rate, average return, and sample size, so you can make informed decisions about which volume signals deserve your capital.
Setting up custom volume-based watchlists allows you to monitor your favorite stocks for specific volume conditions. For example, create a watchlist that alerts you when any stock breaks above VWAP on RVOL greater than 2.5x. Or set alerts for volume spikes at previous day's high on your swing trading candidates. This targeted approach ensures you're notified about the exact setups you trade rather than drowning in generic alerts.
The mobile versus desktop debate for volume analysis comes down to your trading style. Desktop platforms offer more screen real estate for multi-timeframe analysis and detailed volume profile studies. Mobile platforms provide the flexibility to monitor volume signals throughout the day without being chained to your desk. The ideal solution combines both: desktop for deep analysis and trade planning, mobile for real-time monitoring and execution when opportunities arise.
Modern traders in 2026 don't choose between mobile and desktop, they use integrated platforms that sync seamlessly between devices. You can set up your volume-based screens and watchlists on desktop, then receive push alerts on mobile when setups trigger, review the chart and backtest data on your phone, and execute through your broker's mobile app. This workflow ensures you never miss high-probability volume signals regardless of where you are.
Start Trading with Volume Analysis Confidence
Volume analysis transforms trading from guesswork into data-driven decision-making. By mastering RVOL interpretation, volume spike identification, and the integration of volume signals with price action, you've gained a critical edge that most retail traders lack. You now understand how to read institutional footprints, distinguish real breakouts from fakeouts, and time entries when smart money is actively participating.
The difference between profitable traders and those who struggle often comes down to one thing: acting on the right signals at the right time. You can have perfect volume analysis skills, but if you're manually scanning charts while institutional opportunities develop and disappear in minutes, you'll always be one step behind.
ChartMath eliminates that gap by continuously monitoring volume analysis signals across the entire market and delivering high-probability setups directly to your phone the moment they form. With 200+ pre-built screens including RVOL spikes, volume breakouts, and VWAP reclaims, all backed by transparent backtest data, you'll know exactly which volume signals have historically produced profits and which are just noise.
Ready to stop missing volume-based opportunities while you're in meetings or away from your screens? Watch the demo to see how ChartMath's real-time volume analysis and mobile-first interface can transform your trading workflow. Or jump straight in and download the app to start receiving volume spike alerts on proven technical setups today.
The market doesn't wait for you to manually calculate RVOL or spot volume spikes. In 2026, successful day traders use technology to automate the scanning while they focus on execution. Start using volume analysis the way professional traders do, with real-time data, backtested strategies, and alerts that actually matter.

Ankush Jindal
LinkedInSee these setups live in ChartMath
200+ curated screens with backtest data. First month $1.