ORB Trading Strategy: How to Find High-Probability Setups in 2026

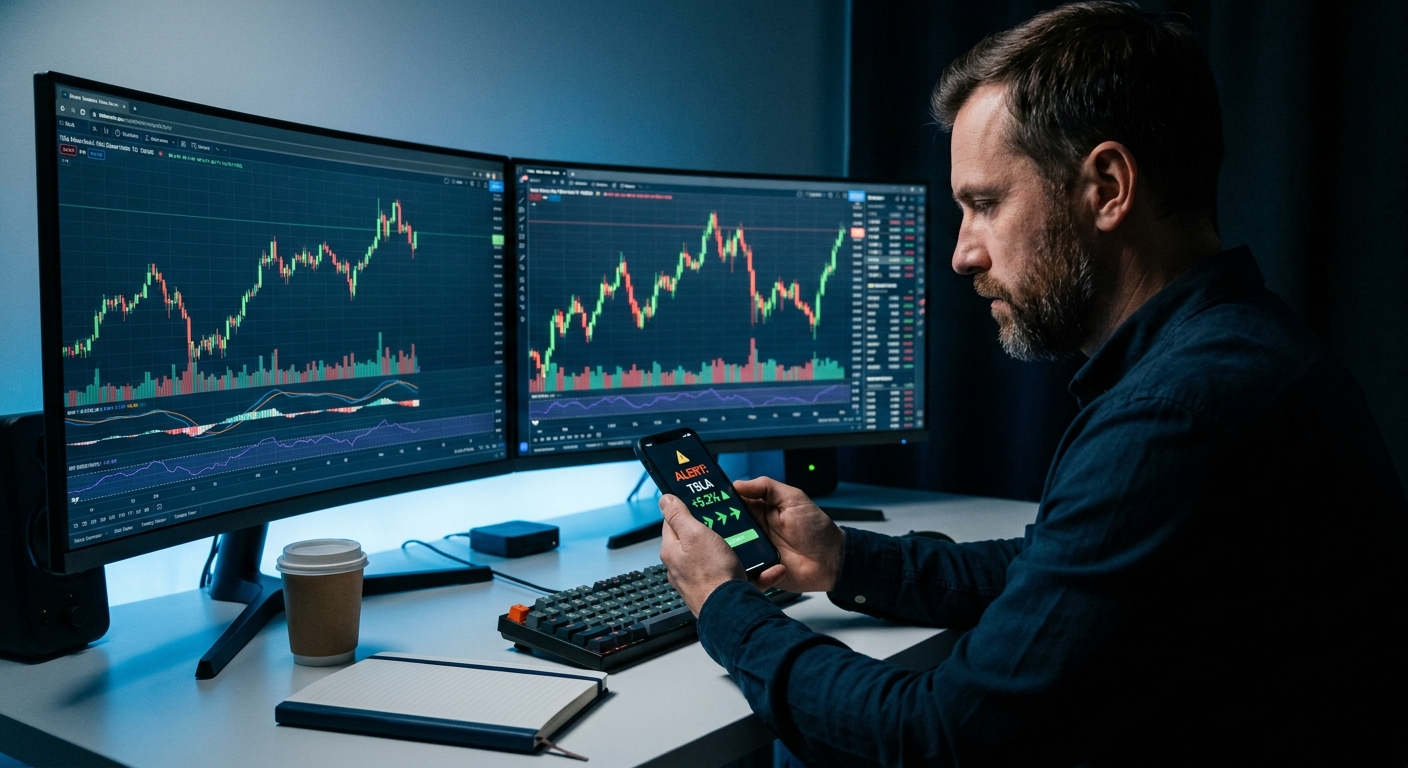
You've done the research. You know the setup. But by the time you look up from your coffee, the stock already moved 4% and you missed the entry — again. If that sounds familiar, ORB trading might be the most important strategy you're not executing consistently. The Opening Range Breakout is one of the most reliable, backtested intraday setups in technical trading, and in this guide, you'll learn exactly how to find, validate, and trade ORB setups in 2026 — without staring at charts all morning.
What Is ORB Trading (And Why Traders Love It)
ORB trading, or Opening Range Breakout trading, is a strategy built around one simple idea: the price range established in the first few minutes of the trading day acts as a battleground between buyers and sellers. When price breaks decisively above or below that range, it often signals the direction of the day's trend.
The "opening range" is typically defined as the high and low formed during the first 5, 15, or 30 minutes after the market opens at 9:30 AM ET. Once that range is established, traders watch for a clean breakout above the high (bullish) or below the low (bearish) as a signal to enter a momentum trade.
Why does it work? Because the opening minutes of the trading day are dominated by institutional order flow, overnight news reactions, and gap fills. This concentrated activity creates a well-defined price structure. When price breaks out of that structure with volume, it's not random — it's the market telling you where the money is going.
ORB trading has been a staple of professional day traders for decades. It was popularized by trader Toby Crabel in his 1990 book Day Trading with Short Term Price Patterns and Opening Range Breakout, and it remains one of the most studied and backtested intraday strategies today. The reason it has endured is simple: it works across market conditions, timeframes, and asset classes.
The opening range is the market's first vote on direction. When that vote breaks decisively, the crowd tends to follow.
The Science Behind ORB Trading: Why It Works
Understanding why ORB trading works makes you a better trader. It's not magic, it's market microstructure.
In the first 15 to 30 minutes of the trading day, several forces collide at once. Overnight orders get filled. Earnings reactions play out. Institutional desks execute their morning programs. Retail traders react to pre-market news. All of this activity compresses into a tight price range, creating what traders call the "opening range."
Once that initial chaos settles, the market has effectively "voted" on a fair value zone. A breakout above the opening range high signals that buyers have overwhelmed sellers and that momentum is likely to continue. A breakdown below the opening range low signals the opposite. This is why ORB trading setups tend to produce strong directional moves, you're trading with the momentum of institutional order flow, not against it.
Backtested data consistently shows that ORB breakouts on high-relative-volume stocks have win rates well above 50% when combined with proper confirmation signals like VWAP alignment and volume spikes. Platforms like ChartMath surface this backtest data directly alongside every ORB alert, so you know the historical edge before you place a single trade. For a deeper dive into how backtesting validates your edge, check out How to Build Winning Backtesting Strategies: A Complete Guide.
1. Choose Your ORB Timeframe (1m, 5m, or 15m)
Not all ORB setups are created equal. The timeframe you use to define the opening range dramatically affects the quality, frequency, and risk profile of your trades. Here's how to choose the right one for your style.
1-Minute ORB
The 1-minute ORB uses the first minute of trading (9:30, 9:31 AM ET) to define the range. This produces the tightest range and the most signals, but also the most noise. It's best suited for experienced scalpers who can manage fast-moving trades with tight stops. The risk of false breakouts is highest on this timeframe.
5-Minute ORB
The 5-minute ORB (9:30, 9:35 AM ET) is the most popular timeframe among active day traders. It balances signal quality with frequency, giving you a meaningful range while still catching early momentum moves. Most ORB trading strategies you'll find in the literature are built around the 5-minute timeframe.
15-Minute ORB
The 15-minute ORB (9:30, 9:45 AM ET) produces fewer signals but higher quality ones. By the time 15 minutes have passed, much of the early volatility has settled, and a breakout from this range tends to be more reliable. This is the best choice for part-time traders or anyone who can't watch the market in the first few minutes of the open. For more on fitting intraday strategies into a busy schedule, see Intraday Trading: How to Execute 1-Minute to 15-Minute Plays.
Quick reference:
- 1-minute ORB: Scalpers, high frequency, tight stops, experienced traders only
- 5-minute ORB: Most day traders, best balance of speed and reliability
- 15-minute ORB: Part-time traders, fewer but higher-quality setups
2. Identify the Opening Range High and Low
Once you've chosen your timeframe, the next step in ORB trading is marking the opening range on your chart. This sounds simple, but there are a few nuances that separate clean setups from choppy ones.
How to Mark the Opening Range
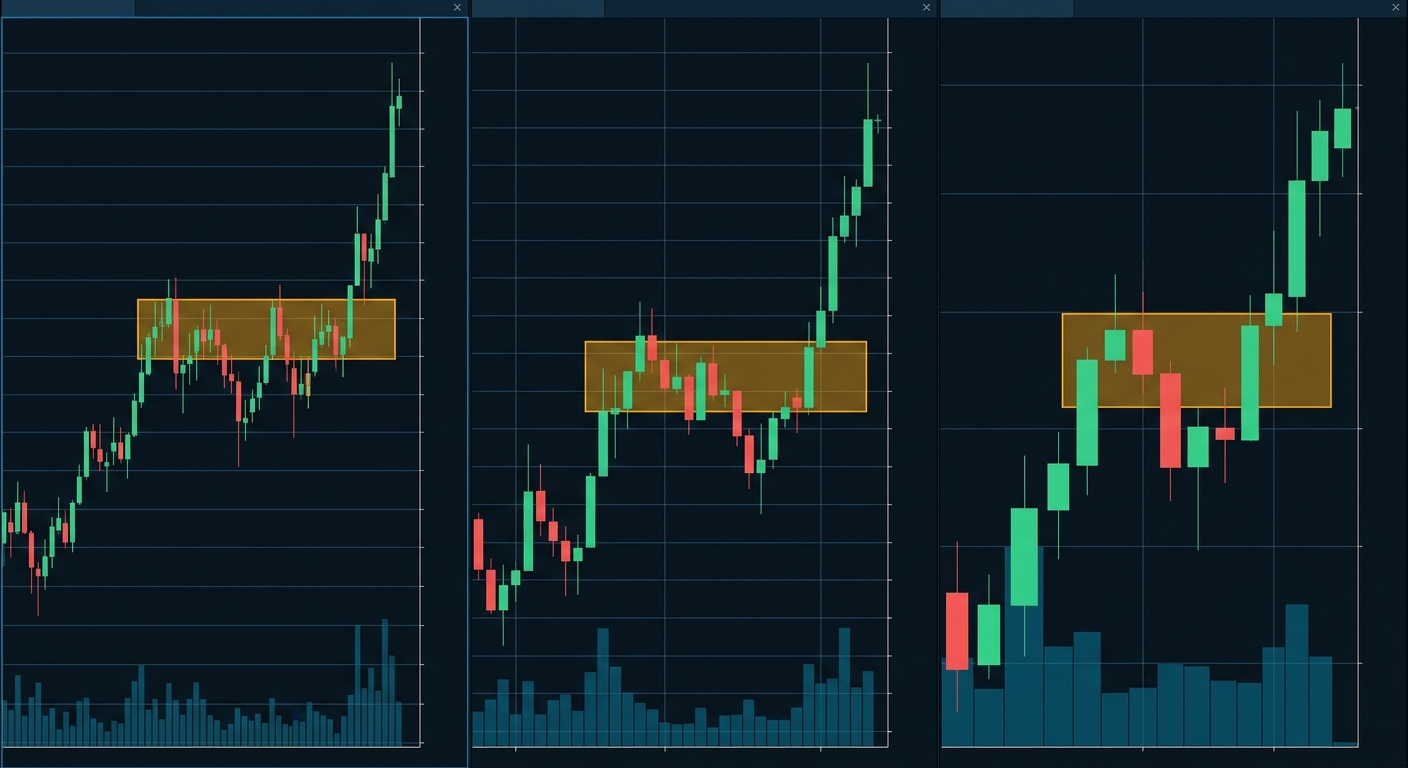
The opening range high is the highest price reached during your chosen opening window (e.g., the first 5 minutes). The opening range low is the lowest price during that same window. These two levels form a horizontal zone on your chart. Many charting platforms let you draw these as horizontal lines or a shaded box.
What Makes a Clean Opening Range
Not every opening range is worth trading. Look for these characteristics of a high-quality ORB setup:
- Tight, well-defined range: A narrow opening range (relative to the stock's ATR) creates cleaner breakout levels. Wide, choppy ranges produce unreliable signals.
- Above-average volume: The opening range should form on elevated volume, confirming institutional participation.
- Clear structure: Price should consolidate within the range, not spike wildly in both directions.
- Pre-market context: Gap-up stocks with a catalyst (earnings, news) tend to produce the strongest ORB breakouts.
Pre-Market Context Matters
Before the market opens, check the pre-market action. Stocks gapping up on strong volume with a clear catalyst are prime candidates for bullish ORB setups. Stocks gapping down on bad news are candidates for short ORB setups. Pre-market scanning is a critical part of the ORB workflow, for a full breakdown, see Premarket Trading: 7 Strategies to Find High-Probability Setups.
3. Validate the Breakout With Confirmation Signals
A price break above the opening range high is not enough on its own. The biggest mistake new ORB trading practitioners make is chasing every breakout without confirmation. Here's how to filter the real moves from the fakeouts.
Volume Confirmation (RVOL)
Relative Volume (RVOL) is your most important confirmation tool. When a stock breaks the opening range on RVOL of 1.5x or higher compared to its average volume at that time of day, the breakout has institutional backing. A breakout on low volume is a red flag, it suggests the move lacks conviction and is more likely to reverse.
VWAP Alignment
The Volume Weighted Average Price (VWAP) is the institutional benchmark for intraday fair value. For a bullish ORB trade, you want price to be above VWAP when it breaks the opening range high. For a bearish ORB trade, price should be below VWAP. Trading in the direction of VWAP significantly improves your win rate. To understand how VWAP fits into the broader picture, check out VWAP vs RVOL vs ORB: Which Technical Indicators Work Best?
Candle Close Confirmation
Wait for a candle to close above the opening range high before entering. Intrabar breakouts (where price briefly pokes above the level but hasn't closed) are notorious for reversing. A confirmed close above the level is a much stronger signal, even if it means a slightly worse entry price.
Avoiding False Breakouts
False breakouts are the enemy of ORB trading. Here are the warning signs:
- Breakout on declining or below-average volume
- Price breaks out but immediately reverses within 1-2 candles
- Breakout occurs against the VWAP direction
- The opening range itself was wide and choppy
- No pre-market catalyst or news to support the move
4. Set Up Real-Time ORB Alerts So You Never Miss an Entry
Here's the honest truth about ORB trading: the setup is simple, but execution is hard. You can't watch 500 stocks simultaneously at 9:30 AM. You can't be glued to your screen every morning. And manually scanning charts for ORB breaks while also managing open positions is a recipe for missed entries and costly mistakes.
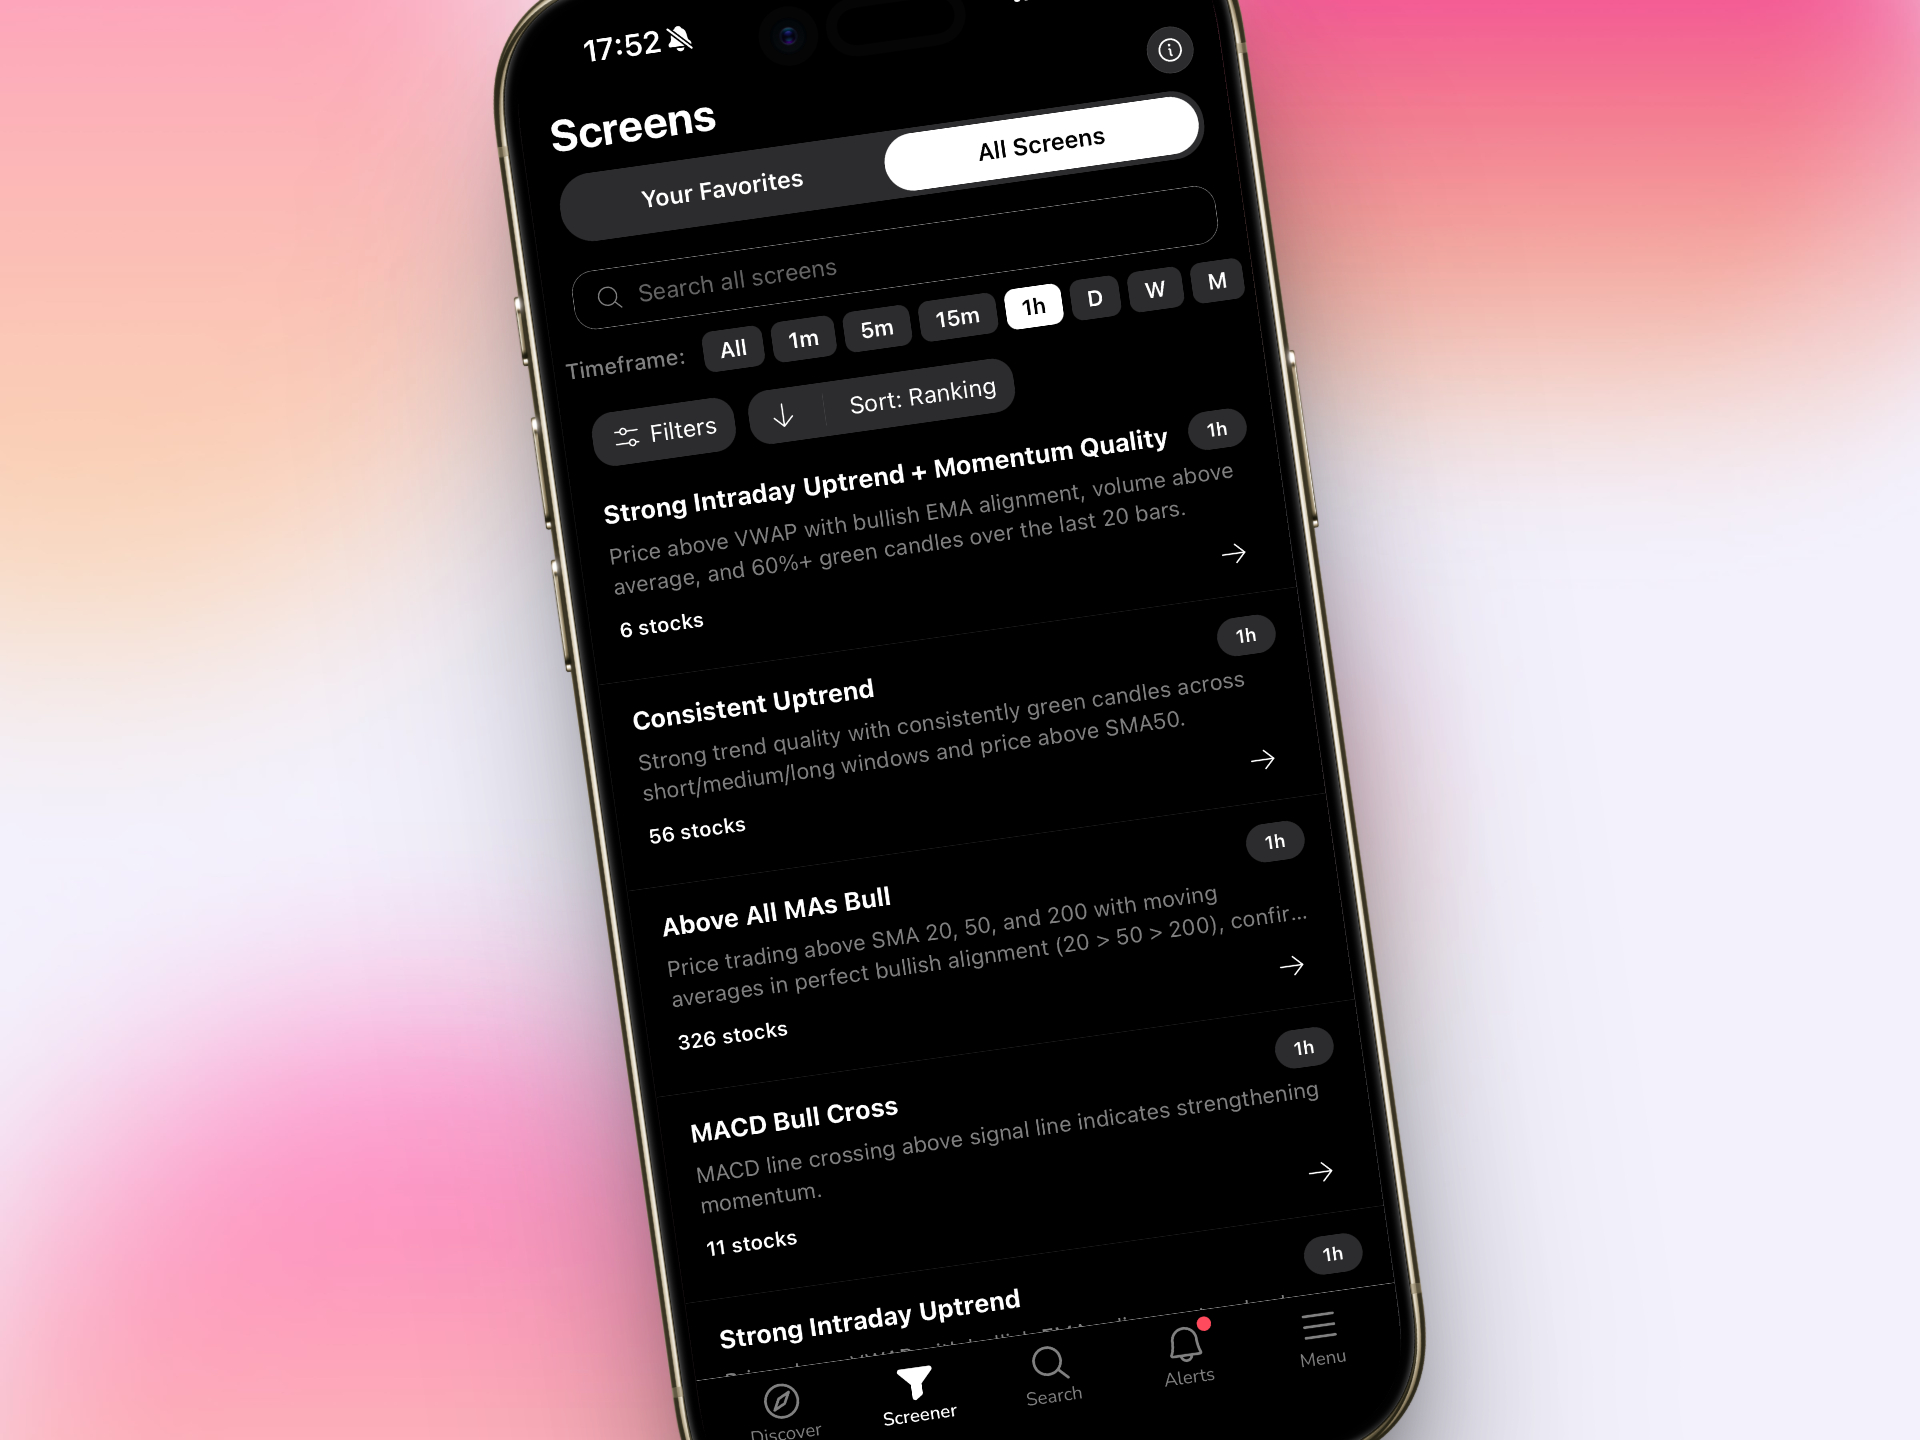
This is exactly the problem that ChartMath was built to solve. Instead of refreshing your screener every 30 seconds, ChartMath continuously scans the entire market across 200+ pre-built technical screens, including ORB breakouts on 1m, 5m, and 15m timeframes, and sends you a push alert the moment a qualifying setup triggers.
How ChartMath ORB Alerts Work
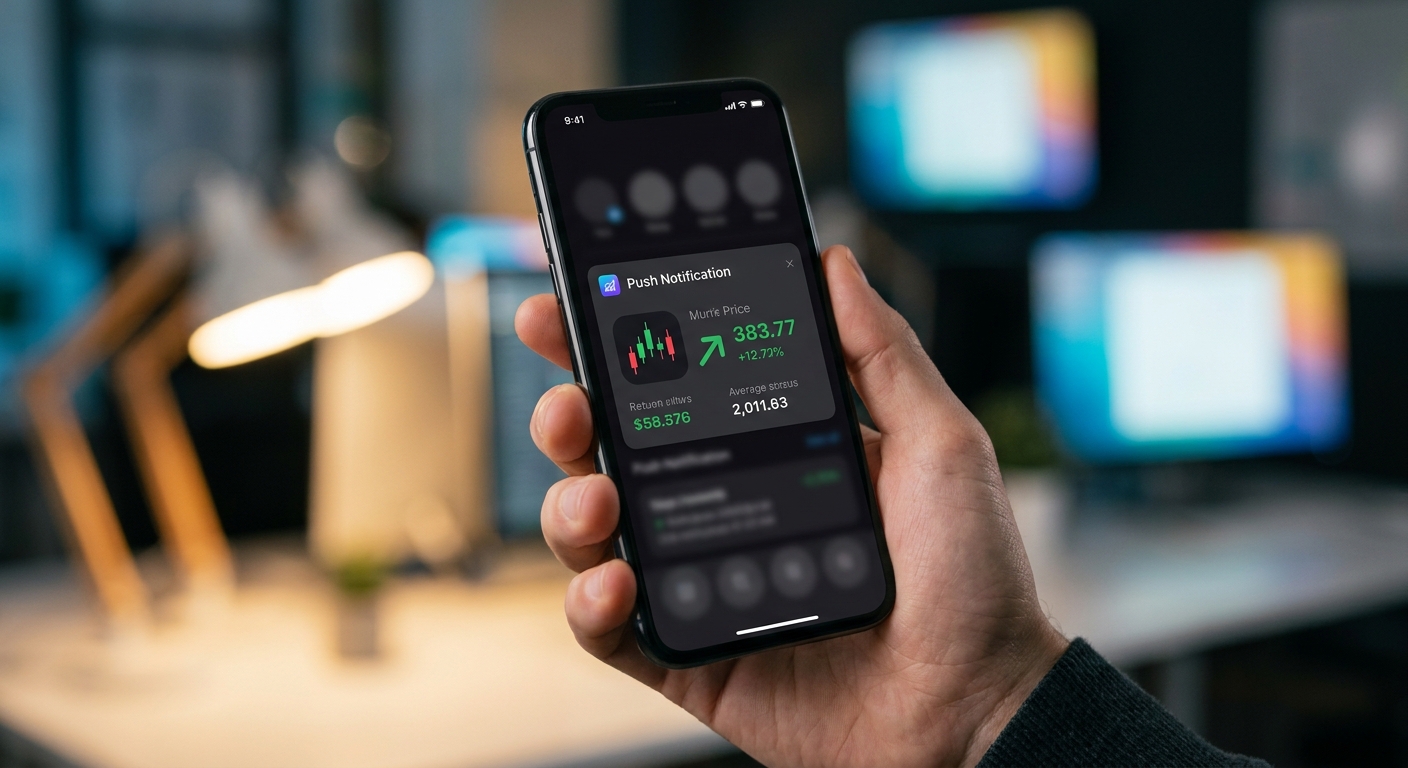
When a stock breaks its opening range with the required volume and momentum confirmation, ChartMath fires a push notification directly to your phone. But here's what makes it different from generic alert platforms: every alert comes with a plain-English explanation of why the setup triggered. You don't just get "AAPL broke $185." You get context: the timeframe, the RVOL reading, the VWAP relationship, and the historical win rate for that specific screen.
This matters because alert fatigue is real. Most traders who've used platforms like TradingView's Pine Script alerts know the frustration of getting 200 notifications a day, most of which are noise. ChartMath's intelligent filtering means you only get alerted when a setup meets all the criteria, not just one.
Setting Up ORB Alerts on ChartMath
- Download the ChartMath app from chartmath.com/app or access the web-based screener.
- Navigate to the Screener tab and filter by strategy type. Select "ORB" to see all available Opening Range Breakout screens.
- Choose your timeframe, 1m, 5m, or 15m ORB screens are all pre-built and ready to use. No Pine Script, no coding required.
- Enable push notifications for your chosen ORB screens. You'll receive alerts the moment a qualifying breakout triggers during market hours.
- Add stocks to your Watchlist to get ORB alerts specifically for the tickers you're already tracking.
The result? You can be in a meeting, at the gym, or away from your desk, and still get notified the moment a high-quality ORB trading setup fires. For a broader look at how to integrate alerts into your workflow, see How to Integrate Trading Alerts with Your Charting Platform.
ChartMath vs. TradingView for ORB Alerts
TradingView is a powerful charting platform, but building custom ORB alerts requires writing Pine Script code, a barrier for most traders. ChartMath's ORB screens are pre-built, backtested, and ready to use out of the box. You get the same (or better) alert quality without writing a single line of code, plus a mobile-first interface designed for traders who aren't chained to a desktop.
5. Validate Your Edge With Backtest Win-Rate Data
Here's a question most traders never ask: "What's the actual win rate of this setup?" They see a breakout, it looks clean, and they enter. That's not trading, that's hoping. Real ORB trading edge comes from knowing your numbers before you risk a dollar.
ChartMath shows historical performance data for every single ORB screen on the platform. Before you act on an alert, you can see the win rate, average return per trade, and maximum drawdown for that specific setup over hundreds of historical occurrences. This transparency is rare in the industry, most platforms either don't provide backtest data at all, or they hide it behind black-box AI scores (looking at you, Tickeron).
How to Use Backtest Data in Your ORB Trading
- Filter by win rate: Focus on ORB screens with win rates above 55-60% to trade only the highest-probability setups.
- Size positions appropriately: A setup with a 65% win rate and a 1:2 risk-reward ratio has a strong positive expectancy. Use this data to size positions with confidence.
- Set realistic expectations: Backtest data shows average returns and drawdowns, so you know what a "normal" losing streak looks like and won't panic out of a valid strategy.
- Compare timeframes: Use backtest data to determine whether the 5-minute or 15-minute ORB has historically performed better for the types of stocks you trade.
Trading without backtest data is like driving without a map. You might get somewhere, but you're mostly guessing. For a complete framework on building and interpreting backtesting results, read How to Build Winning Backtesting Strategies: A Complete Guide.
6. Execute the Trade: Entry, Stop-Loss, and Target
You've identified the opening range, confirmed the breakout, and validated the edge with backtest data. Now it's time to execute. Here's the standard ORB trading execution framework.
Entry
Enter on the close of the first candle that closes above the opening range high (for longs) or below the opening range low (for shorts). Some traders use a limit order just above the opening range high to get a better fill, but this risks missing the trade entirely if the move is fast. A market order on candle close is the more reliable approach for most traders.
Stop-Loss Placement
For long ORB trades, place your stop-loss just below the opening range low. This is the logical invalidation point, if price falls back below the entire opening range, the breakout has failed. For short ORB trades, place your stop just above the opening range high. Keep your stop tight but give the trade enough room to breathe. A stop placed too close to the entry will get triggered by normal intraday noise.
Profit Targets
The most common approach is to target a 1:2 or 1:3 risk-reward ratio. If your stop is $0.50 below your entry, your first target is $1.00 above entry (1:2) and your second target is $1.50 above entry (1:3). You can also use key technical levels as targets:
- VWAP: A common first target for ORB longs that start below VWAP
- Prior day's high: A natural resistance level for breakout trades
- Round numbers: Psychological levels like $50, $100, $200 often act as resistance
- Pre-market high: The highest price reached before the open is a key target for gap-up ORB setups
Scaling Out
Many experienced ORB trading practitioners scale out of positions rather than exiting all at once. A common approach: sell half the position at the 1:2 target, move the stop to breakeven on the remaining half, and let it run toward the 1:3 or beyond. This locks in profit while keeping exposure to a larger move.
For a complete breakdown of how ORB fits into a broader intraday trading workflow, see How to Build an Efficient Trading Workflow in 2026.
ORB Trading FAQs
What is the best time for ORB trading?
The best time for ORB trading is between 9:30 AM and 11:00 AM ET. This is when volume and volatility are highest, and ORB breakouts tend to produce the strongest directional moves. The 9:30, 9:45 AM window is when the opening range forms, and breakouts that occur between 9:45 AM and 10:30 AM tend to have the best follow-through.
Does ORB trading work in all market conditions?
ORB trading works best in trending market conditions with above-average volatility. In low-volatility, choppy markets (like a flat VIX environment with no catalysts), opening ranges tend to be narrow and breakouts are more likely to fail. Always check the broader market context, a strong SPY trend in the same direction as your ORB trade significantly improves the odds.
What stocks work best for ORB setups?
The best candidates for ORB trading are stocks with a clear catalyst (earnings, news, analyst upgrades), above-average relative volume (RVOL above 1.5x), and a clean pre-market gap. Liquid large-cap and mid-cap stocks with tight bid-ask spreads are preferable for execution. Avoid thinly traded stocks where slippage can eat into your edge.
How is ORB different from a standard breakout?
A standard breakout can occur at any time of day from any price level (resistance, consolidation zone, etc.). An ORB breakout is specifically defined by the opening range, the high and low of the first few minutes of the trading day. ORB setups are time-specific and benefit from the unique market dynamics of the opening session, making them a distinct and more predictable subset of breakout trading.
Can I automate ORB alerts without coding?
Yes. ChartMath provides pre-built ORB screens for 1m, 5m, and 15m timeframes that require zero coding. You simply enable the screen, turn on push notifications, and receive alerts when qualifying setups trigger. This is a major advantage over platforms like TradingView, where building equivalent alerts requires Pine Script knowledge. You can explore all available screens at app.chartmath.com.
How many ORB setups should I trade per day?
Quality over quantity is the golden rule of ORB trading. Most experienced traders focus on 1-3 high-quality setups per day rather than trading every breakout that appears. Use backtest win-rate data to filter for only the highest-probability setups, and be selective about the stocks you trade. More trades does not mean more profit, it usually means more commissions and more mistakes.
Start Trading ORB Setups With Confidence
ORB trading is one of the most powerful intraday strategies available to retail traders, but only if you can execute it consistently. That means catching breakouts in real time, validating them with volume and VWAP confirmation, and knowing the historical edge behind every setup you take. Doing all of that manually, across hundreds of stocks, while managing open positions and living your life, is nearly impossible.
ChartMath was built specifically for this problem. It scans the market continuously for ORB breakouts across all timeframes, delivers intelligent push alerts with plain-English context, and shows you the backtest win-rate data so you can trade with confidence, not guesswork. Whether you're a full-time day trader or someone who can only check their phone between meetings, ChartMath makes sure you never miss a high-quality ORB trading setup again.
Ready to see it in action? Watch the ChartMath demo to see how real-time ORB alerts work, or download the app and start discovering high-probability setups today.

Ankush Jindal
LinkedInSee these setups live in ChartMath
200+ curated screens with backtest data. 14-day free trial.