15 Most Profitable Chart Patterns for Day Traders in 2026

You've refreshed your screener 47 times today, squinted at dozens of charts, and still missed that perfect bull flag breakout on a stock you were watching. Sound familiar? Chart patterns remain one of the most reliable edges in day trading, but only if you can spot them in real-time and understand which ones actually work.
In 2026, successful day traders don't just recognize chart patterns—they know the backtested win rates, optimal entry points, and exact conditions that separate profitable setups from false signals. This comprehensive guide breaks down the 15 most profitable chart patterns with real performance data, entry strategies, and risk management techniques you can implement immediately.
Whether you're scalping 5-minute breakouts or holding swing positions overnight, mastering these chart patterns will transform how you identify and execute high-probability trades. Let's dive into the patterns that consistently deliver results.
Why Chart Patterns Still Matter for Day Traders in 2026
Despite the rise of algorithmic trading and AI-powered analysis, chart patterns remain fundamentally relevant because they represent collective market psychology. When thousands of traders recognize the same pattern, their combined actions create self-fulfilling prophecies that drive price movement.
Chart patterns provide a visual edge that helps day traders quickly assess market sentiment, identify potential reversals, and spot continuation opportunities. Unlike complex mathematical indicators, patterns tell a story about the battle between buyers and sellers—information you can process in seconds while scanning multiple stocks.
However, pattern recognition alone isn't enough. The most successful traders in 2026 combine visual pattern identification with volume confirmation, momentum indicators like RVOL, and backtested performance data. A bull flag with 65% historical win rate and 2:1 risk-reward ratio deserves more attention than a rare pattern with no statistical edge.
Modern trading platforms now provide instant access to backtested win rates for every pattern, eliminating guesswork and helping you focus on setups with proven track records. This data-driven approach to chart patterns separates profitable traders from those who chase every formation they see.
How to Use This Chart Patterns Guide
Each pattern in this guide includes four critical components: structure identification, historical win rate data, optimal entry and exit strategies, and common failure scenarios. Understanding all four elements is essential for consistent profitability.
Win rate tells you how often a pattern succeeds, but it's only half the equation. A pattern with 55% win rate and 3:1 risk-reward ratio will outperform a 70% win rate pattern with 1:1 risk-reward over time. Always consider both metrics when evaluating chart patterns.
Timeframe matters significantly. A cup and handle pattern on a daily chart might take weeks to develop and play out, making it ideal for swing traders but useless for day traders working 5-minute charts. We'll specify the best timeframes for each pattern throughout this guide.
Volume confirmation is non-negotiable for high-probability setups. Patterns that break out on weak volume fail at much higher rates than those accompanied by RVOL spikes of 2x or greater. If you're not monitoring volume, you're trading blind. Learn more about integrating these signals in our guide on how to integrate trading alerts with your charting platform.
1. Bull Flag Pattern
The bull flag pattern is a continuation pattern that forms after a strong upward price move (the flagpole) followed by a tight consolidation period (the flag). This pattern signals that buyers are taking a brief pause before pushing prices higher.
The pattern structure requires a sharp upward move of at least 10-15% on strong volume, followed by a consolidation period lasting 5-20 bars where price drifts slightly downward or sideways on declining volume. The consolidation should form parallel trendlines that slope against the prevailing uptrend.
Historical win rate for bull flags ranges from 60-68% depending on timeframe, with the highest success rates on 15-minute and 1-hour charts. The expected value per trade averages 1.8:1 to 2.5:1 risk-reward when properly executed with tight stops.
Enter the trade when price breaks above the upper flag trendline with volume exceeding 1.5x the 20-period average. Place your stop loss just below the lower flag trendline or the midpoint of the flag, depending on your risk tolerance. Target a move equal to the height of the flagpole measured from the breakout point.
Common mistakes include entering too early during consolidation, ignoring volume confirmation, and using flags that consolidate for too long (more than 20 bars typically fail). The tighter and shorter the flag, the more explosive the breakout tends to be.
2. Cup and Handle Pattern
The cup and handle is a bullish continuation pattern that resembles a teacup when viewed on a chart. It forms when price creates a rounded bottom (the cup) followed by a small downward drift (the handle) before breaking out to new highs.
Pattern formation typically takes 7-65 trading days, making it more suitable for swing traders than pure day traders. However, intraday versions can form on 1-hour and 4-hour charts for active traders. The cup should be U-shaped rather than V-shaped, indicating gradual accumulation rather than a sharp reversal.
Win rate data shows 65-72% success rate for properly formed cup and handle patterns, with average gains of 20-35% from breakout point to target. The pattern works best in strong uptrends where the stock is making new highs before forming the cup.
Entry strategy involves waiting for price to break above the handle's resistance level on volume at least 50% above average. The handle should form in the upper third of the cup and retrace no more than 50% of the cup's advance. Place stops below the handle's low point.
False breakouts occur when the cup is too deep (more than 50% retracement), the handle drifts too low, or volume doesn't confirm the breakout. Avoid cups with sharp V-shaped bottoms, as these lack the accumulation phase necessary for sustained moves.
3. Ascending Triangle Pattern
The ascending triangle is a bullish continuation pattern characterized by a flat upper resistance level and a rising lower trendline. This formation shows buyers becoming increasingly aggressive while sellers hold firm at a specific price level—until they don't.
Pattern characteristics include at least two touches of the horizontal resistance and two higher lows forming the ascending support line. The pattern typically forms over 3-12 weeks on daily charts, or 20-60 bars on intraday timeframes. Volume should contract during formation and expand on breakout.
Backtested performance metrics show 72-75% win rate for ascending triangles, making them one of the most reliable chart patterns for day traders. Average profit potential ranges from 15-25% measured from the breakout point, with the pattern height serving as the minimum target.
Entry triggers include a decisive break above the horizontal resistance on volume exceeding 2x average. Some aggressive traders enter on the third or fourth touch of support before the breakout, but this increases risk. Conservative entries wait for a close above resistance and a successful retest.
Volume analysis is critical—declining volume during formation followed by a surge on breakout confirms strong buying pressure. Pattern failure indicators include a breakdown below the ascending support line or multiple failed breakout attempts that quickly reverse back into the triangle.
4. Head and Shoulders Pattern
The head and shoulders is the most recognized reversal pattern in technical analysis, signaling a shift from uptrend to downtrend. It consists of three peaks: a left shoulder, a higher middle peak (the head), and a right shoulder at approximately the same height as the left.
Classic reversal pattern structure requires the three peaks to form above a common support level called the neckline. The neckline can be horizontal or slightly sloped, connecting the lows between the shoulders and head. Volume should be highest on the left shoulder, lower on the head, and lowest on the right shoulder.
Win rate for bearish head and shoulders setups ranges from 60-65% when the neckline breaks on strong volume. The pattern is more reliable on longer timeframes (daily and weekly charts) than on intraday charts where false signals are more common.
Neckline break entry strategy involves entering a short position when price closes below the neckline with volume at least 1.5x average. Conservative traders wait for a throwback rally to the neckline that fails, providing a lower-risk entry. Place stops above the right shoulder or the head, depending on risk tolerance.
Target calculation uses the distance from the head to the neckline, projected downward from the breakout point. The inverse head and shoulders variation works identically but signals bullish reversals, with win rates of 62-68% when properly formed with volume confirmation.
5. Double Bottom Pattern
The double bottom is a bullish reversal pattern that forms after a downtrend, creating two distinct lows at approximately the same price level. This pattern indicates that sellers have exhausted their momentum and buyers are stepping in at a specific support level.
Pattern formation requires two clear lows separated by a moderate peak (the middle high), with the second low forming on lower volume than the first. The two lows should be within 3-4% of each other, and the pattern typically takes 4-12 weeks to complete on daily charts.
Historical success rate for double bottoms ranges from 65-70%, with higher reliability when the pattern forms at major support levels or after extended downtrends. Average profit potential is 20-30% from the breakout point to the measured target.
Entry timing requires patience—wait for price to break above the middle high (the neckline) on volume exceeding 1.5x average. Premature entries during the formation of the second bottom often result in whipsaws. Confirmation signals include a successful retest of the breakout level and sustained momentum above the neckline.
Stop loss placement should be below the lower of the two bottoms, typically 2-3% below to avoid normal volatility. Profit target methodology measures the distance from the lows to the middle high, then projects that distance upward from the breakout point. For more on identifying these setups efficiently, check out our guide on how to use stock screeners for day trading.
6. Falling Wedge Pattern
The falling wedge is a bullish reversal pattern where both the upper resistance and lower support trendlines slope downward, but the support line descends at a steeper angle. This creates a narrowing price range that typically resolves with an upward breakout.
Bullish reversal pattern mechanics show price making lower highs and lower lows, but with diminishing momentum as the wedge narrows. Volume should contract throughout the formation, indicating selling pressure is weakening. The pattern typically forms over 3-8 weeks on daily charts.
Win rate and risk-reward profile data shows 68-72% success rate for falling wedges, with average gains of 25-35% from breakout to target. The pattern is more reliable when it forms after a significant downtrend rather than as a continuation pattern in an uptrend.
Breakout entry strategy involves waiting for a decisive close above the upper resistance trendline on volume at least 2x average. The breakout often occurs in the final third of the wedge, when the pattern is most compressed. Avoid entering before the breakout, as prices can continue grinding lower within the wedge.
Volume divergence signals are particularly important, look for volume to decline as price makes new lows, then surge on the breakout. Timeframe considerations favor daily and weekly charts over intraday timeframes, where falling wedges are less reliable and more prone to false breakouts.
7. Symmetrical Triangle Pattern
The symmetrical triangle is a neutral consolidation pattern formed by converging trendlines, an ascending lower trendline and a descending upper trendline. Unlike ascending or descending triangles, this pattern doesn't favor either direction until the breakout occurs.
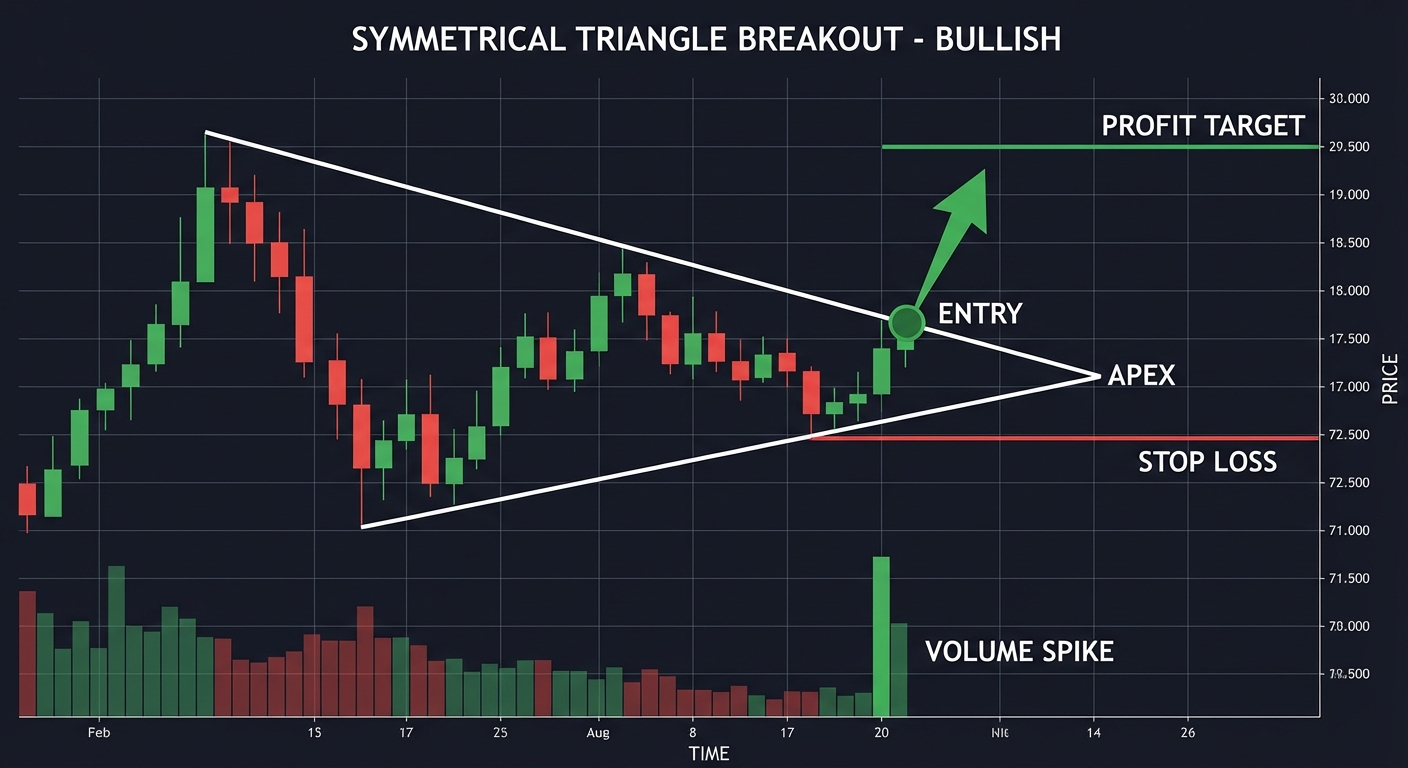
Neutral consolidation pattern structure requires at least two touches on each trendline (four total pivot points) and typically forms over 1-3 months on daily charts or 20-50 bars on intraday timeframes. The pattern should break out before price reaches the apex, breakouts near the apex tend to be weak.
Directional breakout statistics show approximately 54% of symmetrical triangles break upward and 46% break downward, making pre-breakout direction prediction unreliable. However, the pattern's win rate is 65-70% once the breakout direction is confirmed with volume.
Entry strategy for both directions involves waiting for a decisive close outside either trendline on volume exceeding 1.5x average. Place stops just inside the opposite trendline. Some traders enter positions in both directions with tight stops, letting the market decide which trade works.
Volume confirmation importance cannot be overstated, symmetrical triangles that break on weak volume have failure rates exceeding 50%. Pattern duration and reliability are inversely related; triangles that take longer than 3 months to form or break out near the apex are significantly less reliable.
8. Bear Flag Pattern
The bear flag is the bearish counterpart to the bull flag, a continuation pattern that forms after a sharp downward move (the flagpole) followed by a tight upward or sideways consolidation (the flag). This pattern signals that sellers are pausing before resuming the downtrend.
Continuation pattern for downtrends requires a sharp decline of at least 10-15% on strong volume, followed by a consolidation period of 5-20 bars where price drifts slightly upward on declining volume. The flag should slope against the prevailing downtrend, creating parallel trendlines.
Short-selling win rate data shows 62-68% success rate for bear flags, with the highest reliability on 15-minute and 1-hour charts during strong downtrends. Expected value ranges from 1.8:1 to 2.5:1 risk-reward when executed with proper stop placement.
Entry point below flag support occurs when price breaks down through the lower flag trendline on volume exceeding 1.5x average. Place stops just above the upper flag trendline or the midpoint of the flag. Target a move equal to the height of the flagpole measured downward from the breakdown point.
Risk management for bearish trades requires extra caution, as short squeezes can cause rapid reversals. Market conditions favoring the pattern include overall market weakness, sector rotation away from the stock's industry, and negative news catalysts that triggered the initial flagpole decline.
9. Rectangle Pattern (Trading Range)
The rectangle pattern, also called a trading range or consolidation box, forms when price oscillates between parallel horizontal support and resistance levels. This pattern can resolve in either direction, making it a neutral formation until the breakout occurs.
Horizontal consolidation characteristics include at least two touches of both the upper resistance and lower support levels, creating a clear price channel. The pattern typically lasts 3-12 weeks on daily charts and represents a period of equilibrium between buyers and sellers.
Breakout direction probabilities are roughly 50/50, but the prevailing trend before the rectangle formation provides a slight edge, rectangles in uptrends break upward 55-60% of the time, while those in downtrends favor downward breaks. Overall win rate after breakout is 60-65% with volume confirmation.
Range trading vs breakout strategies offer two approaches: trade the bounces between support and resistance during formation, or wait for the breakout. Range trading works well for choppy markets but requires tight risk management. Breakout trading offers better risk-reward but requires patience.
Volume analysis for direction bias can provide clues, if volume is higher on rallies to resistance, an upward breakout is more likely. Higher volume on declines to support suggests a downward break. False breakout management requires stops just outside the opposite boundary and confirmation with a close beyond the breakout level.
10. Pennant Pattern
The pennant is a short-term continuation pattern that looks like a small symmetrical triangle. It forms after a strong price move (the flagpole) and represents a brief consolidation before the trend resumes. Pennants are among the fastest-forming chart patterns.
Short-term continuation pattern features include converging trendlines that form over just 1-3 weeks (or 5-15 bars on intraday charts), creating a small triangular shape. The pattern should form after a sharp, nearly vertical price move of at least 10% in a short period.
Win rate for intraday traders using pennants ranges from 58-65%, with higher success rates when the pattern forms in the direction of the prevailing trend. The quick formation and resolution make pennants ideal for active day traders working 5-minute to 1-hour timeframes.
Quick entry and exit strategy involves entering when price breaks out of the pennant in the direction of the prior move, with stops just inside the opposite trendline. Because pennants are short-lived, targets should be modest, aim for a move equal to the flagpole height measured from the breakout point.
Volume spike requirements are critical for pennant reliability. Look for volume to contract sharply during pennant formation, then surge to at least 2x average on the breakout. Pattern duration limits are strict, pennants that take longer than 3 weeks to form lose their reliability and should be treated as symmetrical triangles instead.
11. Triple Top Pattern
The triple top is a strong bearish reversal pattern that forms when price tests a resistance level three times and fails to break through. This pattern indicates that buyers have exhausted their momentum and sellers are gaining control.
Strong resistance reversal pattern structure requires three distinct peaks at approximately the same price level (within 3-4% of each other), separated by moderate pullbacks. The pattern typically takes 3-6 months to form on daily charts, making it more suitable for swing traders than day traders.
Bearish breakdown success rate ranges from 65-70% when the support level (neckline) connecting the lows between peaks breaks on strong volume. The pattern is more reliable when it forms at major resistance levels or after extended uptrends.
Entry after third rejection can be aggressive (shorting at the third peak) or conservative (waiting for the neckline break). Conservative entries offer better risk-reward and higher win rates. Enter short when price closes below the neckline on volume exceeding 1.5x average.
Target calculation from pattern height measures the distance from the peaks to the neckline, then projects that distance downward from the breakdown point. Volume confirmation signals should show declining volume on each successive peak and expanding volume on the breakdown.
12. Descending Triangle Pattern
The descending triangle is a bearish continuation pattern characterized by a flat lower support level and a descending upper trendline. This formation shows sellers becoming increasingly aggressive while buyers defend a specific price level, until support breaks.
Bearish continuation pattern structure includes at least two touches of the horizontal support and two lower highs forming the descending resistance line. The pattern typically forms over 3-12 weeks on daily charts or 20-60 bars on intraday timeframes.
Historical breakdown performance shows 72-75% win rate for descending triangles, making them one of the most reliable bearish patterns. Average profit potential ranges from 15-25% measured downward from the breakdown point, with the pattern height serving as the minimum target.
Entry below support level requires a decisive break through the horizontal support on volume exceeding 2x average. Some aggressive traders short on the third or fourth touch of resistance before the breakdown, but this increases risk significantly.
Stop loss above resistance trendline should be placed just above the most recent lower high or the descending trendline. Best market environments for descending triangles include overall market weakness, sector underperformance, and stocks in established downtrends.
13. Rising Wedge Pattern
The rising wedge is a bearish reversal pattern where both trendlines slope upward, but the lower support line rises at a steeper angle than the upper resistance line. This creates a narrowing price range that typically resolves with a downward breakdown.
Bearish reversal pattern mechanics show price making higher highs and higher lows, but with diminishing momentum as the wedge narrows. Volume should contract throughout the formation, indicating buying pressure is weakening despite rising prices, a classic divergence signal.
Win rate and profit expectations show 65-70% success rate for rising wedges, with average declines of 20-30% from breakdown to target. The pattern is more reliable when it forms after a significant uptrend rather than as a continuation pattern in a downtrend.
Breakdown entry strategy involves waiting for a decisive close below the lower support trendline on volume at least 2x average. The breakdown often occurs in the final third of the wedge when the pattern is most compressed. Place stops just above the upper resistance trendline.
Volume divergence as warning sign is the key to identifying rising wedges early, look for volume to decline as price makes new highs, indicating weakening buying pressure. Common false signals include wedges that break upward (rare but possible) or wedges that form too quickly (less than 3 weeks).
14. Double Top Pattern
The double top is a classic bearish reversal pattern that forms after an uptrend, creating two distinct peaks at approximately the same price level. This pattern indicates that buyers have twice failed to push prices higher, and sellers are gaining control.
Classic reversal pattern identification requires two clear peaks separated by a moderate low (the middle low), with the second peak forming on lower volume than the first. The two peaks should be within 3-4% of each other, and the pattern typically takes 4-12 weeks to complete on daily charts.
Success rate for bearish trades ranges from 60-65%, with higher reliability when the pattern forms at major resistance levels or after extended uptrends. Average profit potential is 20-30% from the breakdown point to the measured target.
Entry after neckline break requires patience, wait for price to close below the middle low (the neckline) on volume exceeding 1.5x average. Premature short entries during the formation of the second peak often result in whipsaws and stop-outs.
Measuring profit targets uses the distance from the peaks to the middle low, then projects that distance downward from the breakdown point. Pattern failure scenarios include a breakout above the second peak (creating a continuation pattern instead) or a weak breakdown on low volume that quickly reverses.
15. Rounding Bottom Pattern
The rounding bottom, also called a saucer bottom, is a long-term bullish reversal pattern that forms a smooth, U-shaped curve. This pattern represents a gradual shift from selling pressure to buying pressure over an extended period.
Long-term accumulation pattern characteristics include a smooth, rounded bottom without sharp V-shaped reversals, typically taking 3-12 months to form on daily charts. The pattern shows a gradual transition from downtrend to uptrend, with price slowly building a base.
Win rate for swing traders using rounding bottoms ranges from 70-75%, making it one of the most reliable patterns for longer-term positions. However, the extended formation period makes it unsuitable for day traders focused on intraday timeframes.
Entry strategy and confirmation involve waiting for price to break above the pattern's rim (the highest point of the left side) on expanding volume. Conservative traders wait for a successful retest of the rim before entering. The pattern works best when volume forms a U-shape that mirrors the price curve.
Volume curve analysis is critical, volume should be highest at the beginning of the pattern (during the decline), lowest at the bottom (during accumulation), and increasing as price rises on the right side. Patience requirements and timeframes make this pattern ideal for swing traders willing to hold positions for weeks or months. Learn how to build these longer-term setups into your workflow with our swing trading guide for busy professionals.
Combining Chart Patterns with Technical Indicators
Chart patterns become significantly more powerful when combined with technical indicators that confirm momentum, volume, and trend strength. The most successful day traders in 2026 don't rely on patterns alone, they use a multi-layered approach that validates setups before entry.

Using VWAP to confirm pattern breakouts adds an important layer of validation. When a bull flag breaks out above both the flag resistance and VWAP simultaneously, the setup has significantly higher win rates than breakouts below VWAP. VWAP acts as a dynamic support/resistance level that institutions watch closely.
RVOL spikes as volume confirmation provide objective measurement of breakout strength. A pattern breakout accompanied by RVOL of 3x or higher indicates genuine institutional interest, not just retail traders chasing. Breakouts on RVOL below 1.5x often fail within hours as momentum fades.
ORB strategies with pattern entries create powerful combinations for day traders. When a stock breaks its opening range in the same direction as a chart pattern breakout, the probability of a sustained move increases dramatically. This confluence of signals filters out weak setups and focuses attention on the highest-quality opportunities.
Momentum indicators for pattern validation include RSI, MACD, and stochastic oscillators. Look for bullish divergence (price making lower lows while RSI makes higher lows) during pattern formation, or momentum confirmation (RSI above 50) on breakouts. These indicators help identify patterns with the strongest underlying momentum.
Multi-timeframe pattern analysis is essential for context. A bull flag on a 5-minute chart has higher reliability when the 1-hour and daily charts also show uptrends. Conversely, a bullish pattern on a 5-minute chart within a daily downtrend faces significant headwinds. Always check at least two higher timeframes before entering pattern-based trades. For more on integrating these indicators, see our comparison of VWAP vs RVOL vs ORB indicators.
Common Chart Pattern Mistakes Day Traders Make
Even experienced traders fall into predictable traps when trading chart patterns. Understanding these common mistakes helps you avoid costly errors and improve your win rate significantly.
Trading patterns without volume confirmation is the most frequent mistake. A perfect-looking bull flag that breaks out on weak volume has a failure rate exceeding 60%. Volume is the fuel that drives breakouts, without it, patterns are just lines on a chart. Always require volume at least 1.5x average for any breakout trade.
Ignoring timeframe context leads to conflicting signals and whipsaws. A bullish pattern on a 5-minute chart means little if the daily chart shows a strong downtrend with the stock approaching major resistance. Always align your pattern trades with the higher timeframe trend, or at minimum, be aware of the headwinds you're trading against.
Poor risk management and stop loss placement destroys otherwise solid pattern trading strategies. Stops placed too tight get triggered by normal volatility before the pattern can work. Stops placed too wide risk excessive capital on each trade. Use the pattern structure itself to guide stop placement, below support for bullish patterns, above resistance for bearish patterns.
Chasing patterns after breakout is a recipe for buying tops and selling bottoms. The best entries occur at the breakout point or on the first pullback after breakout. Entering after a stock has already moved 5-10% beyond the breakout level dramatically reduces your risk-reward ratio and increases the likelihood of a reversal.
Not backtesting pattern performance means you're trading blind. Different patterns have different win rates, risk-reward profiles, and optimal timeframes. Without backtested data, you can't distinguish between high-probability setups and low-probability gambles. Modern platforms provide this data instantly, use it to filter your trades and focus on patterns with proven edges.
How to Scan for Chart Patterns in Real-Time
Manual pattern scanning is the bottleneck that prevents most traders from capitalizing on chart patterns consistently. You can't watch 500 stocks simultaneously, and by the time you spot a pattern manually, the best entry point has often passed.

The challenge of manual pattern scanning becomes obvious when you consider the math. If it takes 30 seconds to analyze each chart, scanning just 100 stocks requires 50 minutes. By the time you finish, the first stocks you scanned have moved, and you need to start over. This approach doesn't scale for active day traders.
Automated pattern recognition tools solve this problem by continuously scanning thousands of stocks across multiple timeframes, identifying patterns the moment they form. These tools use algorithms to detect the specific price and volume characteristics that define each pattern, eliminating human error and fatigue.
Real-time alerts for pattern formations ensure you never miss a setup on your watchlist or across the broader market. Instead of refreshing screeners manually, you receive push notifications the moment a bull flag forms on a stock you're tracking, or when an ascending triangle breaks out with strong volume.
Filtering patterns by win rate and quality separates professional-grade tools from basic scanners. Not all bull flags are created equal, a bull flag with tight consolidation, strong volume on the flagpole, and RVOL confirmation deserves priority over a sloppy flag with weak volume. Advanced platforms rank patterns by quality and historical performance.
Mobile-first pattern discovery workflow represents the future of pattern trading. ChartMath's TikTok-style swipe interface lets you discover the highest-quality chart patterns across the entire market in seconds, with each setup showing backtested win rates, plain-English explanations, and optimal entry points. No more manual scanning, no more missed opportunities, just swipe through ranked setups and execute the best ones. Download the app to experience pattern discovery reimagined for 2026.
Start Trading Chart Patterns with Confidence
The 15 chart patterns covered in this guide represent the most reliable, profitable setups available to day traders in 2026. From the 72-75% win rate of ascending triangles to the powerful reversal signals of head and shoulders formations, these patterns provide a proven edge when executed with proper risk management and volume confirmation.
The highest win rate patterns, ascending triangles, descending triangles, and falling wedges, share common characteristics: clear structure, strong volume confirmation requirements, and well-defined entry and exit points. Focus your attention on these patterns first, then expand to other formations as you gain experience and confidence.
Importance of backtested data cannot be overstated. Every pattern in this guide includes historical win rates and expected value metrics because trading without data is gambling. Modern traders have access to decades of backtested performance data, use it to make informed decisions rather than relying on gut feelings or pattern recognition alone.
Building patterns into your daily trading routine requires the right tools and workflow. Manual scanning doesn't scale, and you'll miss most opportunities while analyzing charts one by one. Successful pattern traders in 2026 use automated scanning platforms that identify setups in real-time and deliver alerts with context and performance data. Check out our guide on building an efficient trading workflow to optimize your setup.
ChartMath scans 200+ technical setups including all 15 chart patterns covered in this guide, delivering real-time alerts with backtested win rates and plain-English explanations directly to your phone. No more refreshing screeners, no more missed breakouts, no more guessing which patterns actually work. The platform combines automated pattern recognition with historical performance data, giving you the edge you need to trade chart patterns profitably and consistently. Watch the demo to see how ChartMath transforms chart pattern trading from manual guesswork into a systematic, data-driven process. Start trading chart patterns with confidence today.

Ankush Jindal
LinkedInSee these setups live in ChartMath
200+ curated screens with backtest data. First month $1.