How to Use Stock Screeners for Day Trading in 2026

You've refreshed your screener for the 47th time today. You're manually scanning through hundreds of charts, trying to catch that perfect momentum setup before it runs without you. Meanwhile, three high-probability trades just triggered on stocks you weren't even watching.
If this sounds familiar, you're not alone. Day traders face an impossible challenge: monitoring thousands of stocks across multiple timeframes while executing trades in real-time. The solution isn't working harder or staring at more screens. It's learning how to use stock screeners effectively to automate the discovery process and surface only the setups that match your proven strategies.
This complete guide walks you through the entire process of setting up and using stock screeners for day trading in 2026. You'll learn how to configure real-time scanning parameters, interpret technical signals like ORB and VWAP, set up custom alerts that cut through the noise, and leverage backtest data to validate your trading decisions before risking capital.
Why Setting Up a Stock Screener Matters for Day Trading
If you're still picking the tool itself, our comparison of the best real-time stock scanner for day trading is the better starting point — this guide assumes you've chosen one and need to set it up.
The modern stock market presents day traders with an overwhelming amount of information. With over 5,000 publicly traded stocks on U.S. exchanges alone, manually monitoring even a fraction of potential opportunities is physically impossible. By the time you've scanned through your watchlist, the best setups have already moved.
Stock screeners solve this fundamental problem by continuously monitoring the entire market and alerting you only when stocks meet your specific technical criteria. Instead of hunting for trades, the trades come to you, ranked by quality and freshness based on proven patterns.
The difference between manual scanning and automated screening is dramatic. Manual scanning requires constant attention, creates decision fatigue, and inevitably leads to missed opportunities. You might catch 10-15 setups per day if you're glued to your screens. Automated stock screeners evaluate thousands of stocks every second across multiple timeframes, surfacing 50-100+ qualified setups that match your exact parameters.
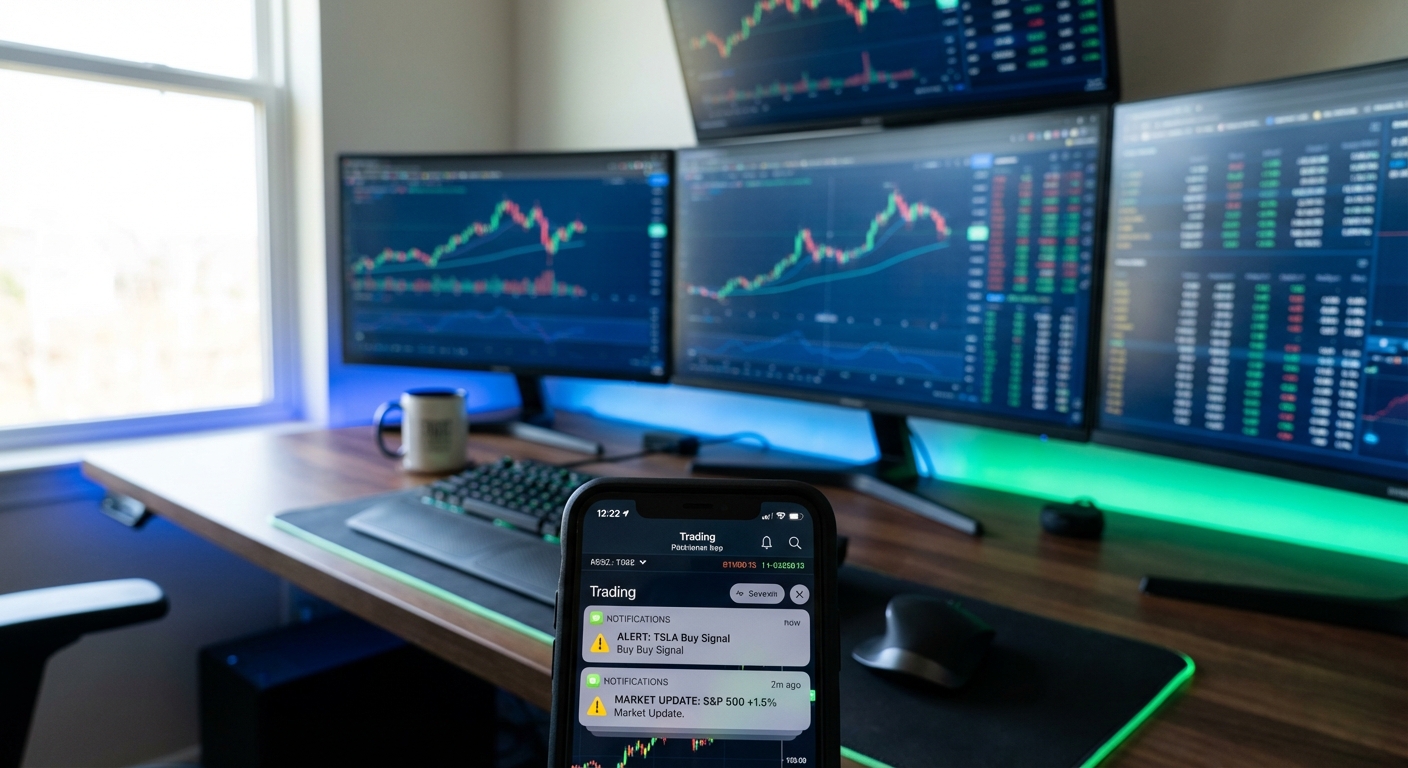
Consider a typical scenario: You're in a meeting from 10:00 AM to 11:00 AM EST, right during the most volatile trading hours. Without a screener, you miss the opening range breakout on a stock that runs 15% in 30 minutes. With a properly configured screener, you receive a real-time alert the moment the setup triggers, complete with context about why it matters and historical data showing similar setups have a 68% win rate.
This isn't about replacing your analysis or charting platform. Stock screeners work as a companion tool that handles the discovery and monitoring process, freeing you to focus on execution and risk management. Your charting software remains essential for detailed technical analysis, but the screener ensures you're analyzing the right stocks at the right time.
Step 1: Pick a Screener That Matches Your Day-Trading Style
Not all stock screeners are created equal, and choosing the wrong platform can actually hurt your trading performance. The first step in learning how to use stock screeners effectively is selecting one that matches your specific trading style and technical requirements.
For day traders, real-time scanning capability is non-negotiable. Many popular screeners like Finviz offer excellent fundamental and technical filters, but they primarily provide end-of-day data that requires manual refreshing. By the time you refresh and spot a setup, the opportunity has often passed. Day trading demands second-by-second market evaluation with instant alerts when conditions align.
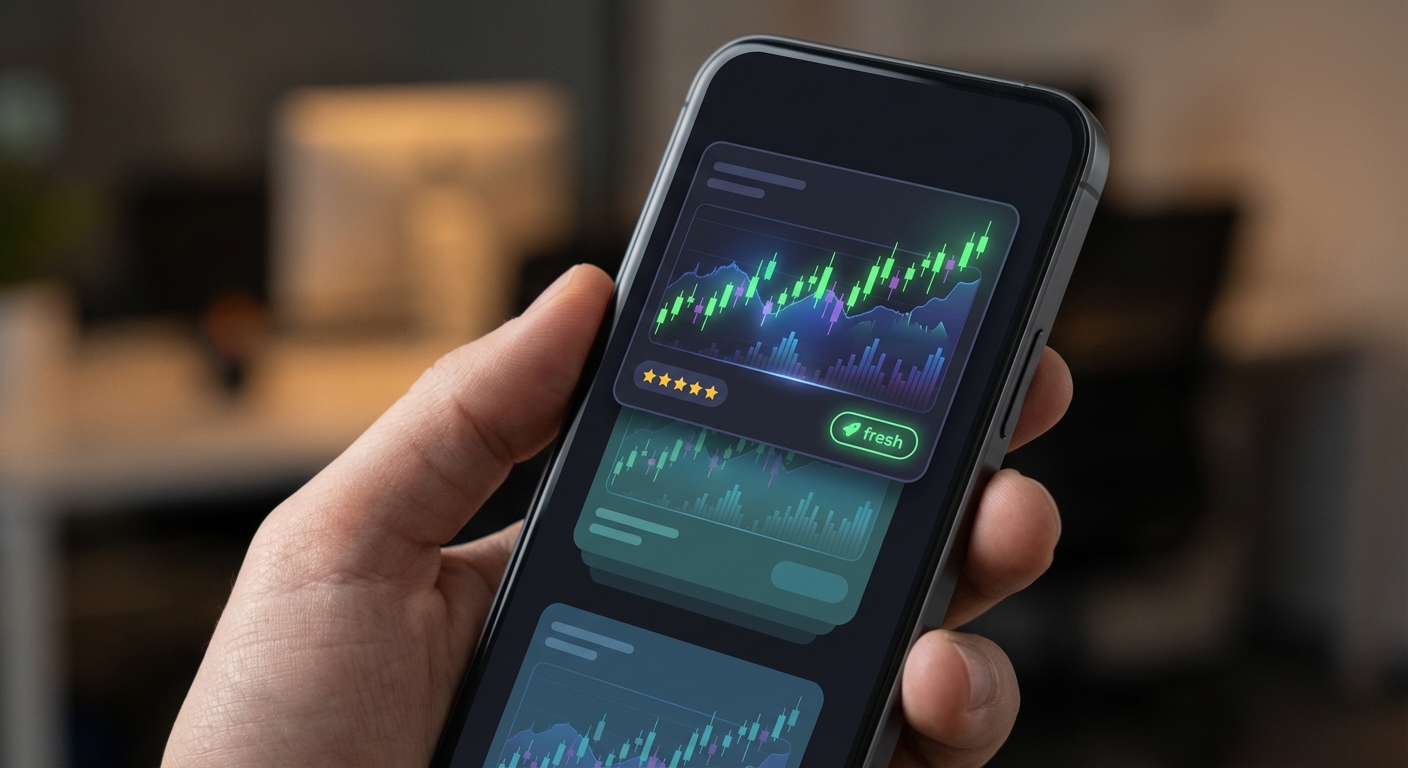
The platform interface matters more than most traders realize. Desktop-focused screeners require you to be stationed at your computer throughout the trading session. If you need to step away, attend a meeting, or simply want the flexibility to monitor markets while mobile, a mobile-first platform becomes essential. Modern screeners designed for mobile use offer swipeable interfaces similar to social media apps, making it easy to quickly evaluate and dismiss opportunities on the go.
Another critical consideration is whether the screener requires coding knowledge. Platforms like TradingView offer incredible customization through Pine Script, but this creates a steep learning curve for traders who want to focus on trading rather than programming. Pre-built technical screens covering proven setups like ORB, VWAP reclaims, and RVOL spikes allow you to start screening immediately without writing a single line of code.
Perhaps most importantly, look for screeners that provide backtest data alongside each signal. Knowing that a particular setup has historically produced a 65% win rate with a 2:1 reward-to-risk ratio transforms a simple alert into an informed trading decision. Without this context, you're essentially trading blind, hoping that the technical pattern will play out without any statistical evidence.
For day traders specifically, prioritize platforms that offer multi-timeframe analysis across 1-minute, 5-minute, and 15-minute charts. Swing traders can work with daily and weekly timeframes, but intraday trading requires granular timeframe options to catch scalps and momentum plays as they develop.
Step 2: Configure Your Core Technical Scanning Parameters
Once you've selected a screener platform, the next step is configuring your core scanning parameters. This is where many traders either over-complicate the process with too many filters or under-optimize by casting too wide a net. The goal is finding the balance that surfaces high-probability setups without overwhelming you with alerts.
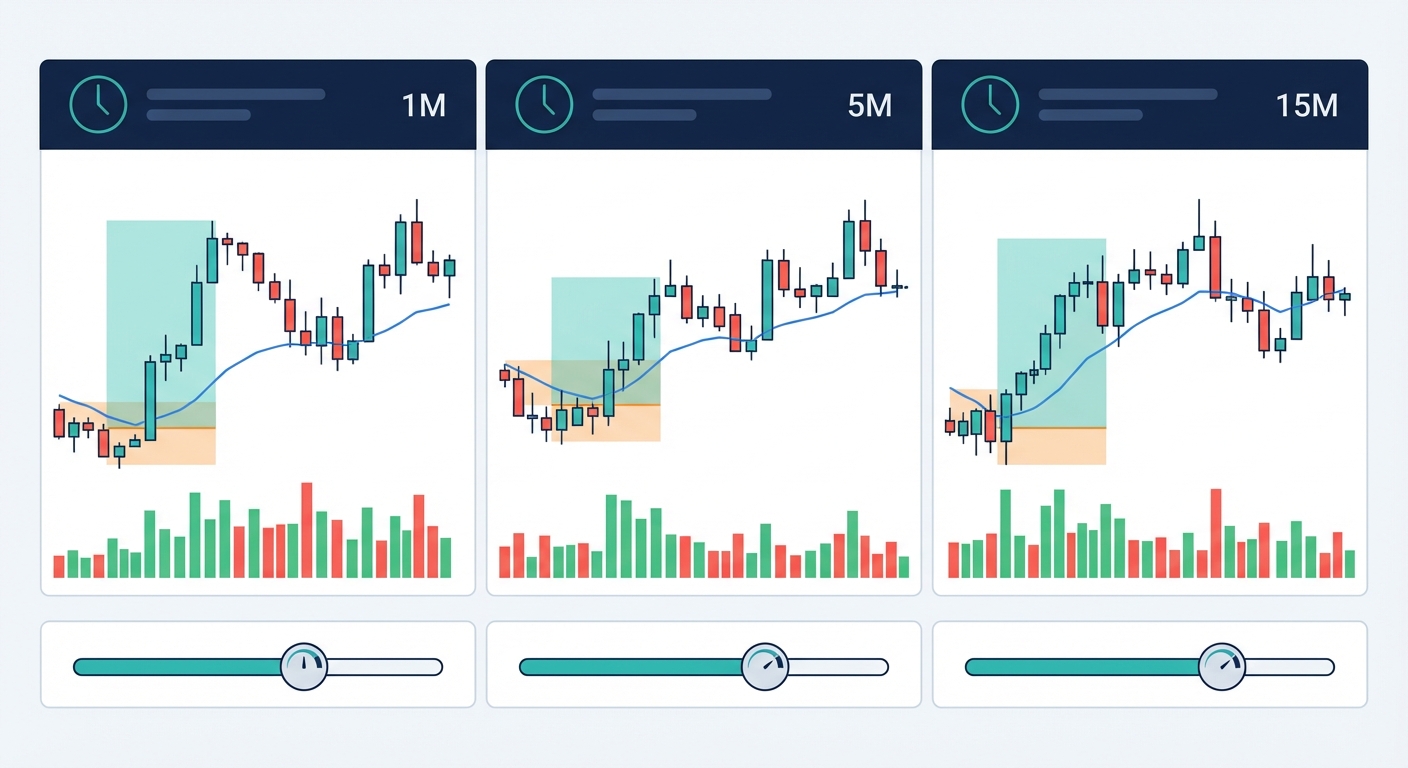
Start with timeframe configuration. For active day traders executing scalps and momentum plays throughout the session, focus on 1-minute, 5-minute, and 15-minute timeframes. The 1-minute chart catches the fastest moves but generates more noise. The 5-minute chart offers a sweet spot for most intraday setups, providing enough data points to confirm patterns without excessive lag. The 15-minute chart helps identify larger intraday trends and reduces false signals.
Your technical indicator selection should focus on proven patterns with statistical edges. The three most essential indicators for day trading stock screeners are:
- Opening Range Breakout (ORB): Identifies stocks breaking above or below the first 5, 15, or 30 minutes of trading range. ORB setups capitalize on early momentum and often lead to sustained moves throughout the session.
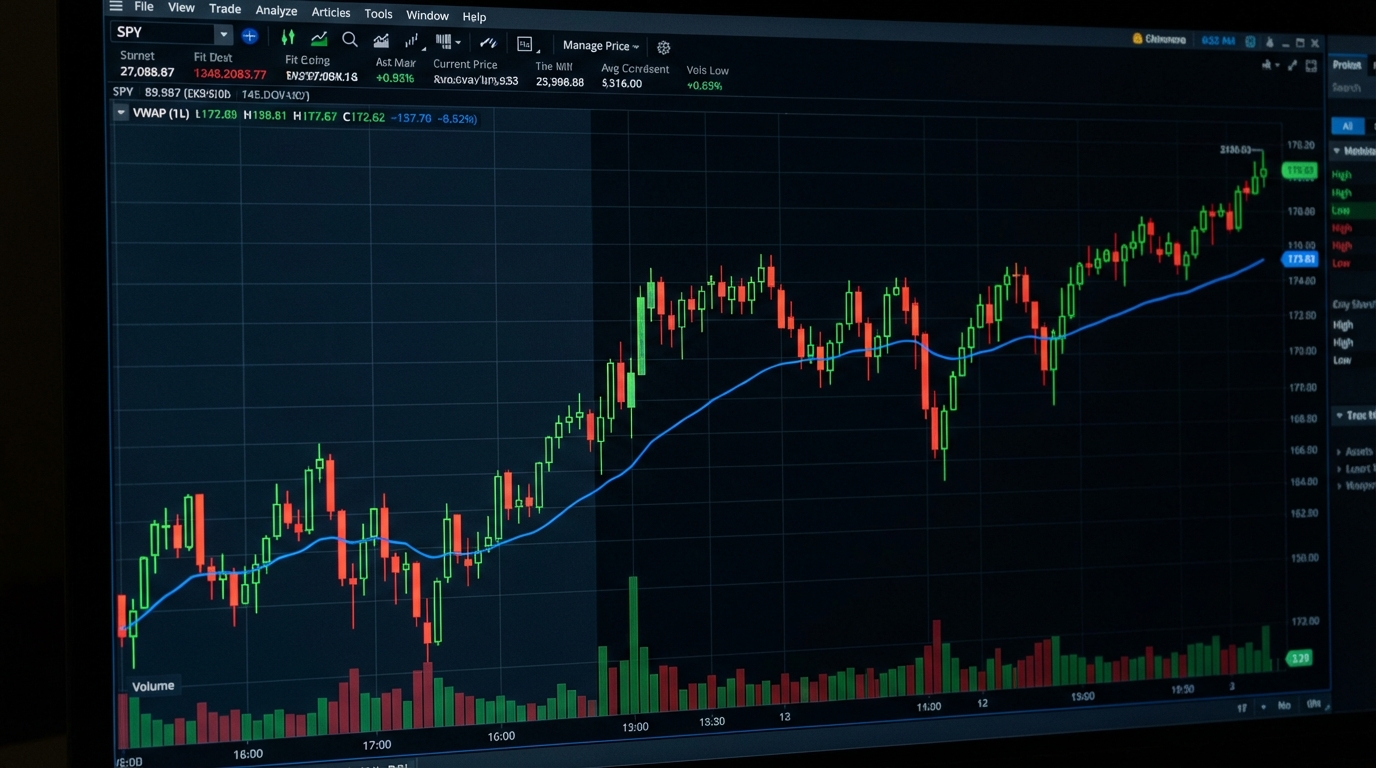
- VWAP (Volume Weighted Average Price): Tracks the average price weighted by volume. VWAP reclaims signal institutional buying interest, while rejections indicate selling pressure. Day traders use VWAP as a dynamic support/resistance level.
- Relative Volume (RVOL): Compares current volume to average volume at the same time of day. RVOL spikes above 2.0x indicate unusual activity and potential catalysts driving price movement.
Volume and liquidity filters are critical for ensuring the stocks your screener surfaces are actually tradeable. Set minimum average daily volume thresholds of at least 500,000 shares, preferably 1 million+ for larger accounts. Low-volume stocks create execution problems with wide bid-ask spreads and difficulty entering or exiting positions at desired prices.
Price range filters should align with your account size and risk management rules. If you're trading a $10,000 account with 2% risk per trade, screening for $200+ stocks limits your position sizing flexibility. Many day traders focus on stocks between $5 and $100, with the $10-$50 range offering the best combination of volatility and liquidity.
Volatility parameters help you find stocks with enough movement to generate profits without excessive risk. Look for stocks with an Average True Range (ATR) that provides at least 2-3% intraday movement. Too little volatility means limited profit potential; too much creates unpredictable price action that's difficult to trade consistently.
Understanding Key Technical Setups in Stock Screeners
To use stock screeners effectively, you need to understand what each technical setup actually signals and why it matters. Let's break down the core patterns that professional day traders rely on:
Opening Range Breakout (ORB) setups identify stocks that break above or below the high or low established in the first 5, 15, or 30 minutes of trading. The opening range represents the initial battle between buyers and sellers. When price breaks this range with strong volume, it signals that one side has won, often leading to continuation in the breakout direction. Configure your screener to alert on ORB breaks with RVOL above 1.5x to filter for setups with genuine momentum.
VWAP reclaim and rejection patterns provide insight into institutional activity. When a stock trades below VWAP and then reclaims it with increasing volume, it suggests institutional buyers are stepping in. Conversely, rejections at VWAP indicate selling pressure. The most powerful VWAP setups occur when price reclaims VWAP on the 5-minute chart while simultaneously holding above VWAP on the 15-minute chart, creating multi-timeframe confluence.
Relative Volume (RVOL) spikes signal unusual activity that often precedes significant price moves. An RVOL reading of 2.0x means the stock is trading at twice its normal volume for that time of day. This unusual activity typically stems from news catalysts, earnings reports, or institutional accumulation. When combined with technical breakouts, RVOL spikes dramatically increase the probability of sustained moves.
The most powerful screening approach combines multiple indicators. For example, a stock breaking its opening range, reclaiming VWAP, and showing 2.5x RVOL creates a high-probability setup with multiple confirming factors. This is where stock screeners truly shine—identifying these multi-condition setups across thousands of stocks simultaneously.
Step 3: Configure Custom Alerts That Actually Matter
Alert fatigue is one of the biggest problems traders face when learning how to use stock screeners. Receiving 200 notifications per day trains you to ignore alerts entirely, defeating the purpose of automated scanning. The solution is configuring custom alerts with quality filters that surface only the setups worth your attention.
Start by implementing multi-condition alerts that require several criteria to align before triggering. Instead of alerting on every VWAP reclaim, configure your screener to alert only when a stock reclaims VWAP with RVOL above 2.0x and price above the opening range high. This single change can reduce alerts by 70% while increasing the quality of each signal.
Quality filtering should incorporate backtest performance data when available. If your screener provides historical win rates for different setups, configure alerts to trigger only for patterns with at least 60% historical win rates and positive expected value per trade. This data-driven approach ensures you're focusing on statistically proven setups rather than random technical patterns.
Alert delivery methods matter for different trading styles. Push notifications work well for active traders who can respond immediately. Email alerts suit swing traders who check markets periodically throughout the day. SMS alerts provide the most reliable delivery but should be reserved for only the highest-quality setups to avoid overwhelming your phone.
Creating watchlist-specific alerts allows you to monitor favorite stocks with different parameters than your general market scans. You might screen the entire market for extreme setups with RVOL above 3.0x, while monitoring your core watchlist for any VWAP reclaim above 1.5x RVOL. This tiered approach ensures you never miss opportunities in stocks you know well while still discovering new setups in the broader market.
Consider implementing time-based filters to reduce noise during low-probability periods. Many day traders disable alerts during the first 5 minutes of market open when price action is chaotic and spreads are wide. Similarly, alerts during the lunch hour (12:00 PM - 1:30 PM EST) often produce lower-quality setups as volume dries up.
Step 4: Interpret Screening Results and Prioritize Opportunities
When your screener surfaces 50 potential setups, how do you decide which ones to trade? Learning to interpret screening results and prioritize opportunities separates profitable traders from those who chase every alert.
The most effective stock screeners rank setups by quality and freshness. Quality metrics incorporate factors like backtest win rate, current RVOL, multi-timeframe alignment, and how cleanly the technical pattern formed. Freshness indicates how recently the setup triggered—a VWAP reclaim that happened 30 seconds ago is more actionable than one from 15 minutes ago that may have already run.
Reading backtest data correctly is crucial for informed decision-making. When evaluating a screened setup, look at three key metrics:
- Win Rate: The percentage of historical trades that were profitable. A 65% win rate means 65 out of 100 similar setups resulted in gains. Aim for setups with at least 55-60% win rates.
- Expected Value (EV) per Trade: The average profit or loss per trade after accounting for wins and losses. A setup with a 55% win rate but 3:1 reward-to-risk ratio can have higher EV than a 70% win rate setup with 1:1 reward-to-risk.
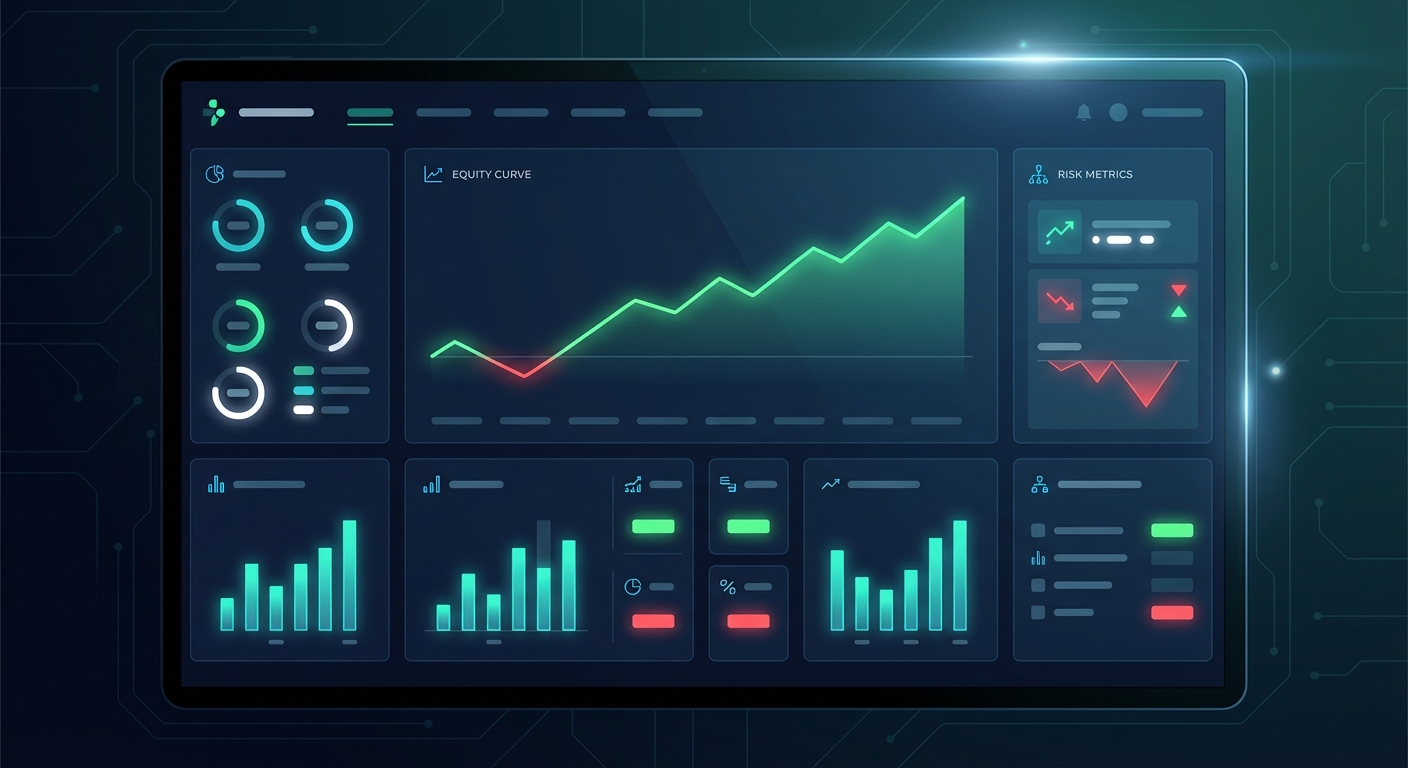
- Maximum Drawdown: The largest peak-to-trough decline in the strategy's equity curve. This tells you the worst-case scenario you might experience trading this setup consistently.
Understanding why a signal triggered is just as important as knowing that it triggered. The best stock screeners provide plain-English explanations like "XYZ broke above the 15-minute opening range high with 2.8x relative volume while reclaiming VWAP." This context helps you quickly assess whether the setup aligns with your trading strategy and current market conditions.
Multi-timeframe alignment dramatically increases setup reliability. When a stock shows bullish signals across multiple timeframes—for example, above VWAP on the 5-minute, 15-minute, and 1-hour charts, the probability of continuation increases significantly. Prioritize setups with timeframe confluence over single-timeframe signals.
Look for confluence between multiple technical indicators within your screening results. A stock breaking out of a consolidation pattern while simultaneously reclaiming VWAP and showing RVOL expansion creates a higher-probability setup than any single indicator alone. The more confirming factors present, the more conviction you can have in the trade.
Step 5: Integrate Your Screener Into a Real Trading Workflow
Knowing how to use stock screeners technically is only half the battle. The real edge comes from integrating screening into a systematic trading workflow that maximizes efficiency and consistency.
Your pre-market routine should begin with screening for gappers and potential ORB candidates. Before the market opens, identify stocks gapping up or down on news or earnings with strong pre-market volume. These stocks often provide the best intraday opportunities as they establish opening ranges and either continue their gap direction or reverse. Create a focused watchlist of 5-10 pre-market standouts to monitor closely during the first hour of trading.
During the trading session, use your screener for real-time intraday monitoring rather than constant manual scanning. Let the screener run in the background, alerting you when new setups form. This allows you to focus on managing open positions and analyzing the stocks your screener surfaces rather than hunting through charts. Check your screener feed every 15-30 minutes to review new opportunities, but avoid obsessively refreshing, trust your alert configuration to notify you of urgent setups.
Stock screeners work best as a companion to your charting platform, not a replacement. When your screener alerts you to a setup, immediately pull up the stock in your primary charting software for detailed analysis. Verify the pattern, check for nearby support and resistance levels, assess the overall trend, and plan your entry, stop-loss, and profit target. The screener discovers opportunities; your charting platform helps you execute them properly.
Implement a multi-timeframe analysis workflow by checking at least two timeframes before entering any trade. If your screener alerts on a 5-minute VWAP reclaim, verify that the 15-minute chart also shows bullish structure. This simple habit filters out many false signals and increases your win rate significantly.
Your end-of-day routine should include reviewing screener performance and preparing watchlists for the next session. Which setups worked today? Which ones failed? Are there stocks that showed interesting patterns but didn't quite trigger your alerts? This daily review process helps you refine your screening parameters over time and builds pattern recognition skills.
Step 6: Use Backtest Data to Validate Your Setups
One of the most powerful features of modern stock screeners is access to backtest data that shows how similar setups have performed historically. Learning to leverage this data transforms screening from guesswork into evidence-based trading.
Backtest data matters because it provides statistical evidence for your trading decisions. Instead of taking a trade based solely on a technical pattern you think looks good, you can see that this exact setup has produced a 68% win rate over the past 500 occurrences with an average gain of 2.3% and average loss of 1.1%. This information allows you to trade with confidence and size positions appropriately.
When evaluating backtest metrics, focus on these key performance indicators:
- Win Rate: Higher is better, but anything above 55% is tradeable with proper risk management. Be skeptical of win rates above 80%—they often indicate curve-fitting or cherry-picked data.
- Average Gain vs. Average Loss: Your average winner should be larger than your average loser. A 2:1 or 3:1 reward-to-risk ratio allows you to be profitable even with a 50% win rate.
- Maximum Drawdown: This tells you the worst losing streak the strategy has experienced. If the max drawdown is 25%, you need sufficient capital and risk management to survive a similar drawdown in the future.
- Sample Size: Backtest data based on 500+ occurrences is more reliable than data from 50 occurrences. Larger sample sizes reduce the impact of outliers and provide more confidence in the statistics.
Use historical performance data to size your positions appropriately. If a setup has a 65% win rate with 2:1 reward-to-risk and a maximum drawdown of 15%, you can trade it more aggressively than a setup with a 52% win rate and 1.5:1 reward-to-risk. Position sizing based on edge is one of the most overlooked aspects of profitable trading.
Avoid setups with poor risk/reward profiles even if they have decent win rates. A setup with a 70% win rate but 1:1 reward-to-risk ratio is less profitable long-term than a 55% win rate setup with 3:1 reward-to-risk. The math is simple: the first setup nets 40% over 100 trades (70 wins - 30 losses), while the second nets 95% (55 wins × 3 - 45 losses).
Remember that backtest data shows historical performance, not guaranteed future results. Market conditions change, and strategies that worked well in 2024 may perform differently in 2026. Combine backtest data with current market regime analysis, is the market trending or choppy? High or low volatility? Backtest data provides the foundation, but you must adapt to current conditions.
Common Stock Screener Mistakes Day Traders Make
Even experienced traders make critical mistakes when learning how to use stock screeners effectively. Avoiding these common pitfalls will accelerate your progress and improve your results.
Over-optimizing parameters and curve-fitting is perhaps the most dangerous mistake. It's tempting to tweak your screening parameters until they perfectly match the best trades from the past week. This creates a screener that would have been perfect for last week's market but fails in real-time trading. Keep your parameters simple and based on sound technical principles rather than optimizing for past results.
Ignoring volume and liquidity requirements leads to alerts on stocks that are impossible to trade profitably. A perfect technical setup on a stock with 50,000 daily volume and a $0.20 bid-ask spread will cost you more in slippage than you can make on the trade. Always maintain minimum volume filters of 500,000+ shares daily.
Chasing every alert without quality filtering creates decision fatigue and poor execution. If your screener generates 100 alerts per day, you're not filtering aggressively enough. Most traders can realistically evaluate and execute 5-10 high-quality setups per day. Configure your screener to surface only the best opportunities rather than every possible setup.
Failing to account for market regime changes causes strategies to underperform. A breakout-focused screener that works beautifully in trending markets will generate excessive false signals in choppy, range-bound conditions. Monitor overall market conditions (SPY, QQQ, VIX) and adjust your screening parameters or take fewer trades when conditions don't favor your setups.
Not tracking and reviewing screener performance prevents improvement. Keep a trading journal that records which screened setups you traded, the results, and why you took or passed on each opportunity. This data reveals patterns, perhaps VWAP reclaims work better for you than ORB setups, or maybe your win rate is higher on stocks above $20. Use this information to refine your screening parameters over time.
Advanced Stock Screener Techniques for Experienced Traders
Once you've mastered the basics of how to use stock screeners, these advanced techniques can further enhance your trading performance and edge in the market.
Multi-timeframe confluence screening identifies setups where multiple timeframes align in the same direction. Configure your screener to alert only when a stock shows bullish signals on both the 5-minute and 15-minute charts simultaneously, for example, above VWAP on both timeframes with increasing RVOL. These setups have significantly higher win rates than single-timeframe signals.
Sector and market correlation filters help you trade with the overall market flow. When the S&P 500 is rallying strongly, focus your screener on long setups in leading sectors. When the market is selling off, either focus on short setups or stay flat. Some advanced screeners allow you to filter for stocks showing relative strength (outperforming their sector) or relative weakness (underperforming), which often leads to the strongest moves.
Combining fundamental and technical screens creates a powerful hybrid approach. Screen first for stocks with strong fundamentals (earnings growth, revenue growth, institutional ownership) and then apply technical filters to time entries. This approach works particularly well for swing traders who hold positions for multiple days and want both fundamental support and technical confirmation.
Creating custom watchlists for different strategies allows you to apply specialized screening parameters to specific stock universes. You might maintain one watchlist of high-momentum small-caps for aggressive scalping, another watchlist of large-cap tech stocks for VWAP strategies, and a third watchlist of recent IPOs for breakout plays. Each watchlist can have unique alert parameters optimized for that stock type.
Using stock screeners for options trading setups opens additional opportunities. Screen for stocks making significant technical moves (ORB breaks, VWAP reclaims with high RVOL) and then evaluate options strategies to capitalize on the expected continuation. A stock breaking out with strong volume might be a candidate for call options or call spreads, while a stock breaking down could signal put opportunities.
Start Using Stock Screeners to Find Better Day Trading Opportunities
Learning how to use stock screeners effectively transforms day trading from a chaotic, overwhelming process into a systematic, repeatable approach. Instead of manually scanning hundreds of charts and missing opportunities while away from your desk, you leverage technology to continuously monitor the entire market and surface only the highest-probability setups that match your proven strategies.
The complete setup process we've covered, choosing the right platform, configuring technical parameters, setting up quality-filtered alerts, interpreting results with backtest data, and integrating screening into your daily workflow, provides a framework that works whether you're a beginner or experienced trader. The key is starting simple, tracking your results, and refining your approach based on real performance data.
Modern stock screeners eliminate the manual scanning that consumed hours of your day while delivering better results. Real-time scanning across thousands of stocks, multi-timeframe analysis, backtest validation, and mobile accessibility create a competitive advantage that wasn't available to retail traders just a few years ago.
The difference between struggling to find trades and having high-quality opportunities delivered to you throughout the session comes down to proper screener configuration and integration into your workflow. Stock screeners don't replace your trading skills or market knowledge, they amplify them by ensuring you're always analyzing the right stocks at the right time.
If you're ready to stop missing trades and start discovering high-probability setups with real-time alerts and backtest validation, watch a demo of ChartMath to see how a mobile-first screening platform with 200+ curated technical screens can transform your day trading approach. The platform's TikTok-style interface delivers ranked opportunities with plain-English explanations and historical performance data, helping you make informed trading decisions without coding knowledge or constant manual scanning.
Start using stock screeners strategically, and you'll wonder how you ever traded without them. The market moves fast, make sure you're seeing the opportunities that matter most to your trading strategy.

Ankush Jindal
LinkedInSee these setups live in ChartMath
200+ curated screens with backtest data. 14-day free trial.