How to Build the Ultimate Trading Workflow with ChartMath
You've got TradingView open on two monitors. TrendSpider is running its automated analysis in the background. Your watchlist has 40 tickers on it. And somehow, you still missed the ORB breakout on the one stock that moved 8% before lunch. Sound familiar? The problem isn't your charting platform. The problem is your trading workflow has a blind spot — and it's costing you entries every single day.
This guide walks you through how to build a smarter trading workflow by adding ChartMath as a real-time trade discovery layer alongside the charting tools you already use. You'll learn how to set up push alerts that actually explain themselves, sync watchlists across platforms, and use 200+ pre-built screens to surface high-quality setups — without replacing TradingView, TrendSpider, or anything else you love.
Why Your Trading Workflow Has a Blind Spot
Most traders have invested serious time (and money) into their charting platforms. TradingView is excellent for drawing, annotating, and running custom indicators. TrendSpider is powerful for automated trendline detection and multi-timeframe analysis. These are genuinely great tools. But here's the thing: they're reactive. They analyze stocks you're already watching. They don't go out and find new opportunities for you.
That's the blind spot. Your trading workflow depends on you manually scanning, refreshing screeners, and somehow watching 40 tickers at once. You've probably refreshed Finviz more times today than you'd like to admit. And when you step away from your desk for 20 minutes, you come back to find the setup you'd been watching all morning already triggered and ran without you.
The three biggest gaps in most traders' workflows are:
- No proactive discovery layer: Your tools analyze what you give them. They don't scan the entire market for you in real time.
- Alert fatigue: Platforms that send 200 notifications a day with no context train you to ignore alerts entirely.
- Desktop dependency: Most scanning tools are web-only. The moment you leave your desk, your edge disappears.
The fix isn't to abandon your charting platform. It's to add a dedicated trade discovery layer that works for you, even when you're not watching. That's exactly what a two-layer trading workflow does.
What a Two-Layer Trading Workflow Looks Like
Think of your trading workflow in two distinct layers, each with a specific job.
Layer 1, Trade Discovery (ChartMath): This layer runs continuously in the background, scanning the entire market across 200+ pre-built technical screens. When a stock matches a proven setup, an ORB break, a VWAP reclaim, an RVOL spike, ChartMath sends you a push alert with a plain-English explanation of why it triggered and backtest data showing the historical edge behind the pattern. You don't have to be watching. You don't have to be at your desk.
Layer 2, Trade Execution and Analysis (TradingView, TrendSpider, etc.): Once ChartMath surfaces a setup, you pull up the chart on your primary platform to confirm the entry, draw your levels, and execute the trade. This is where your existing skills and tools shine.
The two layers don't overlap. ChartMath doesn't try to replace your charting platform, and your charting platform doesn't try to scan the whole market for you. Each tool does what it's best at. The result is a trading workflow that's faster, more consistent, and far less exhausting. For a deeper look at structuring your day around this approach, check out How to Build an Efficient Trading Workflow in 2026.
1. Set Up ChartMath as Your Real-Time Trade Discovery Engine
The first step in upgrading your trading workflow is getting ChartMath installed and configured. The platform is built mobile-first, which means the full experience lives on your phone, not locked behind a desktop browser. Download the ChartMath app and you'll find three core discovery modes waiting for you.
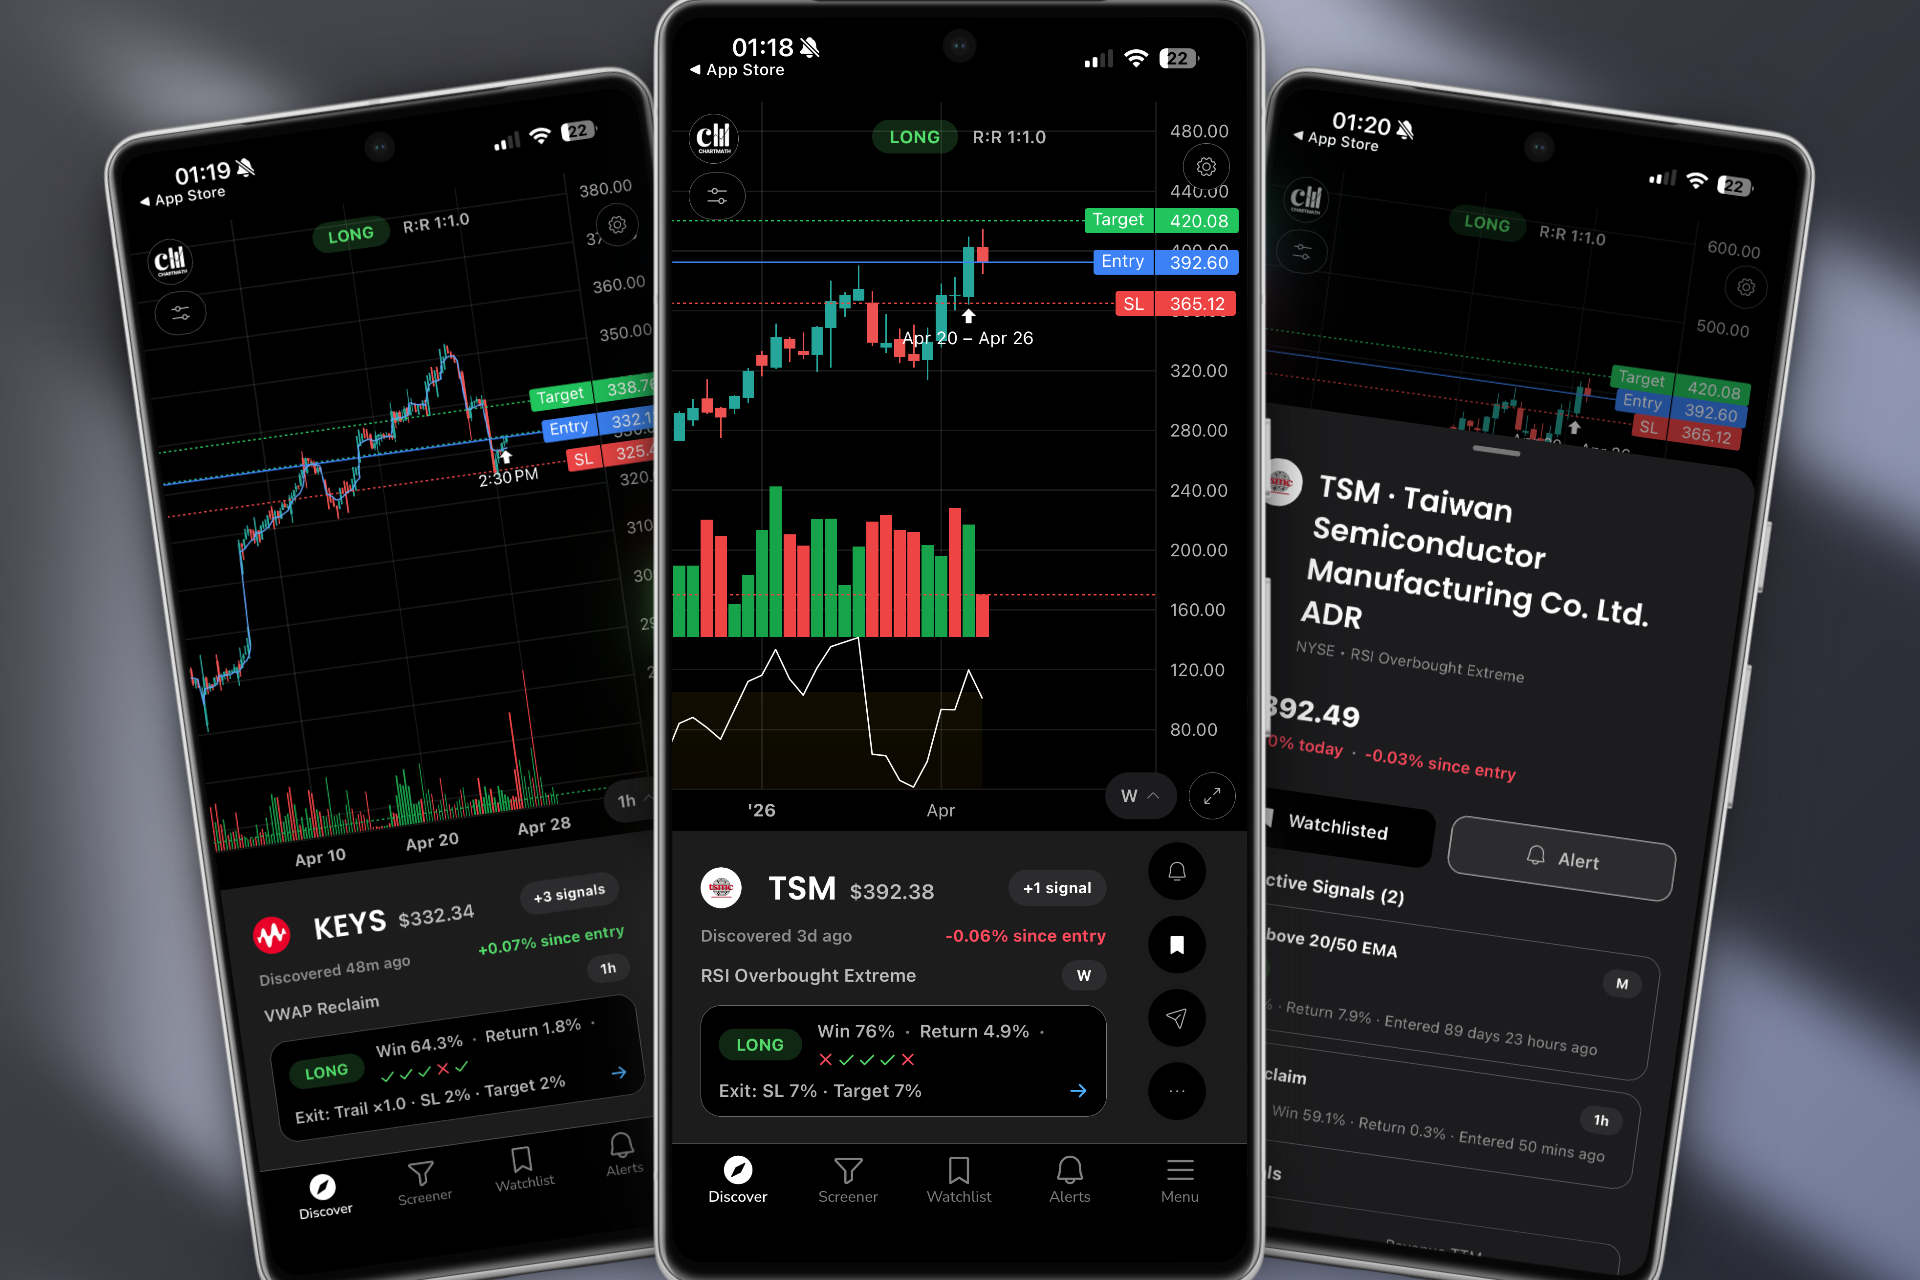
The Discover Tab
This is your ranked feed of live setups across the entire market, updated in real time. Think of it like a TikTok-style swipe interface for trade ideas. Each card shows the ticker, the setup that triggered, the timeframe, and a quick summary of the backtest performance. You can swipe through setups quickly, save the ones you like to your watchlist, and skip the ones that don't fit your style. It's the fastest way to see what's moving and why, without manually scanning a single chart.
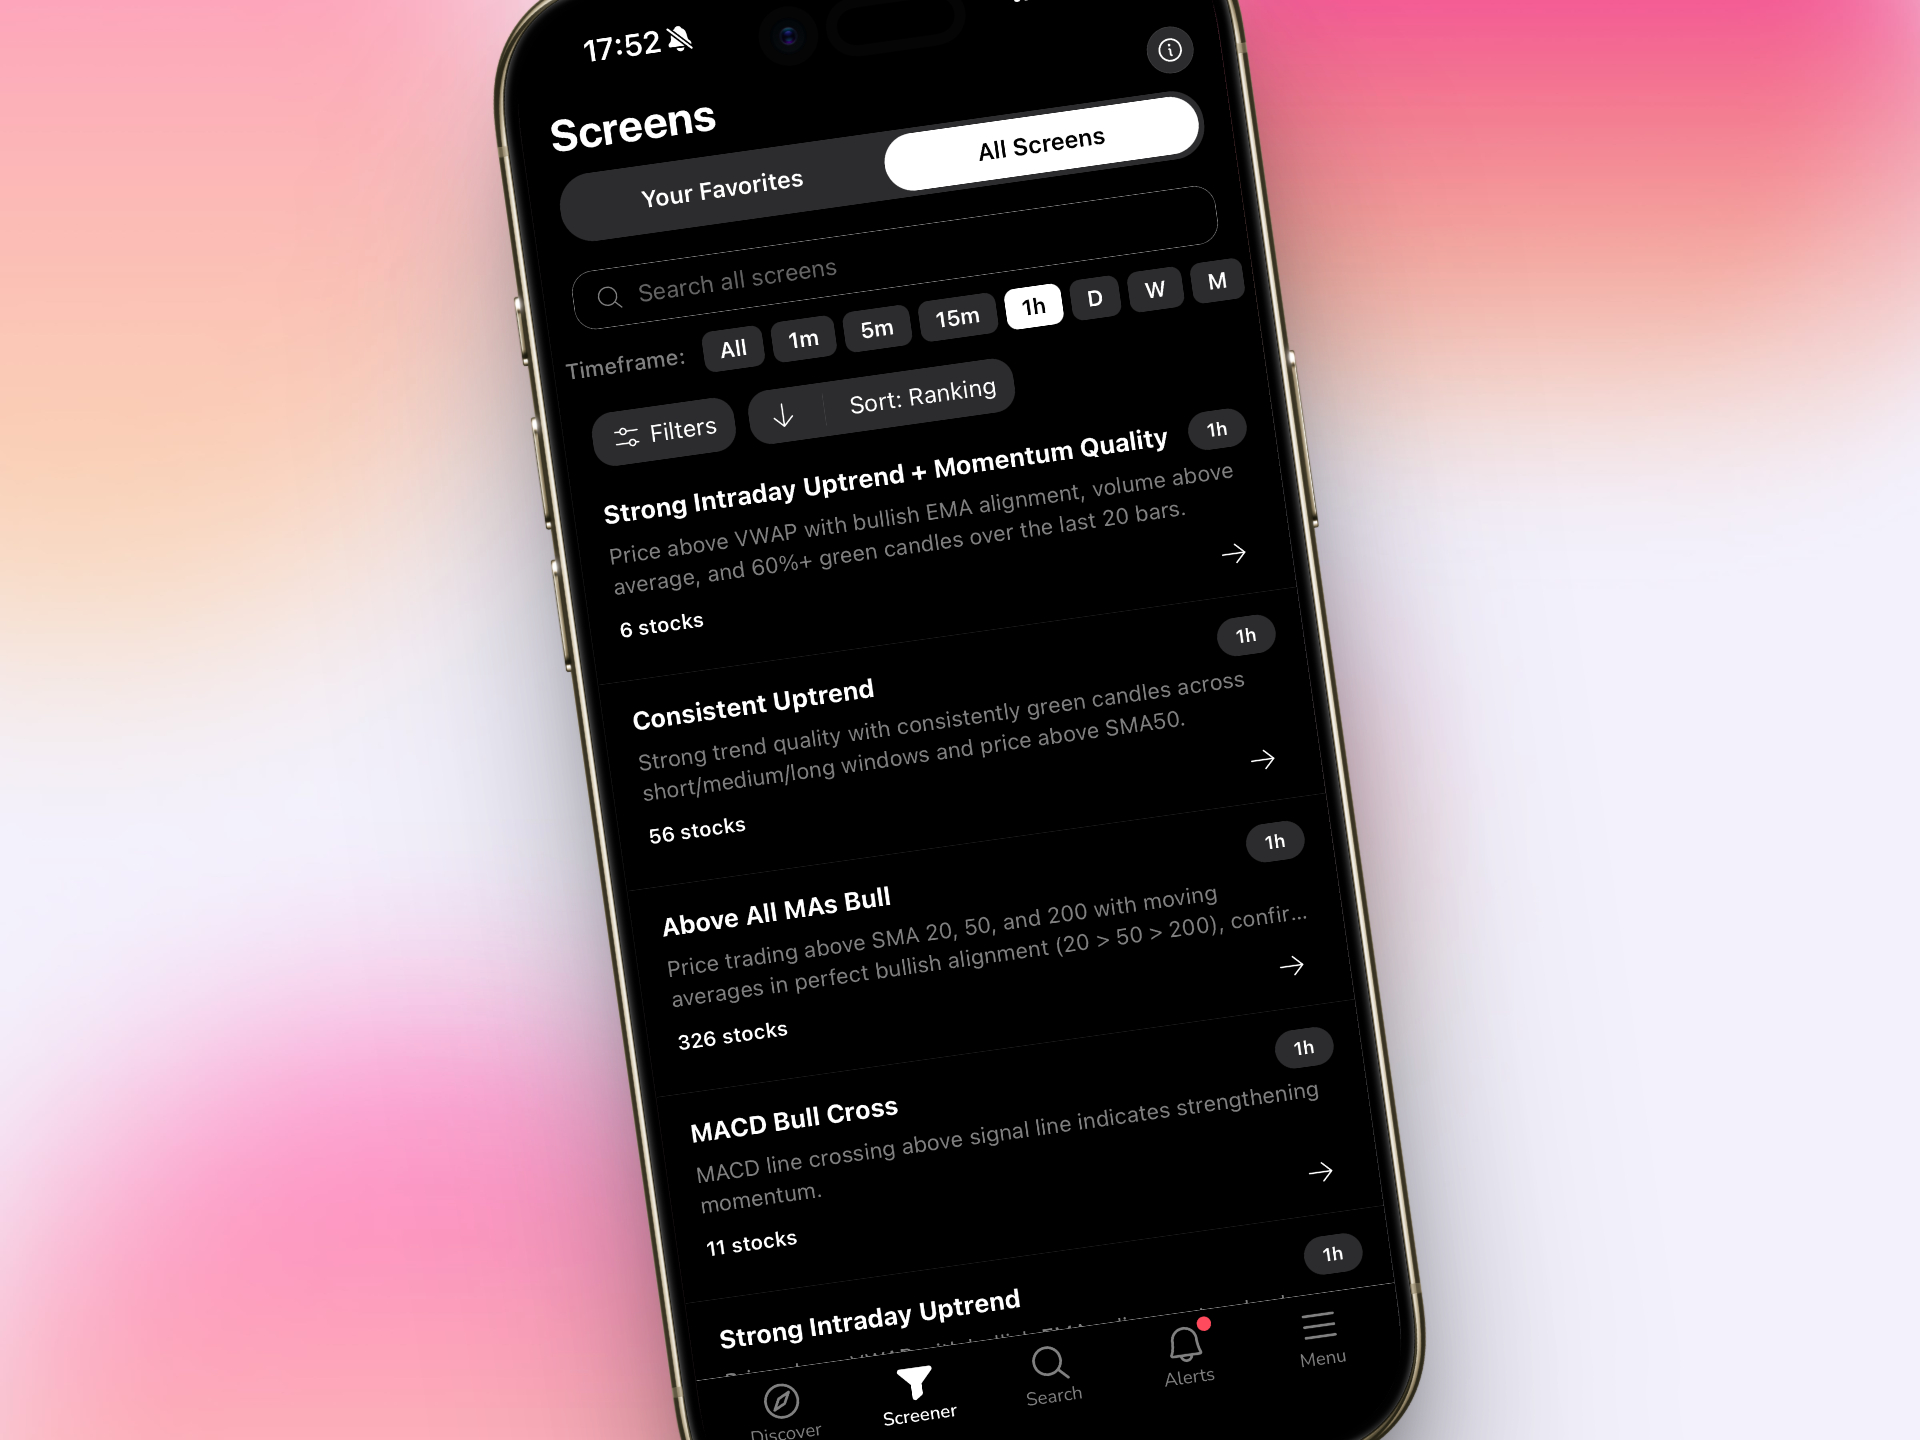
The Screener Tab
If you prefer to filter by strategy, the Screener tab lets you browse ChartMath's 200+ pre-built screens organized by setup type. Looking for ORB breakouts on the 5-minute chart? There's a screen for that. Want VWAP reclaims with above-average relative volume? Covered. Momentum divergences on the daily chart for swing setups? Also covered. No Pine Script. No custom coding. Just select the screens that match your trading workflow and let ChartMath do the scanning. For more on how to use screeners effectively, see How to Use Stock Screeners for Day Trading in 2026.
The Watchlist Tab
Once you've identified tickers you want to track, add them to your ChartMath watchlist. The platform will monitor those specific stocks across all 200+ screens and notify you the moment any of them trigger a setup. This is especially powerful for swing traders who've already done their weekend research and want to be alerted when their setups are ready to execute during the week.
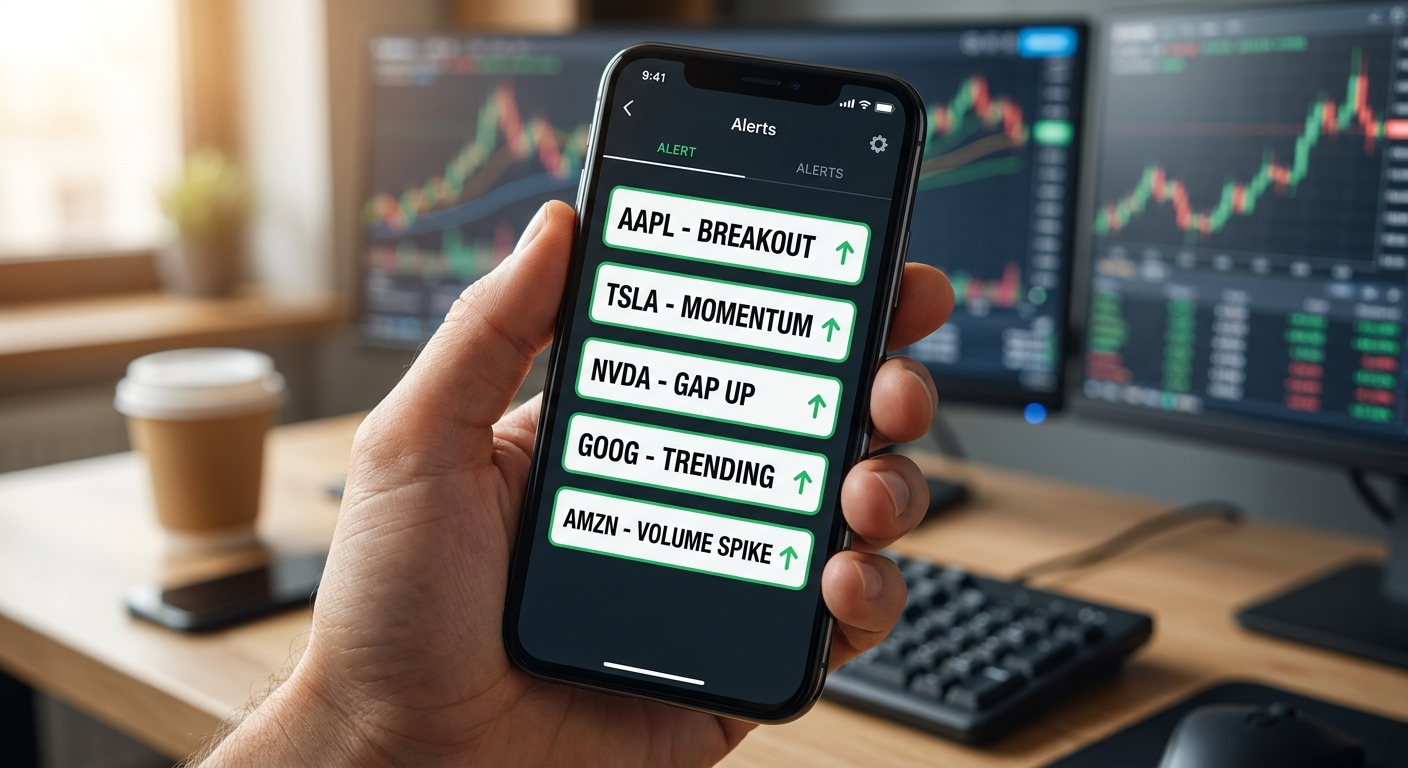
2. Configure Push Alerts That Actually Mean Something
Most traders have a complicated relationship with alerts. Either they've turned them all off because of the noise, or they're drowning in notifications that say nothing useful. ChartMath takes a different approach: every alert includes a plain-English explanation of why the setup triggered and what the historical edge looks like. That context is what separates a useful alert from noise.
Choosing the Right Screens for Your Style
Your alert configuration should match your trading workflow and trading style. Here's a practical starting point:
- Day traders: Enable alerts for ORB breaks (5m and 15m), VWAP reclaims, and RVOL spikes on 1m, 5m, and 15m timeframes. These are the setups that move fast and reward traders who catch them early. Learn more about these setups in our guide to VWAP vs RVOL vs ORB: Which Technical Indicators Work Best?
- Swing traders: Focus on daily and weekly timeframe screens, 52-week high breakouts, momentum divergences, and volume-confirmed trend continuations. End-of-day signals give you time to review setups on your own schedule before the next open.
- Beginners: Start with a small set of high-probability screens (3 to 5 maximum) and read every alert explanation carefully. The plain-English descriptions are essentially a real-time education in technical analysis.
Quality Over Quantity
The goal of a great trading workflow is fewer, better decisions, not more information. Resist the urge to enable every screen at once. Start with the setups that match your strategy, review the backtest win rates and average returns for each screen, and only add more alerts once you've built confidence in the ones you're already using. ChartMath's backtest data makes this easy: you can see the historical performance of every screen before you commit to trading it. For a deeper dive into backtesting, see How to Build Winning Backtesting Strategies: A Complete Guide.
Multi-Timeframe Alert Setup
One of the most powerful features in ChartMath is multi-timeframe analysis. You can configure alerts across different timeframes simultaneously, so a stock showing strength on the 5-minute chart and the daily chart gets flagged with higher priority. This kind of confluence is exactly what separates high-probability setups from random noise in your trading workflow.
3. Sync Your Watchlist Across ChartMath and Your Charting Platform
Here's where the two-layer trading workflow really starts to click. Once ChartMath surfaces a setup through the Screener or Discover tab, you have two options: act on it immediately, or add it to your watchlist for monitoring. For most traders, the watchlist becomes the bridge between discovery and execution.
The practical process looks like this:
- Morning scan (5 minutes): Open ChartMath's Screener tab and review overnight and premarket setups. Add any tickers that look promising to your ChartMath watchlist. For premarket-specific strategies, see Premarket Trading: 7 Strategies to Find High-Probability Setups.
- Sync to your charting platform: Manually add those same tickers to a watchlist in TradingView or TrendSpider. This takes about 60 seconds and ensures your charting platform is pre-loaded with the stocks most likely to set up during the session.
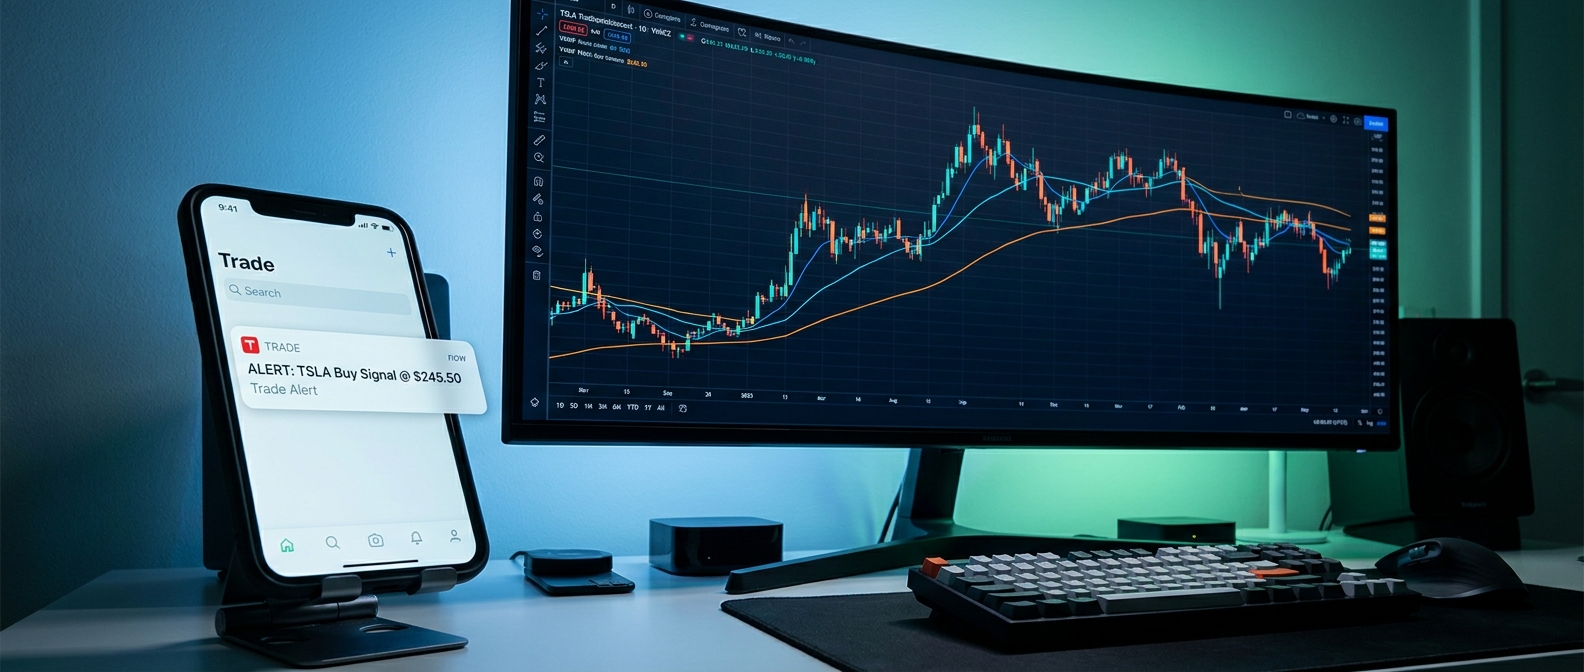
- Let ChartMath monitor: During the trading day, ChartMath watches your watchlist tickers across all 200+ screens. When one triggers, you get a push alert on your phone, even if you're away from your desk.
- Pull up the chart on alert: When an alert fires, open TradingView or TrendSpider to confirm the setup, draw your levels, and decide whether to enter. ChartMath told you what triggered and why. Your charting platform tells you where to enter and where to manage risk.
This loop keeps your charting platform clean and focused on execution rather than scanning. You're not refreshing a screener every five minutes. You're waiting for ChartMath to tap you on the shoulder, then doing the confirmation work you're already good at.
4. Use ChartMath's 200+ Pre-Built Screens to Surface High-Quality Setups
One of the biggest advantages of this trading workflow is access to 200+ pre-built technical screens without writing a single line of code. For traders who've tried to build custom alerts on TradingView, you know the Pine Script learning curve is real. For traders who've looked at Trade Ideas, you know the interface can feel overwhelming and the price tag is steep (starting at $118/month for desktop-only access).
ChartMath's screens cover the full spectrum of technical setups that active traders actually use:
- Opening Range Breakout (ORB): Stocks breaking above or below the first 5, 15, or 30-minute range with volume confirmation. One of the most reliable intraday setups for day traders.
- VWAP-based setups: VWAP reclaims, VWAP rejections, and price-to-VWAP divergences across multiple timeframes. Essential for intraday momentum trading.
- Relative Volume (RVOL) spikes: Stocks trading at 2x, 3x, or higher relative to their average volume, a leading indicator of institutional interest and potential breakout moves.
- Breakout patterns: 52-week highs, consolidation breakouts, and flag/pennant continuations on daily and weekly charts. Core setups for swing traders and momentum traders.
- Momentum indicators: RSI divergences, MACD crossovers, and moving average reclaims across multiple timeframes.
Every screen comes with backtest data showing win rate, average return, and maximum drawdown across historical market conditions. This transparency is what makes ChartMath different from black-box AI scoring systems. You can see exactly why a screen has an edge before you trade it. For a comprehensive look at chart patterns that work, check out 15 Most Profitable Chart Patterns for Day Traders in 2026.
5. Execute and Analyze on Your Primary Charting Platform
This is where your existing skills pay off. When ChartMath fires an alert, your job shifts from discovery to confirmation. You've already done the hard work of identifying what to watch and when to pay attention. Now you're using TradingView or TrendSpider to answer three questions: Is the setup still valid? Where's my entry? Where's my stop?
Using TradingView for Confirmation
TradingView's strength is in its charting flexibility. When a ChartMath alert fires, pull up the ticker on TradingView and check the following:
- Is price still above the key level that triggered the alert (VWAP, ORB high, breakout level)?
- Is volume confirming the move, or is it fading?
- Are there any nearby resistance levels that could cap the trade?
- Does the setup look clean on the timeframe you're trading?
If the answers are yes, yes, no, and yes, you have a trade. If not, you pass and wait for the next alert. This disciplined approach is what makes the two-layer trading workflow so effective. ChartMath handles the scanning. You handle the judgment.
Using TrendSpider for Confirmation
TrendSpider's automated trendline detection and multi-timeframe analysis make it a natural complement to ChartMath's discovery layer. When an alert fires, use TrendSpider to quickly check whether the stock is respecting key trendlines, whether the setup aligns across multiple timeframes, and whether automated support/resistance levels are nearby. TrendSpider is excellent at analyzing stocks you're already watching, which is exactly what you're doing after ChartMath surfaces the opportunity.
The Decision Loop
The complete trading workflow follows a simple loop: Discover → Confirm → Execute → Review. ChartMath handles Discover. Your charting platform handles Confirm and Execute. Your trading journal handles Review. Each step has a clear owner, and nothing falls through the cracks. For more on integrating alerts into this loop, see How to Integrate Trading Alerts with Your Charting Platform.
Trading Workflow Tips for Day Traders, Swing Traders, and Beginners
The two-layer trading workflow works across trading styles, but the configuration looks different depending on how you trade. Here's how to tailor it to your situation.

Day Traders
Your edge lives in the first two hours of the trading day. Configure ChartMath to alert you on ORB breaks, VWAP reclaims, and RVOL spikes on 1-minute, 5-minute, and 15-minute timeframes. Keep your charting platform open on your primary watchlist, and let ChartMath surface any stocks you might have missed. The mobile app means you can catch setups even during a quick break from your desk. For detailed execution strategies on short timeframes, see Intraday Trading: How to Execute 1-Minute to 15-Minute Plays.
Swing Traders
Your trading workflow is built around efficiency. You don't have time to scan charts for hours every evening. Configure ChartMath to send end-of-day alerts for daily and weekly timeframe setups, 52-week high breakouts, momentum divergences, and volume-confirmed trend continuations. Review the alerts after market close, add your favorites to your watchlist, and set entry alerts for the next session. The whole process takes 30 minutes or less. For a complete guide to this approach, see Swing Trading for Busy Professionals: 30-Minute Daily Guide.
Beginners
If you're new to technical trading, ChartMath's plain-English alert explanations are genuinely one of the best learning tools available. Every alert tells you what triggered, why it matters, and what the historical edge looks like. Start with 3 to 5 screens that cover the most common setups (ORB, VWAP, breakouts), read every alert explanation carefully, and use your charting platform to study the charts after the fact. You'll learn more from 30 days of real alerts than from most trading courses. For foundational knowledge on technical setups, see 15 Proven Technical Setups Every Day Trader Should Know.
Frequently Asked Questions About Building a Trading Workflow
Does ChartMath replace TradingView or TrendSpider?
No, and that's intentional. ChartMath is a trade discovery tool, not a charting platform. It scans the market and surfaces setups. TradingView and TrendSpider are charting platforms that analyze stocks you're already watching. The two-layer trading workflow uses both: ChartMath for discovery, your charting platform for confirmation and execution. They complement each other rather than compete.
Can I use ChartMath if I'm a beginner?
Absolutely. ChartMath was designed with beginners in mind. The 200+ pre-built screens mean you don't need to build anything from scratch, and every alert includes a plain-English explanation of the setup. The backtest data helps you understand which patterns have a historical edge, which is invaluable when you're still learning. No coding skills required.
How is ChartMath different from Finviz or Trade Ideas?
Finviz updates end-of-day and has no real-time alerts or mobile app, it's not built for intraday momentum trading. Trade Ideas is desktop-only, starts at $118/month, and has a complex interface that can overwhelm beginners. ChartMath is mobile-first, offers a free tier, provides real-time intraday scanning with push alerts, and includes backtest data for every screen. It's built specifically to fit into your existing trading workflow rather than replace it.
Does ChartMath work for both day trading and swing trading?
Yes. ChartMath supports multi-timeframe analysis from 1-minute charts all the way to weekly and monthly charts. Day traders use it for real-time intraday alerts. Swing traders use it for end-of-day signals on daily and weekly timeframes. The same platform, configured differently, serves both styles effectively.
Do I need coding skills to use ChartMath?
Not at all. That's one of the core advantages of ChartMath over platforms like TradingView, which requires Pine Script to build custom alerts. ChartMath's 200+ screens are pre-built and ready to use out of the box. You select the screens that match your strategy, enable alerts, and ChartMath handles the rest. No coding, no complex setup, no technical barrier to entry.
Build a Trading Workflow That Works While You're Not Watching
The best trading workflow isn't the one with the most tools. It's the one where every tool has a clear job and nothing falls through the cracks. Right now, most traders are using excellent charting platforms to analyze stocks they already know about, while missing dozens of high-quality setups they never even saw. Adding ChartMath as a real-time trade discovery layer closes that gap without disrupting anything you've already built.
You keep TradingView or TrendSpider for what they do best: confirmation, analysis, and execution. You add ChartMath for what they can't do: proactively scanning 200+ screens across the entire market, delivering intelligent push alerts with context and backtest data, and making sure you never miss a setup because you stepped away from your desk.
That's the trading workflow that serious traders are building in 2026. And it starts with a free download.
Ready to see how it works before committing? Watch the ChartMath demo to see the discovery engine in action. Or go straight to downloading the ChartMath app and start building your two-layer trading workflow today. If you prefer to explore on desktop first, the web-based screener gives you full access to ChartMath's screens and backtest data right in your browser.

Ankush Jindal
LinkedInSee these setups live in ChartMath
200+ curated screens with backtest data. 14-day free trial.