Swing Trading for Busy Professionals: 30-Minute Daily Guide

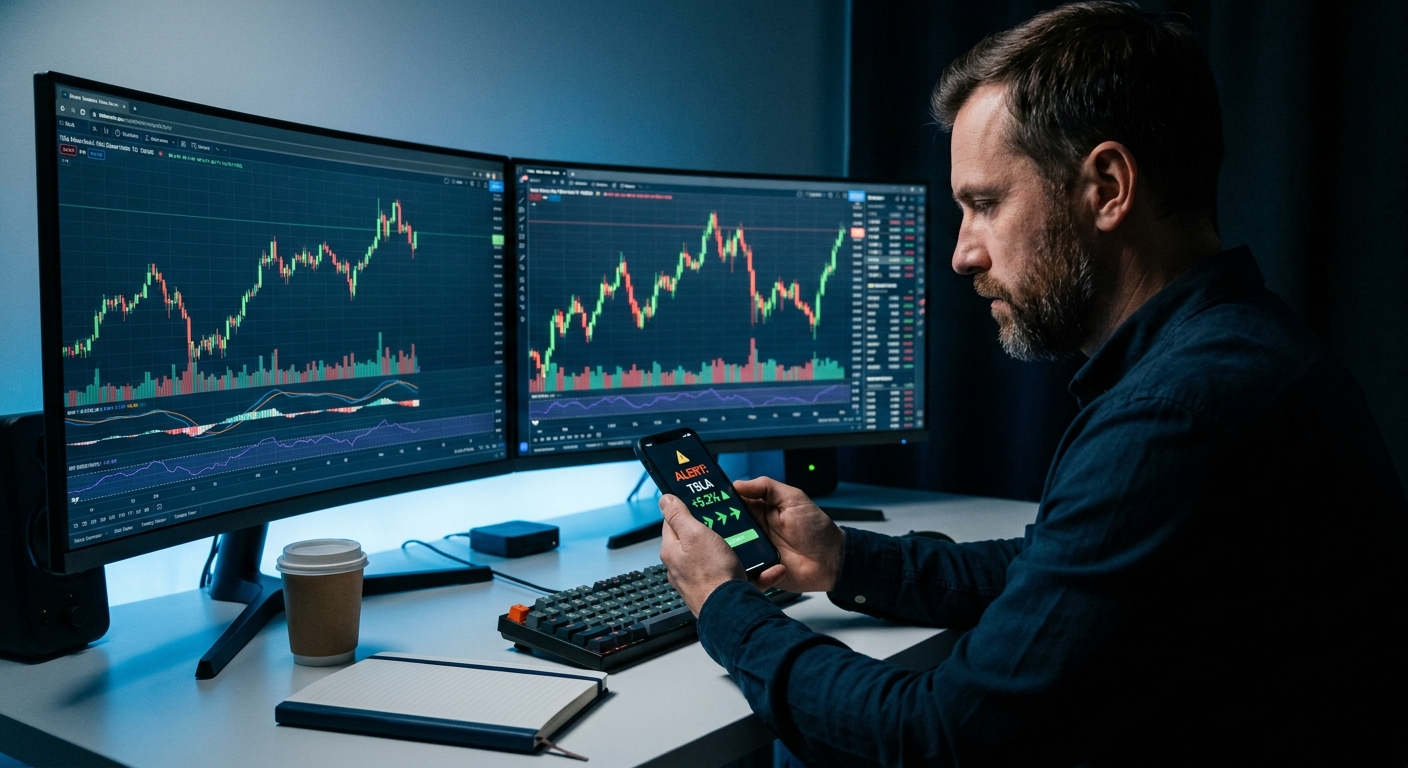
You're sitting in back-to-back meetings, your phone buzzes with a market alert, and by the time you check it, the opportunity is gone. Sound familiar? If you're a busy professional who wants to trade but can't stare at charts all day, swing trading might be your answer. Unlike day trading, which demands constant attention and split-second decisions, swing trading lets you capture multi-day price moves with just 30 minutes of focused work each evening.
In this comprehensive guide, you'll learn exactly how to build a time-efficient swing trading routine that fits around your career. We'll walk through end-of-day scanning workflows, watchlist management strategies, and how to identify high-probability breakout setups without sacrificing your day job or your sanity.
What Is Swing Trading and Why It Works for Busy Professionals
If the screen-time question is what's holding you back, our companion pillar on how to trade stocks without watching screens covers the broader workflow.
Swing trading is a trading style that aims to capture price movements over several days to several weeks. Unlike day traders who close all positions before the market closes, swing traders hold positions overnight and sometimes for weeks, targeting larger price swings. This approach relies primarily on technical indicators, chart patterns, and momentum signals on daily and weekly timeframes.
The beauty of swing trading for professionals is simple: you don't need to watch the market during trading hours. Your analysis happens after market close when you have time to think clearly without the pressure of real-time price action. You're looking for setups that develop over days, not minutes, which means you can place your orders in the evening and let the market come to you.
Here's why swing trading aligns perfectly with a busy schedule:
- Time efficiency: 30 minutes of focused analysis beats 6 hours of distracted chart-watching
- Reduced stress: No need to monitor intraday volatility or make split-second decisions during work hours
- Better decision-making: You analyze setups when markets are closed, eliminating emotional reactions to price swings
- Scalability: Your routine stays consistent whether you're tracking 5 stocks or 50
The realistic time commitment for effective swing trading is about 30 minutes per day during the week, plus perhaps an hour on weekends for deeper research and planning. This isn't a get-rich-quick scheme, but a systematic approach to building wealth alongside your career. With proper risk management and proven technical setups, swing traders can target 2-5% gains per trade while risking 1-2% of their capital.
1. Set Up Your End-of-Day Scanning Workflow (10 Minutes)
Your evening scanning routine is the foundation of successful swing trading. The goal is to identify new opportunities and monitor existing positions without manually reviewing hundreds of charts. Here's how to build a workflow that takes just 10 minutes.
Timing matters. The optimal time to scan is between 6:00 PM and 9:00 PM Eastern, after the market has closed and all end-of-day data is finalized. This gives you time to analyze setups, place orders, and still enjoy your evening. Some traders prefer scanning right after the 4:00 PM close, but waiting a few hours ensures all data feeds are updated and you're not reacting to after-hours noise.
The key to efficient scanning is using stock screeners that do the heavy lifting for you. Instead of manually flipping through charts, you need a system that automatically identifies stocks meeting specific technical criteria. The most important filters for swing trading include:
- Breakout patterns: Stocks breaking above resistance levels or consolidation ranges
- Momentum indicators: Strong relative strength compared to the broader market
- Volume confirmation: RVOL (relative volume) showing unusual activity that validates the move
- Price action: Clean chart structure without excessive whipsaws
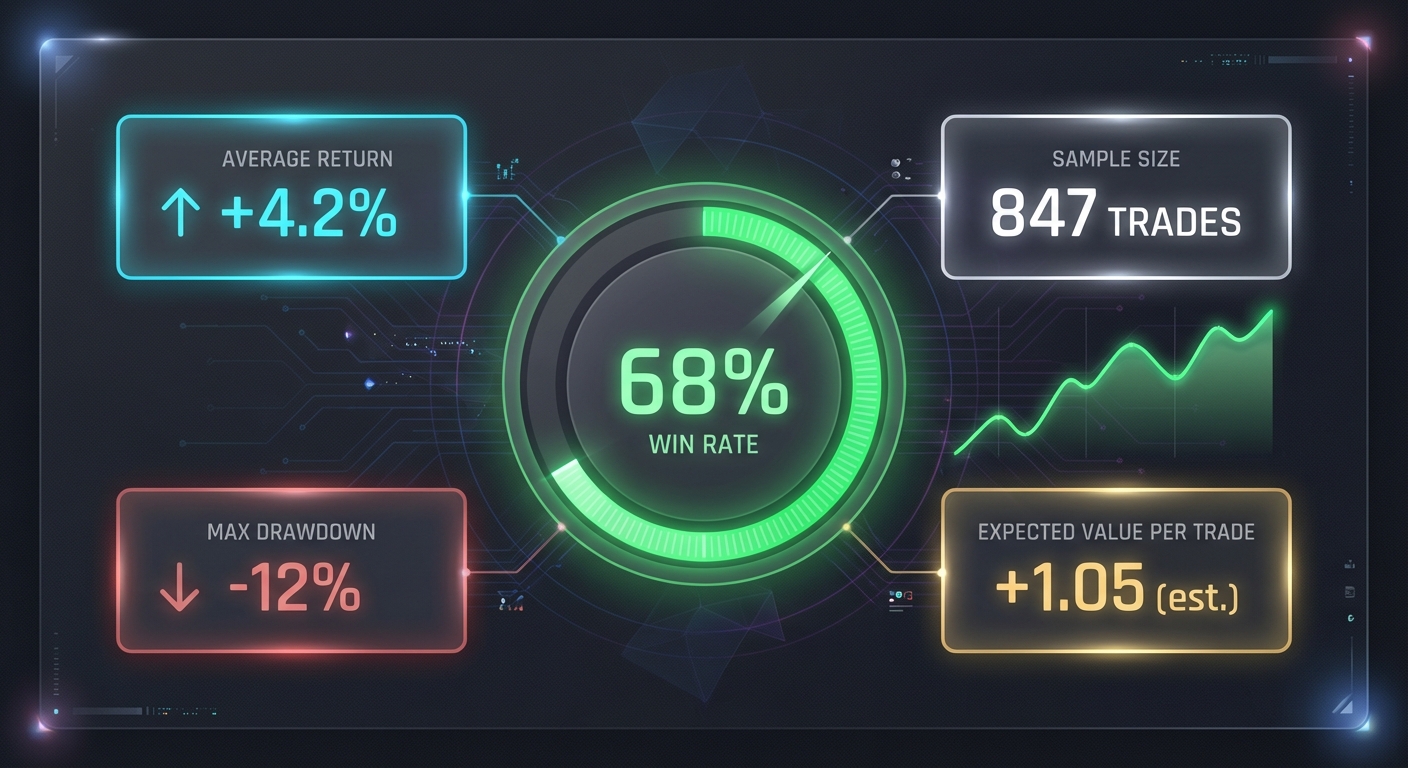
Here's where most traders waste time: they use basic screeners that return 200+ results with no context about which setups actually work. You end up clicking through dozens of charts trying to figure out which ones are worth trading. A better approach is using stock screening apps that show you backtested performance data alongside each setup.
For example, if a screener shows you 50 stocks in ascending triangles, but you can see that this pattern has a 58% win rate with an average return of 4.2% over the past year, you can prioritize those setups over random breakouts with no historical edge. This is the difference between guessing and trading with data.
Choosing the Right Stock Screeners for Swing Trading
Not all screening tools are built for swing traders. When evaluating stock screeners, look for these essential features:
- Pre-built technical screens: You shouldn't need to code or build filters from scratch. Look for platforms with 50+ ready-made screens for common patterns like bull flags, cup and handle, VWAP reclaims, and momentum breakouts.
- Backtest data: Every screen should show historical win rate, average return, and sample size. Without this, you're flying blind.
- Multi-timeframe support: You need to see daily setups with weekly context. A daily breakout is more powerful when the weekly chart shows a larger uptrend.
- Mobile accessibility: Your scanning workflow should work on your phone so you can review setups during your commute or between meetings.
- Alert integration: The screener should notify you when new setups appear, not require you to manually refresh all day.
ChartMath addresses these needs by providing 200+ pre-built technical screens with backtested win rates and average returns for every strategy. Instead of building complex filters or writing code, you can swipe through ranked setups on your phone, see which patterns have historically worked, and add promising stocks to your watchlist in seconds. The platform scans the market continuously and alerts you when stocks match proven technical setups, so you're not missing opportunities while you're in meetings.
For a deeper dive into maximizing your screening workflow, check out our guide on how to use stock screeners for day trading in 2026, which covers many principles that apply to swing trading as well.
2. Build and Manage Your Swing Trading Watchlist (5 Minutes)
Once you've identified potential setups through your evening scan, you need a system to track them without overwhelming yourself. The biggest mistake new swing traders make is trying to monitor too many stocks at once. Your attention gets diluted, you miss important signals, and you end up making impulsive decisions.
The optimal watchlist size for swing trading is 10-20 stocks. This gives you enough diversity to find opportunities without creating information overload. You should be able to review your entire watchlist in 5 minutes and know exactly what you're watching for on each stock.
Here's how to build a high-quality watchlist:
- Start with sector diversity: Don't load your watchlist with 15 tech stocks. Spread across 4-5 sectors so you're not overexposed to sector-specific news.
- Focus on liquid stocks: Stick with stocks that trade at least 1 million shares per day. This ensures you can enter and exit positions without slippage.
- Prioritize clean chart structure: Add stocks with clear support and resistance levels, not choppy ranges that are hard to read.
- Look for catalysts: Earnings dates, product launches, or industry events can provide the fuel for breakout moves.
Your daily watchlist review should take no more than 5 minutes. Open your watchlist, check which stocks are approaching key levels, and note any that have triggered your entry criteria. If a stock breaks out and you enter a position, keep it on your watchlist to monitor. If a stock violates your setup thesis (breaks below support, loses momentum), remove it and replace it with a fresh opportunity from your evening scan.
The key to managing a watchlist without constant checking is setting up intelligent trading alerts. Instead of refreshing your watchlist every hour, configure alerts for specific conditions:
- Price breaks above resistance by at least 2%
- Volume exceeds 2x the 20-day average
- Stock reclaims a key moving average (50-day or 200-day)
- RSI crosses above 60 (momentum confirmation)
With properly configured alerts, you only need to look at your watchlist when something meaningful happens. This is how you trade with 30 minutes per day instead of 3 hours. Learn more about setting up effective alert systems in our article on how to integrate trading alerts with your charting platform.
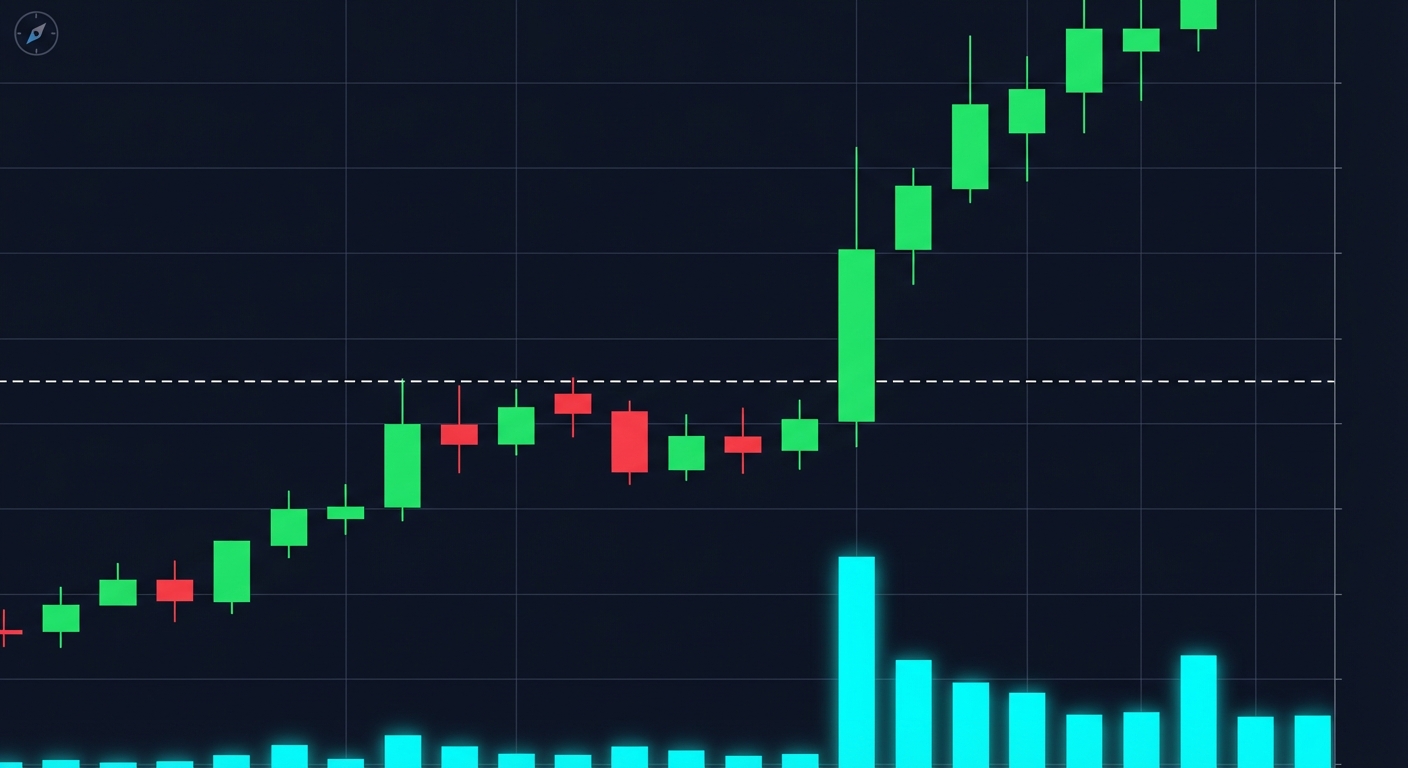
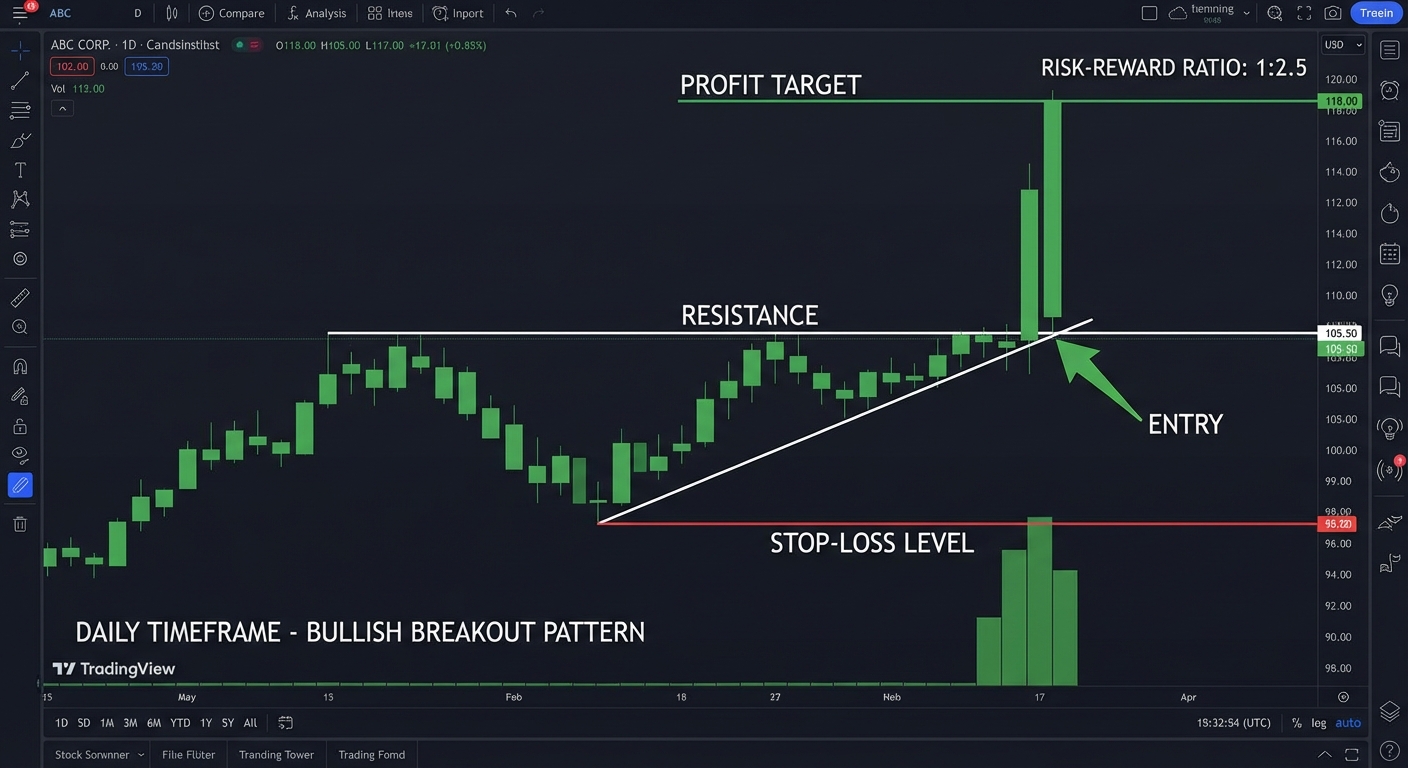
3. Identify High-Probability Breakout Setups (10 Minutes)
Not all breakouts are created equal. The difference between profitable breakout trading and getting trapped in false moves comes down to pattern recognition and confirmation signals. In your 10-minute analysis window, you need to quickly identify which setups have the highest probability of success.
Here are the classic chart patterns that work consistently for swing trading:
- Ascending triangle: A pattern where price makes higher lows while testing the same resistance level multiple times. The breakout typically happens on the 3rd or 4th test with strong volume.
- Bull flag: A sharp upward move (the pole) followed by a tight consolidation (the flag). The breakout continuation should happen within 5-15 days of the flag forming.
- Cup and handle: A rounded bottom (the cup) followed by a small pullback (the handle). The breakout from the handle often leads to a measured move equal to the depth of the cup.
- Flat base: A tight consolidation near recent highs, showing that sellers are exhausted. Breakouts from flat bases often lead to explosive moves.
Volume confirmation is non-negotiable. A breakout without volume is a red flag. You want to see RVOL (relative volume) of at least 1.5x to 2x the average when price breaks through resistance. This tells you that institutional money is participating, not just retail traders chasing momentum.
Here's a quick checklist for validating breakout setups:
- Pattern structure: Is the consolidation clean with clear support and resistance?
- Volume trend: Is volume declining during consolidation and expanding on the breakout?
- Timeframe alignment: Does the daily breakout align with the weekly trend?
- Market context: Is the broader market in an uptrend or fighting resistance?
- Historical performance: Does this pattern have a positive win rate and average return based on backtesting?
Momentum Trading Indicators That Matter
While chart patterns provide the setup, momentum trading indicators help you time your entry and confirm the strength of the move. Here are the most reliable indicators for swing trading:
- RSI (Relative Strength Index): Look for RSI crossing above 60 on the daily chart as confirmation of momentum. Avoid buying when RSI is above 80 (overbought) unless you're trading a strong trending stock.
- Moving average crossovers: The 10-day moving average crossing above the 50-day is a classic bullish signal. Even better is when price is above both the 50-day and 200-day moving averages.
- VWAP reclaims: When a stock that's been trading below VWAP breaks back above and holds, it often signals a shift in control from sellers to buyers. This works on daily charts, not just intraday.
- Relative strength: Compare the stock's performance to the S&P 500. You want to trade stocks that are outperforming the market, not just moving with it.
The mistake many traders make is using too many indicators and creating analysis paralysis. For swing trading, you only need 2-3 indicators to confirm your thesis. If you see a clean breakout pattern, strong volume, and RSI crossing above 60, that's enough. Don't wait for 10 indicators to align perfectly or you'll miss the move.
4. Execute Your Swing Trading Strategy Around Your Day-Job Schedule (5 Minutes)
You've identified a high-probability setup, validated it with volume and momentum indicators, and added it to your watchlist. Now comes the execution phase, which should take no more than 5 minutes per trade.
The key to executing swing trades with minimal screen time is using limit orders and stop orders strategically. You're not sitting at your computer waiting to click the buy button at the perfect moment. Instead, you're placing orders in the evening that will execute automatically when your criteria are met.
Here's how to structure your orders:
- Entry order: Place a buy stop order 2-3% above the breakout level. This ensures you only enter if the stock actually breaks out with conviction, not if it just touches resistance and falls back.
- Stop-loss order: Immediately place a stop-loss order below the nearest support level. For most breakout trades, this is 5-8% below your entry. Never enter a trade without a predetermined stop-loss.
- Profit target: Set a limit order at your target price, typically 2-3x your risk. If you're risking $1 per share, target $2-3 per share in profit.
Position sizing is where most traders sabotage themselves. The rule is simple: never risk more than 1-2% of your total trading capital on a single trade. If you have a $50,000 account, you should risk no more than $500-1,000 per trade. This means if your stop-loss is $2 per share, you can buy 250-500 shares.
Here's a practical example:
- Account size: $50,000
- Risk per trade: 1% = $500
- Entry price: $50
- Stop-loss: $47 (6% below entry)
- Risk per share: $3
- Position size: $500 ÷ $3 = 166 shares
- Total position value: $8,300 (16.6% of account)
Notice that even though you're only risking 1% of your account, the position itself is 16.6% of your capital. This is normal and correct. You're not limiting your position size to 1% of your account; you're limiting your potential loss to 1%.
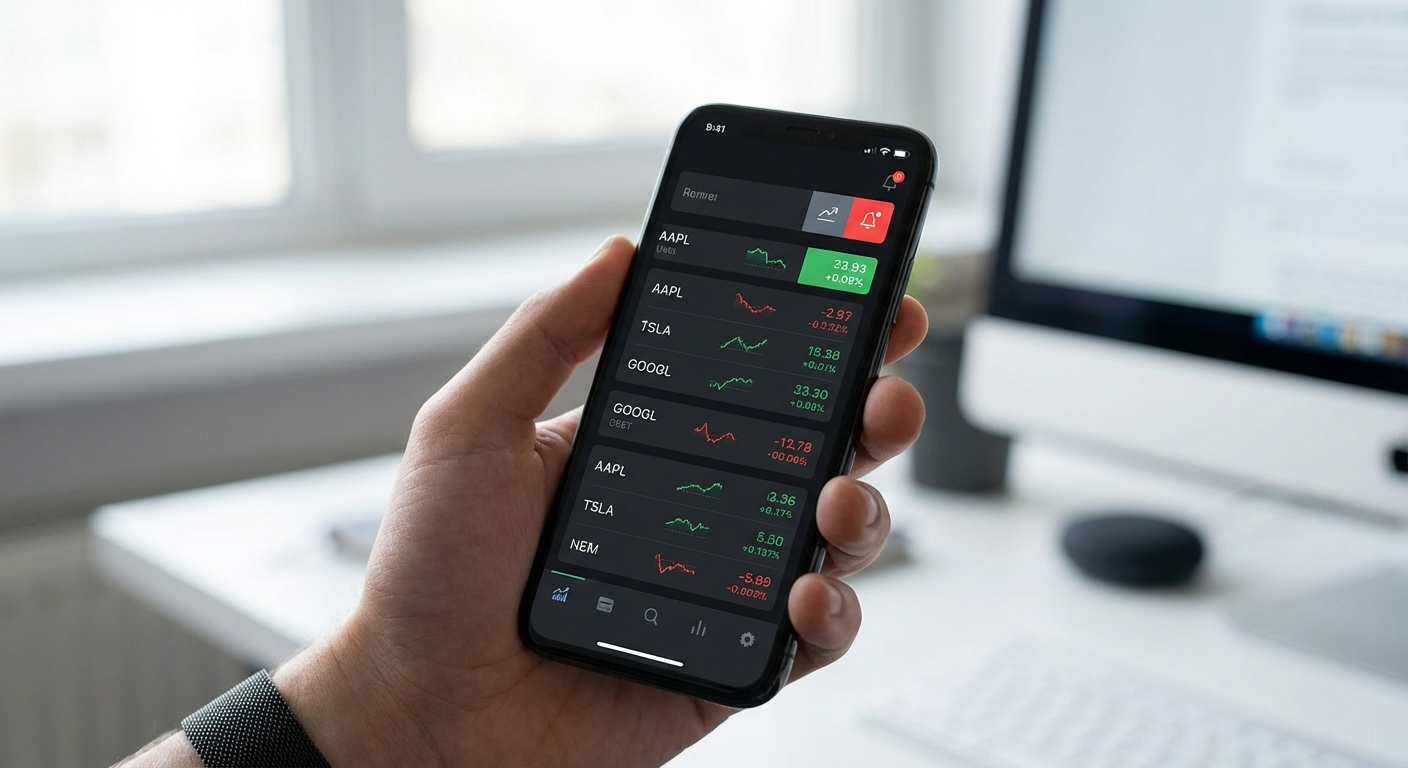
For busy professionals, mobile trading apps are essential. You should be able to place orders, adjust stop-losses, and take profits from your phone during lunch or between meetings. The best platforms offer one-tap order entry with pre-configured risk parameters, so you're not fumbling with order types while standing in line for coffee.
5. Monitor and Adjust Your Positions Without Constant Checking
Once you're in a trade, the hardest part for busy professionals is resisting the urge to check positions every 10 minutes. This defeats the entire purpose of swing trading and introduces emotional decision-making that destroys returns.
Here's a realistic monitoring schedule that balances awareness with efficiency:
- Morning check (5 minutes): Review your positions 30 minutes after market open to see how they're reacting to the opening range. If a position gaps down through your stop, you may need to exit manually.
- Midday check (2 minutes): Quick glance during lunch to ensure no major news has hit your positions. Don't make changes unless something fundamental has broken your thesis.
- Close check (5 minutes): Review how positions closed relative to their intraday range. A stock closing near its high is bullish; closing near its low is a warning sign.
That's 12 minutes per day of active monitoring. The rest of the time, you rely on trading alerts to notify you of important events:
- Position reaches profit target
- Stop-loss is triggered
- Stock breaks a key support or resistance level
- Volume spikes above 3x average (potential news event)
Trailing stops are your best friend for swing trading. Once a position moves 5-10% in your favor, adjust your stop-loss to break-even. When it moves 15-20% in your favor, trail your stop to lock in at least half your gains. This lets you capture extended moves without giving back all your profits if the stock reverses.
The psychological challenge is knowing when to take profits early versus letting winners run. Here's a simple framework:
- Take partial profits at 2R: If you risked $1 per share, sell 30-50% of your position when you're up $2 per share. This locks in a win and reduces stress.
- Trail the rest: Let the remaining position run with a trailing stop. If it continues higher, you capture the extended move. If it reverses, you still walk away with a profit.
- Exit completely if thesis breaks: If the reason you entered the trade is no longer valid (breaks below key support, loses momentum, market reverses), exit the entire position regardless of profit or loss.
Common Swing Trading Mistakes Busy Professionals Make
Even with a solid system, there are pitfalls that trap busy traders. Here are the most common mistakes and how to avoid them:
Overtrading due to FOMO and alert fatigue. You get 20 alerts per day and feel like you need to act on all of them. This leads to overtrading, poor position sizing, and mental exhaustion. The fix: limit yourself to 2-3 new positions per week. Quality over quantity always wins in swing trading.
Ignoring backtesting data and chasing unproven setups. You see a stock making a big move and jump in without checking if the pattern has a historical edge. This is gambling, not trading. The fix: only trade setups with documented win rates above 55% and positive average returns. If you can't find backtest data, skip the trade.
Poor position sizing and risk management. You risk 5% on a "sure thing" and it stops you out, wiping out five winning trades. The fix: never risk more than 1-2% per trade, no exceptions. Your position size should be calculated based on your stop-loss distance, not how confident you feel.
Checking positions too frequently. You refresh your portfolio 30 times per day, making emotional decisions based on intraday noise. The fix: set alerts for important levels and only check positions at predetermined times (morning, lunch, close). Trust your system and let the trade develop.
Not having a clear exit strategy before entry. You enter a trade without knowing where you'll take profits or cut losses. This leads to holding losers too long and selling winners too early. The fix: define your stop-loss, profit target, and trailing stop rules before you enter. Write them down if necessary.
Tools and Technology for Time-Efficient Swing Trading
The right tools can reduce your daily trading time from 2 hours to 30 minutes. Here's what you need in your swing trading technology stack:
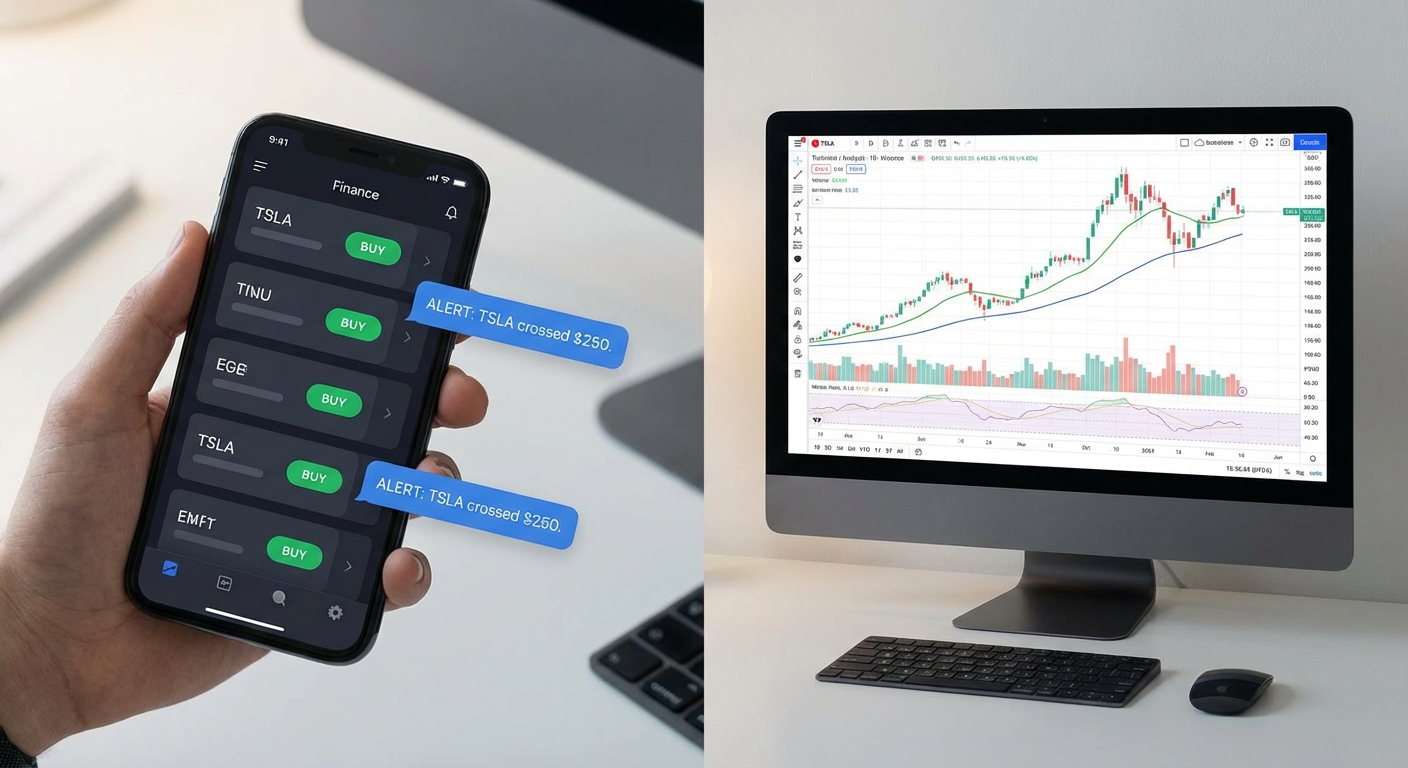
Mobile-first platforms for on-the-go management. Your primary trading interface should work flawlessly on your phone. You should be able to scan for setups, review watchlists, place orders, and adjust stops without ever opening a laptop. Look for platforms with intuitive swipe interfaces that let you quickly evaluate opportunities during your commute or between meetings.
Pre-built technical screens vs. manual scanning. Building custom screeners from scratch is a time sink. You need platforms that offer 100+ pre-built screens for common patterns like breakout trading setups, momentum plays, and reversal patterns. Even better if these screens show you backtested performance data so you know which patterns actually work.
ChartMath solves this problem by providing 200+ curated technical screens with historical win rates and average returns. Instead of spending 30 minutes building filters and manually reviewing charts, you can swipe through ranked setups in 5 minutes, see which patterns have a proven edge, and add promising stocks to your watchlist. The platform continuously scans the market and sends push notifications when stocks match your criteria, so you're not missing opportunities while you're in meetings or focused on your day job.
The value of backtest data in setup selection. Without historical performance data, you're guessing which patterns work. A platform that shows you "this ascending triangle pattern has a 62% win rate with an average return of 5.8% over 200 trades" gives you the confidence to execute when the setup appears. This is the difference between systematic trading and hope-based trading.
Integration between screeners and charting platforms. Your screening tool should work seamlessly with your charting platform. When you find a setup in your screener, you should be able to open the detailed chart with one tap to validate the pattern and place your order. Friction between tools costs you time and opportunities.
Push notifications vs. email alerts. Email alerts get buried in your inbox and checked sporadically. Push notifications on your phone ensure you see important signals within minutes. Configure your alerts to only notify you of high-priority events (breakouts, stop-losses, profit targets) so you're not drowning in noise.
To see how ChartMath's mobile-first approach and pre-built screens can streamline your swing trading workflow, watch the demo and discover how 30 minutes per day is all you need to identify high-probability setups backed by real performance data.
Your 30-Minute Daily Swing Trading Routine
Let's bring everything together into a complete daily workflow that takes exactly 30 minutes. This is your repeatable system for consistent swing trading success as a busy professional.
6:00 PM - 6:10 PM: Evening Scan (10 minutes)
- Open your stock screener and review pre-built screens for breakout patterns, momentum setups, and volume spikes
- Filter results by backtested win rate (55%+ minimum) and average return (3%+ minimum)
- Identify 3-5 new setups that meet your criteria
- Add promising stocks to your watchlist with notes on what you're watching for
6:10 PM - 6:15 PM: Watchlist Review (5 minutes)
- Review your existing watchlist of 10-20 stocks
- Check which stocks are approaching entry triggers
- Remove stocks that have violated their setup thesis
- Update alerts for stocks nearing key levels
6:15 PM - 6:25 PM: Setup Analysis (10 minutes)
- Deep dive into 2-3 highest-probability setups from your scan
- Validate chart pattern structure and volume confirmation
- Check momentum indicators (RSI, moving averages, relative strength)
- Review weekly timeframe for trend alignment
- Confirm backtest data supports the setup
6:25 PM - 6:30 PM: Order Placement (5 minutes)
- Calculate position size based on 1-2% risk per trade
- Place buy stop orders above breakout levels
- Set stop-loss orders below support
- Configure profit target limit orders
- Set alerts for key price levels
Weekend Preparation (60 minutes)
On Sunday evening or Saturday morning, spend an hour on deeper research:
- Review the week's performance: which trades worked, which didn't, and why
- Scan for longer-term setups developing on weekly charts
- Research upcoming earnings dates and economic events
- Refresh your watchlist with new sectors or themes
- Review and adjust your trading rules based on recent results
Scaling your routine as you gain experience. When you're starting out, 30 minutes might feel rushed. That's okay. Focus on quality over quantity—trade 1-2 setups per week until the routine becomes second nature. As you gain experience, you'll be able to evaluate setups faster, and 30 minutes will feel like plenty of time. Some experienced swing traders can complete their entire routine in 15-20 minutes.
Tracking performance and refining your process. Keep a simple trading journal with these data points for every trade:
- Setup type (ascending triangle, bull flag, etc.)
- Entry price, stop-loss, and target
- Actual exit price and return
- What worked and what didn't
Review your journal monthly to identify patterns. If bull flags are working 70% of the time but cup and handle setups are only working 40% of the time, adjust your strategy accordingly. Your edge comes from continuously refining your process based on real results.
Swing trading isn't about predicting the future or finding the next 10-bagger. It's about identifying high-probability setups with proven edges, managing risk systematically, and executing with discipline. With just 30 minutes per day and the right tools, you can build a profitable swing trading system that complements your career instead of consuming it.
Ready to streamline your swing trading workflow with pre-built technical screens, backtested performance data, and mobile-first alerts that work around your schedule? Watch the ChartMath demo to see how busy professionals are identifying high-probability swing trading setups in minutes, not hours, and trading with confidence backed by real data.

Ankush Jindal
LinkedInSee these setups live in ChartMath
200+ curated screens with backtest data. 14-day free trial.