How to Catch Breakout Trading Opportunities in Real-Time
You've been staring at the same chart for 20 minutes, waiting for that resistance level to break. The moment you step away to grab coffee, the stock explodes 8% higher without you. Sound familiar? Missing breakout trading opportunities isn't just frustrating—it's costing you real money. The good news is that catching breakouts in real-time doesn't require superhuman focus or sitting glued to your screen all day. With the right scanning tools, automated alerts, and a systematic approach, you can identify and capitalize on breakout trading setups before they happen.
This guide walks you through a proven workflow for catching breakout trading opportunities in 2026. You'll learn how to monitor multiple stocks across different timeframes, validate setups with backtest data, and receive timely notifications that actually help you make better trading decisions. Whether you're a day trader looking for intraday momentum plays or a swing trader hunting multi-day breakouts, this real-time setup guide will help you stop missing entries and start catching moves early.
What Is Breakout Trading and Why It Works in 2026
Breakout trading is a momentum strategy where traders enter positions when price breaks through a defined resistance level with strong volume. The psychology behind breakouts is simple: when price consolidates at a resistance level, it creates a zone where sellers have repeatedly stepped in. When buyers finally overpower those sellers and push price through resistance, it often triggers a cascade of buying—stop losses from short sellers, breakout traders entering new positions, and momentum algorithms detecting the move.
Despite the rise of algorithmic trading, breakout patterns remain effective in 2026 because they reflect fundamental market psychology that hasn't changed. Traders still place stops at logical levels. Institutions still accumulate positions during consolidation. And momentum still attracts momentum. The challenge isn't whether breakouts work—it's catching them at the right time.
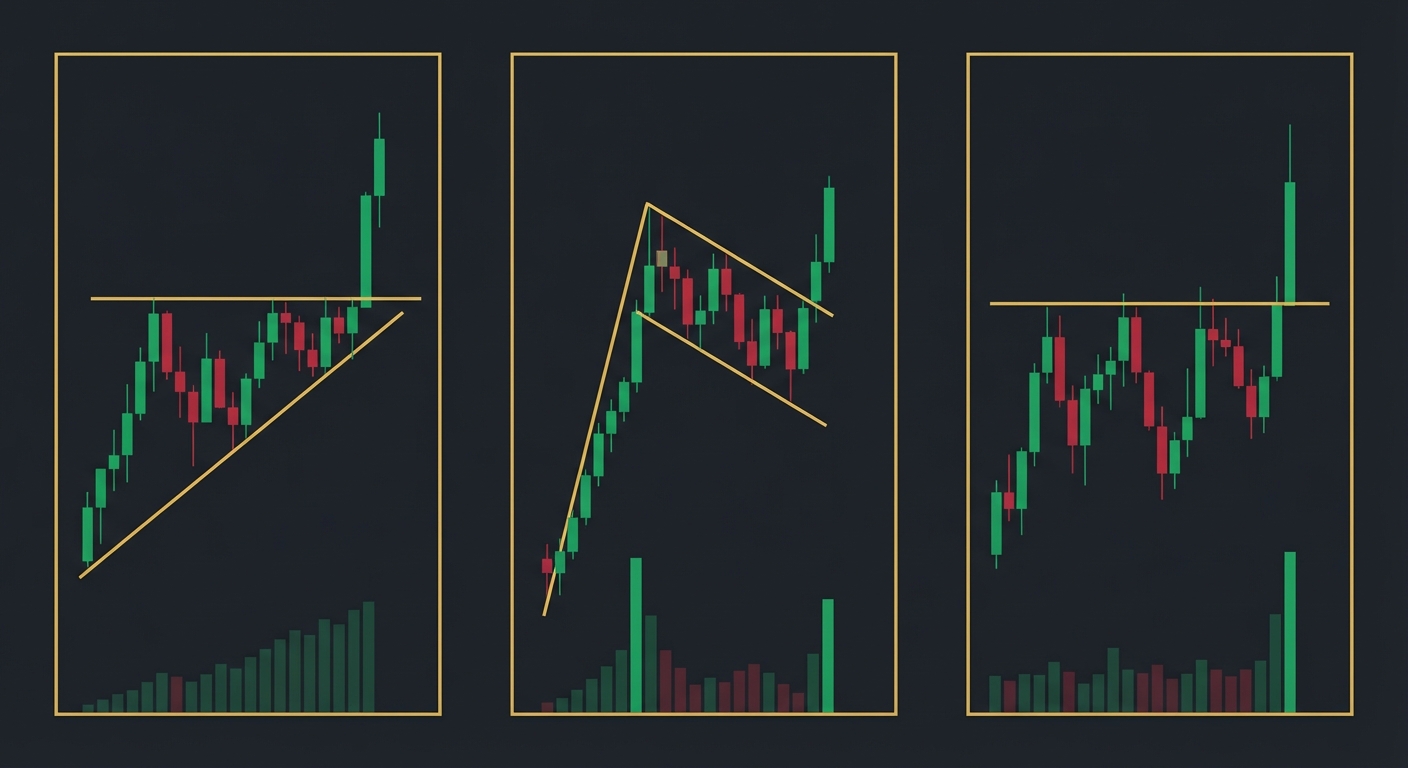
Common chart patterns that produce breakout trading opportunities include horizontal resistance breaks, ascending triangles, bull flags, cup-and-handle formations, and range expansions after tight consolidation. Each pattern represents a period where supply and demand reach equilibrium before one side takes control. The key is identifying these setups before they trigger and being ready to act when they do.
The biggest obstacle for most traders isn't understanding breakout patterns, it's the practical challenge of monitoring dozens or hundreds of stocks simultaneously across multiple timeframes. You can't manually scan charts all day. You need a systematic approach that combines automated scanning with intelligent alerts, which is exactly what we'll build in this guide.
1. Set Up Multi-Timeframe Breakout Scanning
The first step in catching breakout trading opportunities is establishing a scanning system that monitors the entire market across multiple timeframes. Why multiple timeframes? Because a stock breaking out on the 5-minute chart might be hitting resistance on the daily chart, or a daily breakout might offer a better risk-reward than an intraday scalp. You need context.
For day trading, focus on 1-minute, 5-minute, and 15-minute charts to catch intraday breakout setups. These shorter timeframes reveal opening range breakouts (ORB), VWAP reclaims, and momentum surges that develop during the trading session. Day traders need real-time scanning because opportunities appear and disappear within minutes.
For swing trading, monitor daily and weekly charts to identify multi-day breakout patterns. These setups typically offer larger profit potential but require more patience. Swing traders benefit from end-of-day scans that highlight stocks setting up for potential breakouts over the next few sessions, giving them time to prepare entries and manage risk.
The problem with manual scanning is simple math: if it takes 30 seconds to analyze one chart, scanning 100 stocks across three timeframes takes 90 minutes. By the time you finish, the first stocks you looked at have already moved. This is where automated stock screeners become essential. Modern scanning platforms continuously monitor thousands of stocks in real-time, identifying breakout patterns the moment they form.
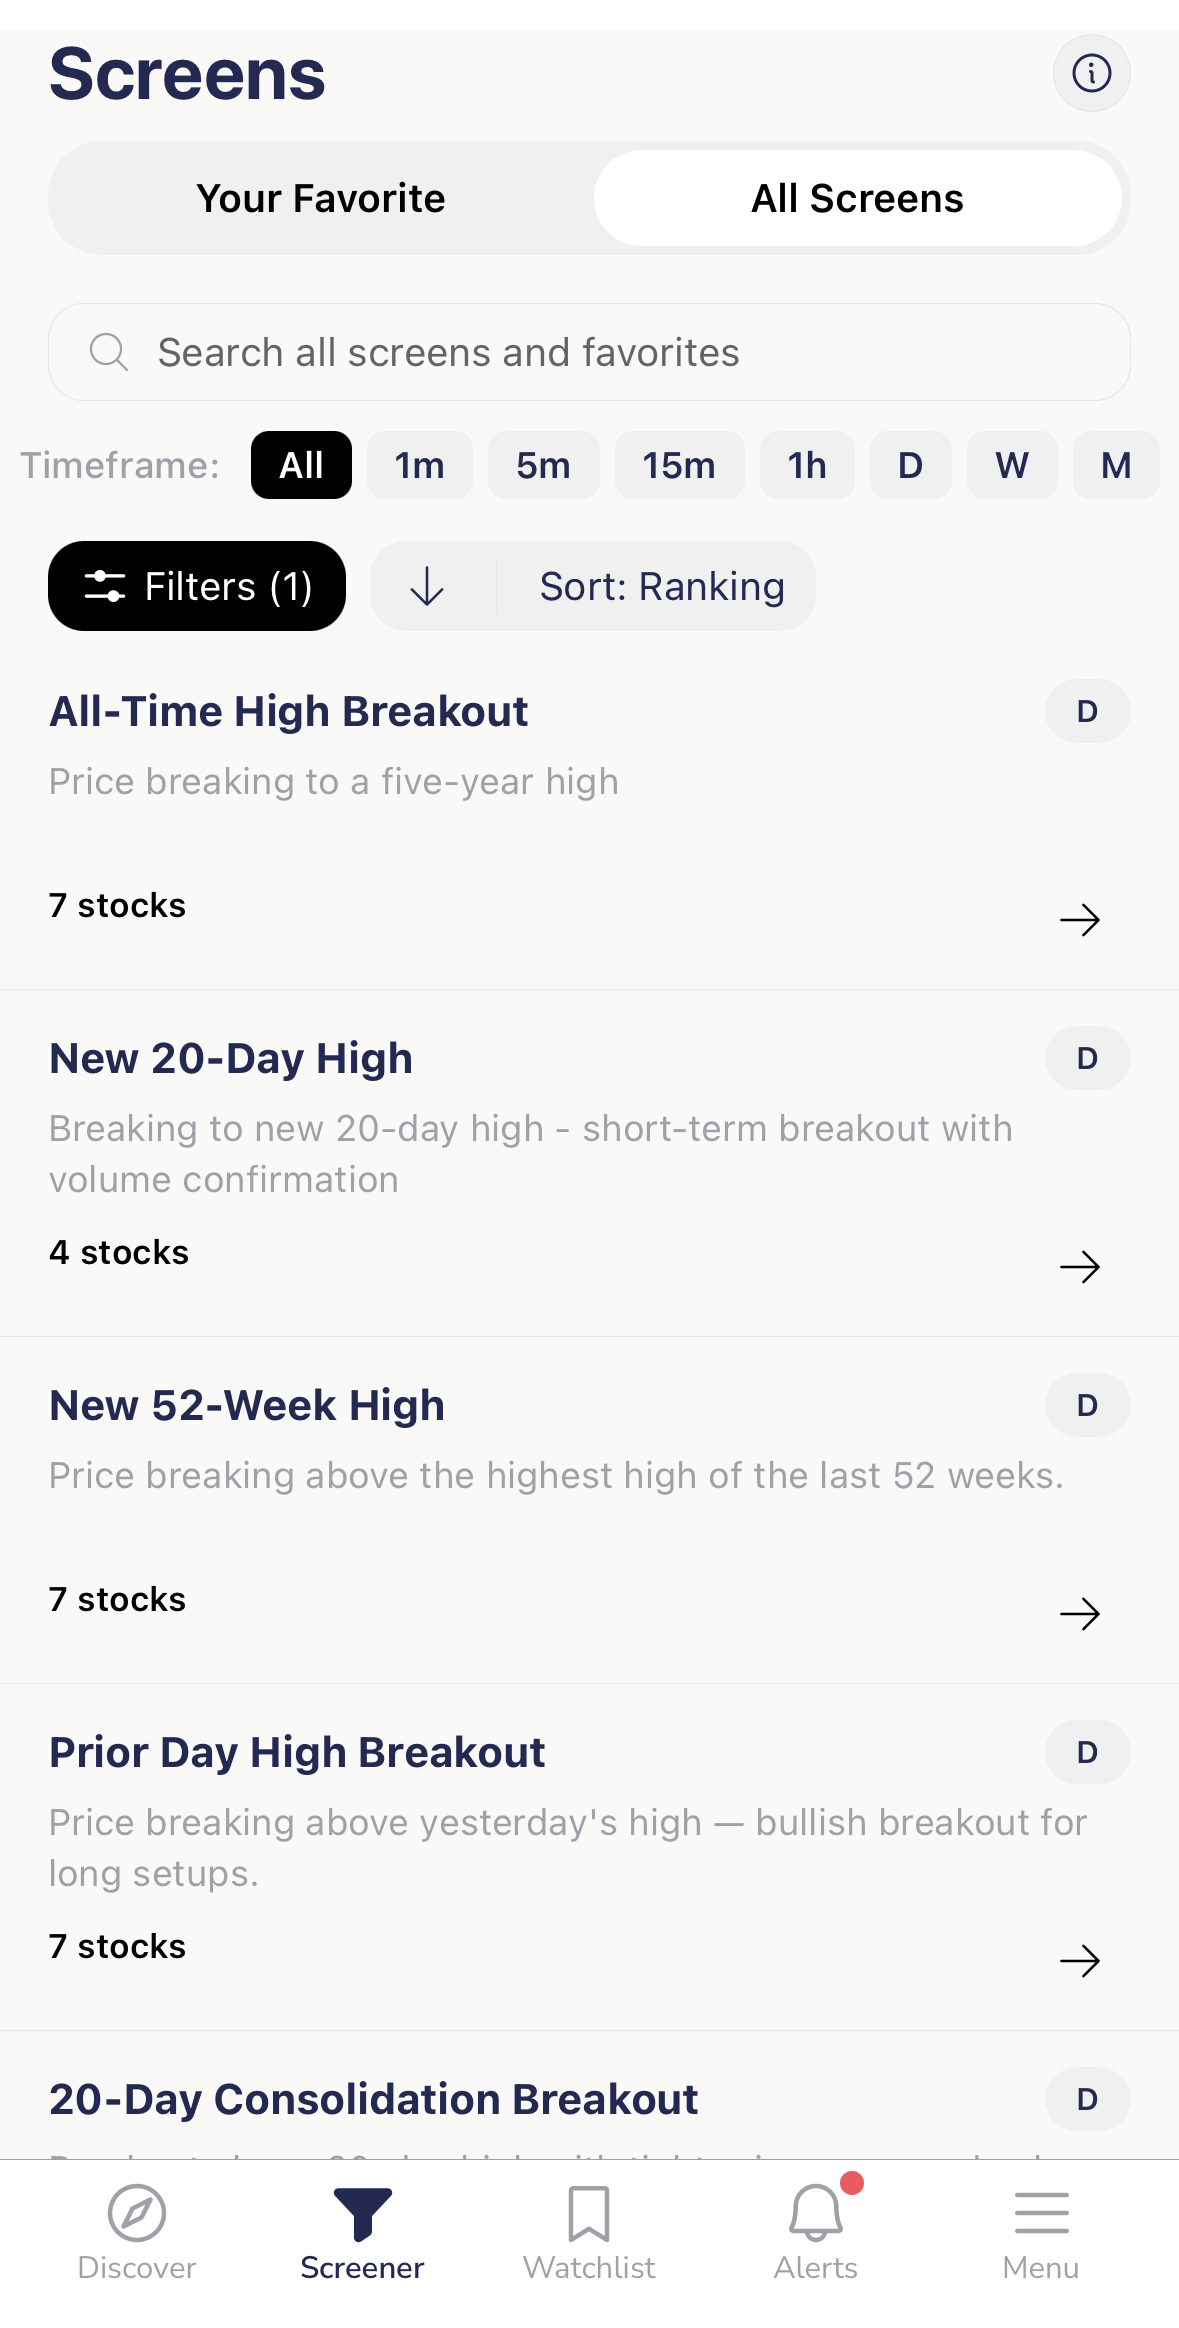
ChartMath runs over 200 technical screens simultaneously, including dedicated breakout scans across all major timeframes. Instead of manually refreshing screeners or cycling through watchlists, the platform surfaces breakout setups as they develop, ranked by quality and freshness. This means you see the highest-probability opportunities first, not just a random list of stocks that happen to be moving.
When setting up your scanning system, prioritize these breakout-specific filters: stocks trading above key resistance levels, volume spikes above average (RVOL > 1.5), price consolidation followed by expansion, and proximity to technical levels like VWAP or moving averages. The goal is to catch stocks at the moment of breakout, not after they've already run 10%.
2. Identify High-Probability Breakout Patterns Before They Trigger
Catching breakout trading opportunities before they happen requires recognizing the setup phase, the period of consolidation and compression that precedes the actual breakout. This is where most traders gain their edge: spotting stocks that are about to break out, not chasing stocks that already have.
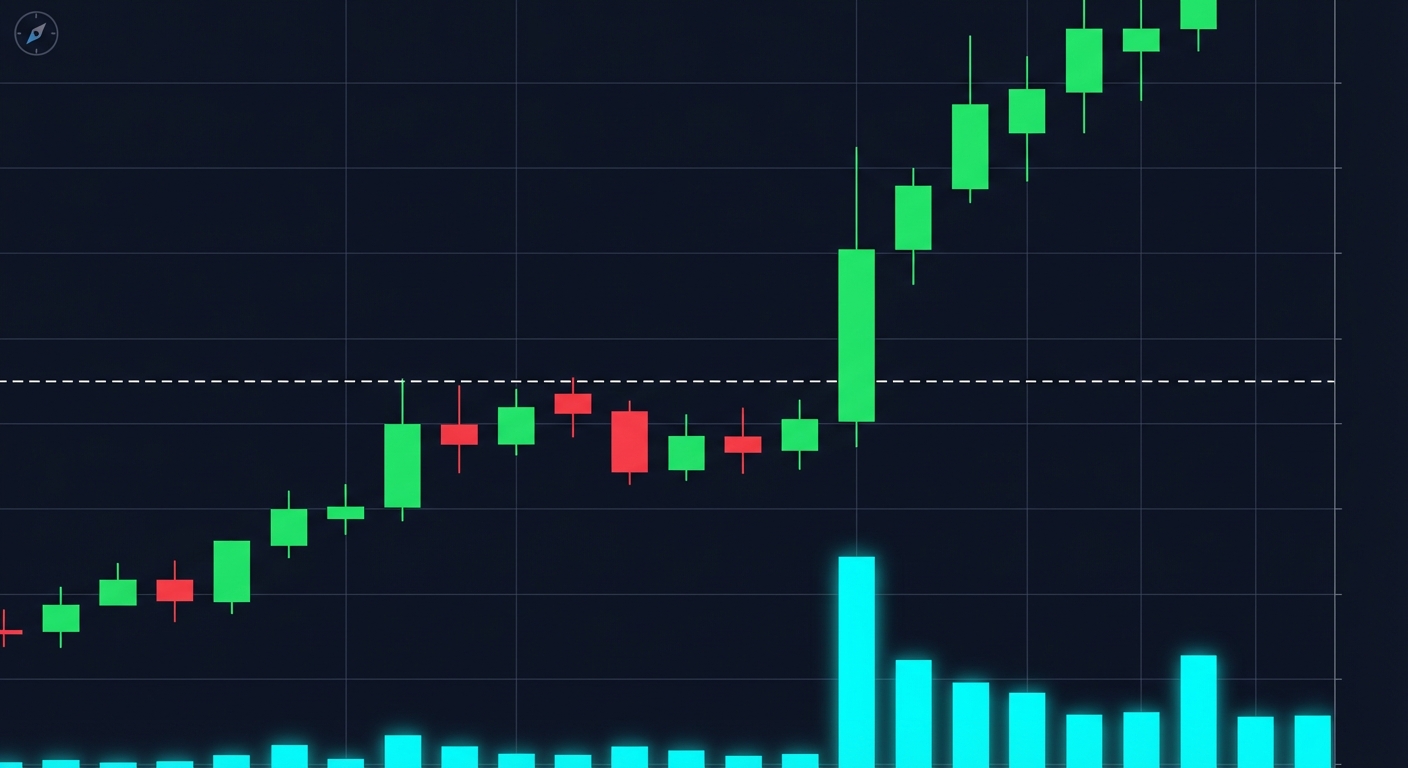
The most reliable pre-breakout signal is consolidation near resistance. When a stock repeatedly tests a resistance level without breaking through, it's building energy. Each test weakens the sellers at that level. Look for tightening price action, smaller candles, narrower ranges, decreasing volatility. This compression often precedes expansion.
Volume analysis is critical for validating breakout strength. Before the breakout, you typically see declining or average volume during consolidation. When the breakout occurs, you want to see a significant volume spike, ideally 1.5x to 2x the average volume. This confirms that the move has participation, not just a few traders pushing price around. Relative volume (RVOL) is one of the best technical indicators for this purpose.
VWAP (Volume Weighted Average Price) serves as a dynamic support/resistance level that many institutional traders watch. A stock consolidating just below VWAP and then breaking above it with volume often triggers algorithmic buying. Similarly, moving averages like the 20-period or 50-period MA can act as launching pads for breakout moves. When price consolidates at these levels and then breaks higher, it often attracts momentum traders.
False breakouts are the enemy of breakout trading. These occur when price briefly breaks resistance but quickly reverses back below it, trapping breakout buyers. To filter false breakouts, look for: sustained price action above the breakout level (not just a single candle wick), strong volume on the breakout candle, and follow-through in subsequent candles. A true breakout should show conviction, not hesitation.
The ascending triangle pattern is particularly reliable for breakout trading because it shows buyers becoming increasingly aggressive (higher lows) while sellers defend a specific level (flat resistance). When buyers finally break through, there's often little resistance above, leading to strong momentum moves. Bull flags and pennants work similarly, they represent brief consolidations within a larger uptrend before the next leg higher.
Rather than trying to memorize dozens of patterns, focus on the underlying principle: compression leads to expansion. Tight consolidation near resistance, declining volatility, and building volume are your pre-breakout checklist. When you see these conditions, add the stock to your watchlist and prepare for the breakout.
3. Validate Breakout Setups with Backtest Data
Not all breakout patterns are created equal. Some have win rates above 60%, while others barely break even. The difference between profitable breakout trading and frustration is knowing which setups actually work, and that requires backtesting strategies.
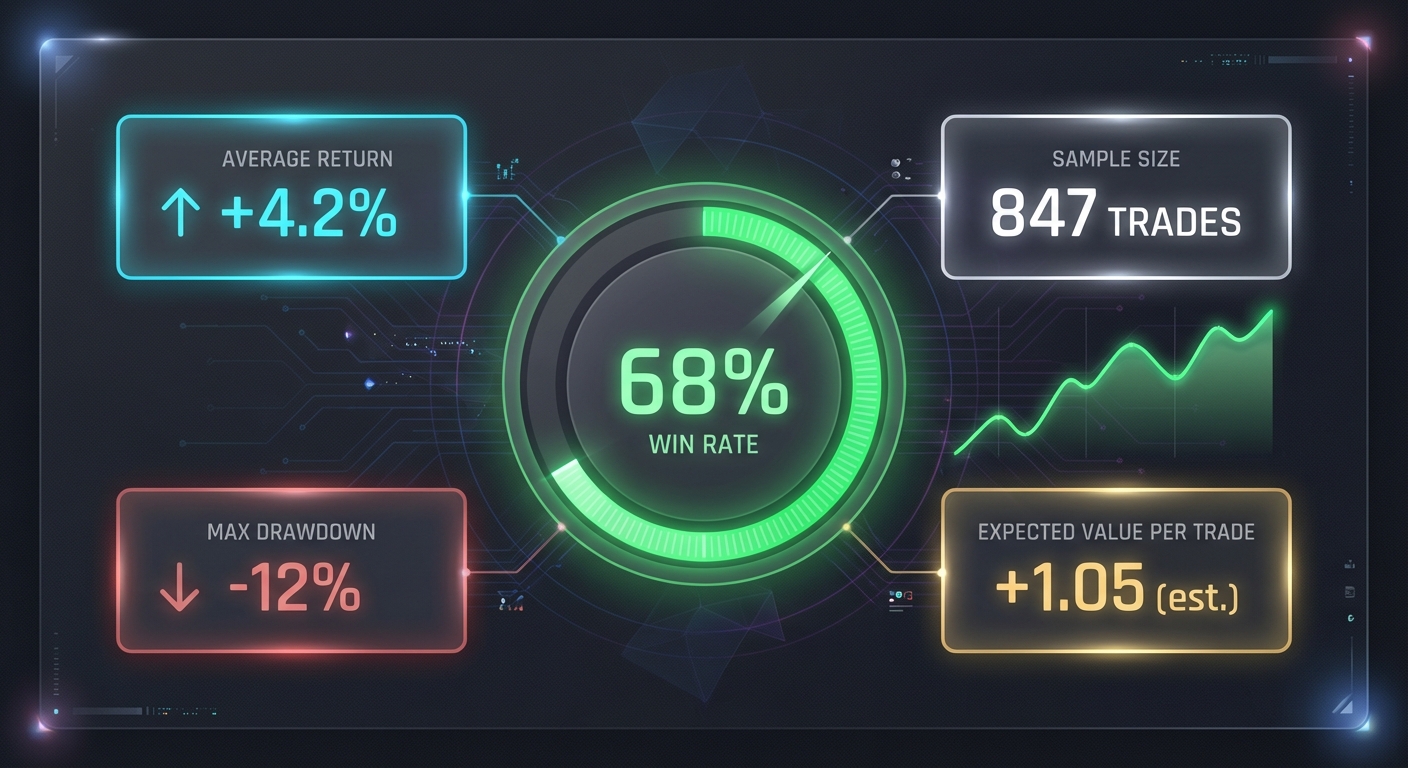
Backtesting means analyzing historical data to see how a specific setup has performed in the past. For breakout trading, you want to know: What's the win rate? What's the average return per trade? What's the expected value (EV) after accounting for losses? What's the maximum drawdown? These metrics tell you whether a pattern is worth trading or just looks good on a chart.
For example, a horizontal resistance breakout with RVOL above 2.0 might have a 58% win rate with an average gain of 4.2% on winners and an average loss of 2.1% on losers. That gives you a positive expected value and tells you the setup is tradeable. Compare that to a breakout without volume confirmation, which might have a 45% win rate and negative EV. Same pattern, different outcome, and the difference is in the data.
The challenge is that most traders don't have access to backtest data. Running your own backtests requires coding skills, historical data subscriptions, and significant time investment. This is where platforms like ChartMath provide a major advantage: every technical screen comes with built-in backtest statistics showing historical win rates, average returns, and expected value per trade.
When evaluating backtest data for breakout trading, pay attention to sample size. A setup with a 70% win rate based on 15 trades isn't statistically significant. Look for patterns with at least 100+ historical occurrences to ensure the data is meaningful. Also consider the timeframe, a setup that worked well in 2020's bull market might perform differently in 2026's market conditions.
Use backtest data to prioritize your watchlist. If you're tracking 20 potential breakout setups, focus on the ones with the highest expected value and win rates. This doesn't guarantee success on any individual trade, but over time, trading high-probability setups with positive EV is the path to consistent profitability. Data-driven decision making beats gut feeling every time.
4. Configure Real-Time Breakout Trading Alerts
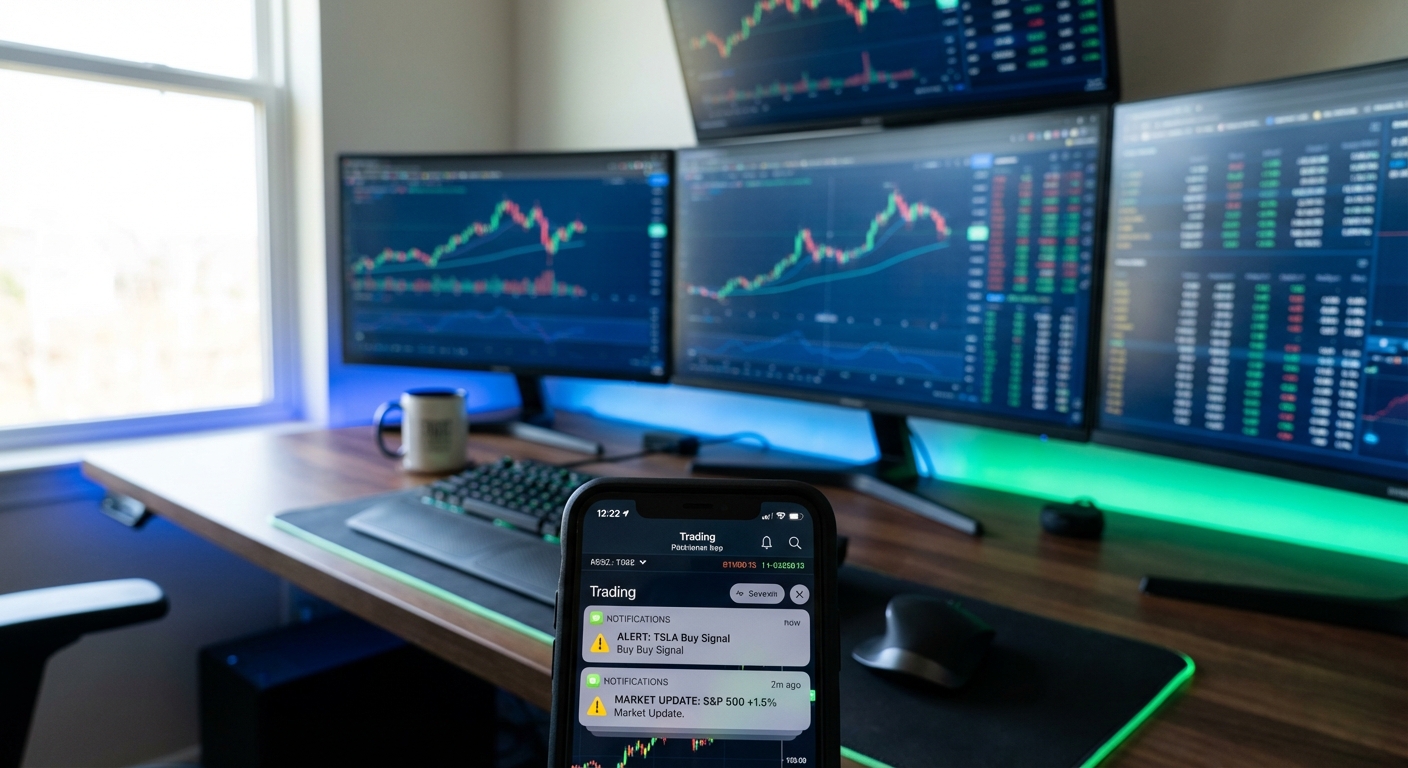
Even with the best scanning system, you can't watch screens 24/7. This is where trading alerts become essential, but not just any alerts. Most traders suffer from alert fatigue: dozens of notifications throughout the day, most of which are low-quality or arrive too late to act on. The key is configuring alerts that trigger at the right moment with the right context.
Effective breakout trading alerts should trigger when specific conditions are met: price breaks above resistance, volume exceeds a threshold, and confirmation candles close above the breakout level. The alert should reach you immediately, not 10 minutes later when the move is already over. Mobile push notifications are ideal because they reach you wherever you are, whether you're in a meeting, commuting, or away from your trading desk.
The problem with most alert systems is they tell you what happened but not why it matters. You get a notification that "XYZ broke above $50" but no context about whether this is a high-probability setup or just noise. Quality-filtered alerts solve this by only notifying you when setups meet specific criteria, like a breakout with RVOL above 1.5, price above VWAP, and a historical win rate above 55%.
Custom watchlists are crucial for tracking stocks you're specifically interested in. Rather than getting alerts for every breakout in the market, you can monitor a curated list of 10-20 stocks that meet your criteria. When one of your watchlist stocks triggers a breakout setup, you get an alert with full context: what pattern formed, what timeframe, what the backtest data shows, and why the setup triggered now.
ChartMath's alert system provides plain-English explanations with every notification. Instead of just "AAPL breakout," you get "AAPL broke above 15-day resistance with 2.1x average volume on the daily chart. This setup has a 62% win rate with +3.8% avg return over 147 historical occurrences." That context helps you make informed decisions quickly, without having to pull up charts and do your own analysis.
To avoid alert fatigue, start with conservative filters and gradually expand. Begin with only the highest-quality setups on your watchlist, then add broader market scans as you get comfortable with the workflow. The goal is to receive 5-10 high-quality alerts per day that you can actually act on, not 50 notifications that you learn to ignore. For more on integrating alerts with your existing setup, check out how to integrate trading alerts with your charting platform.
5. Execute Breakout Trades with Proper Risk Management
Identifying breakout trading opportunities is only half the battle. Execution and risk management determine whether you actually profit from the setups you find. Even the best breakout pattern can result in losses if you enter too late, size your position incorrectly, or fail to manage risk.
The entry timing debate in breakout trading comes down to two approaches: entering on the initial breakout or waiting for confirmation. Entering on the breakout means buying as price crosses resistance, which gets you in early but exposes you to false breakouts. Waiting for confirmation means letting the first breakout candle close and entering on the next candle, which reduces false breakouts but means you miss some of the move. Neither approach is wrong, choose based on your risk tolerance and trading style.
Stop-loss placement is critical for breakout trading. The logical stop level is just below the breakout point, if price breaks resistance and then falls back below it, the setup has failed and you should exit. For a horizontal resistance breakout at $50, you might place your stop at $49.50 or $49.75, depending on the stock's volatility. This keeps your risk defined and prevents small losses from becoming large ones.
Position sizing should be based on your stop distance and account risk tolerance. If you're risking 1% of your account per trade and your stop is $0.50 away from your entry, you can calculate exactly how many shares to buy. Never size positions based on how confident you feel about a trade, use math. A stock with higher volatility requires a wider stop, which means a smaller position size to maintain the same dollar risk.
Profit targets for breakout trading depend on the pattern and timeframe. For intraday breakouts, targets of 2-5% are realistic. For daily breakouts, you might target 10-20% or more. A common approach is to take partial profits at a 2:1 or 3:1 reward-to-risk ratio and let the remainder run with a trailing stop. This locks in gains while giving winners room to develop into larger moves.
Common execution mistakes include chasing breakouts after they've already moved significantly (FOMO entries), entering without volume confirmation, ignoring your stop-loss when the trade goes against you, and over-trading low-quality setups. Discipline matters more than pattern recognition. A mediocre trader who follows their rules consistently will outperform a brilliant trader who lacks discipline.
6. Monitor Multiple Breakout Trading Opportunities Simultaneously
On any given trading day, dozens of stocks might be setting up for breakout trading opportunities across different timeframes. The challenge isn't finding setups, it's prioritizing which ones deserve your attention and capital. You can't trade everything, so you need a system for ranking and monitoring multiple opportunities simultaneously.
Quality over quantity is the guiding principle. A single high-probability breakout with strong volume, clear resistance, and positive backtest data is worth more than five marginal setups that barely meet your criteria. When evaluating multiple opportunities, prioritize based on: setup quality (how clean is the pattern?), timeframe alignment (does it work on multiple timeframes?), volume confirmation, and historical performance data.
Freshness matters too. A breakout that triggered 10 minutes ago on the 5-minute chart might already be extended, while one that just formed offers a better entry. Real-time ranking systems that surface the newest, highest-quality setups first help you focus on actionable opportunities rather than stale signals. This is where a swipe-based interface becomes powerful, you can quickly review ranked setups and decide which ones to act on.
ChartMath's TikTok-style discover feed solves the prioritization problem by ranking setups based on quality scores and freshness. Instead of scrolling through endless lists of stocks, you swipe through the best opportunities first. Each card shows the chart pattern, timeframe, backtest statistics, and a plain-English explanation of why it triggered. This lets you evaluate multiple breakout trading setups in seconds rather than minutes.
Integration with your existing charting platform is important. You don't need to abandon TradingView, Thinkorswim, or whatever platform you use for execution. Instead, use a scanning tool like ChartMath as a companion app that feeds you opportunities, then switch to your charting platform for detailed analysis and order entry. The mobile-first design means you can monitor setups on your phone while keeping your desktop focused on execution.
For traders who want to dive deeper into screening strategies, our guide on how to use stock screeners for day trading covers additional filtering techniques and workflow optimization.
Common Breakout Trading Mistakes and How to Avoid Them
Even experienced traders fall into predictable traps when it comes to breakout trading. Recognizing these mistakes helps you avoid them and improve your win rate over time.
Chasing breakouts is the most common error. You see a stock up 6% and breaking out, so you jump in without checking where it is relative to resistance. By the time you enter, the easy money has been made and you're buying at the top of the initial surge. Solution: Set alerts for stocks approaching resistance, not after they've already broken out. Enter early or wait for a pullback to the breakout level.
Ignoring volume leads to trading false breakouts. A stock can break resistance on light volume, but without participation, the move typically fails. Always confirm breakouts with volume spikes, ideally 1.5x to 2x average volume or higher. If volume is weak, the breakout is suspect. Wait for confirmation or skip the trade entirely.
Over-trading low-quality setups happens when you're bored or feel like you need to be in a trade. Not every breakout deserves your capital. If a setup doesn't meet your criteria, clean pattern, volume confirmation, positive backtest data, don't force it. The best traders are selective. They wait for A+ setups and pass on everything else.
Missing breakouts due to manual scanning is a time management problem. If you're manually cycling through charts, you'll inevitably miss opportunities. The solution is automation: use stock screening apps and real-time alerts to monitor the market for you. This frees you to focus on analysis and execution rather than data gathering.
Lacking a systematic approach means your results are inconsistent. One day you trade ascending triangles, the next day you chase momentum without any pattern. Consistency comes from having a defined process: specific patterns you trade, specific entry and exit rules, specific risk management parameters. Write down your system and follow it. Track your results. Refine based on data, not emotions.
Start Catching Breakout Trading Opportunities Today
Catching breakout trading opportunities in real-time doesn't require superhuman focus or expensive infrastructure. It requires a systematic approach: automated scanning across multiple timeframes, intelligent alerts that trigger at the right moment, backtest data to validate setups, and disciplined execution with proper risk management.
The workflow we've covered in this guide gives you a repeatable process for identifying and capitalizing on breakout trading setups before they happen. Set up multi-timeframe scanning to monitor the entire market. Learn to recognize high-probability patterns before they trigger. Validate setups with historical performance data. Configure quality-filtered alerts that reach you wherever you are. Execute with defined risk parameters. And monitor multiple opportunities simultaneously using ranked feeds that surface the best setups first.
The difference between missing breakouts and catching them consistently is having the right tools working for you. Manual scanning and generic alerts leave you constantly playing catch-up. Automated scanning with intelligent filtering puts you ahead of the move, not chasing it.
ChartMath was built specifically for this workflow: 200+ technical screens running in real-time, backtest data for every setup, mobile alerts with plain-English explanations, and a swipe-based interface that surfaces the highest-quality breakout trading opportunities first. Whether you're a day trader looking for intraday momentum or a swing trader hunting multi-day breakouts, the platform helps you stop missing entries and start catching moves early.
Ready to see how real-time breakout scanning works in practice? Watch the demo to see how ChartMath identifies breakout trading setups across multiple timeframes, validates them with backtest data, and delivers timely alerts that help you make better trading decisions. Stop refreshing screeners manually and start catching breakout trading opportunities before they happen.

Ankush Jindal
LinkedInSee these setups live in ChartMath
200+ curated screens with backtest data. 14-day free trial.