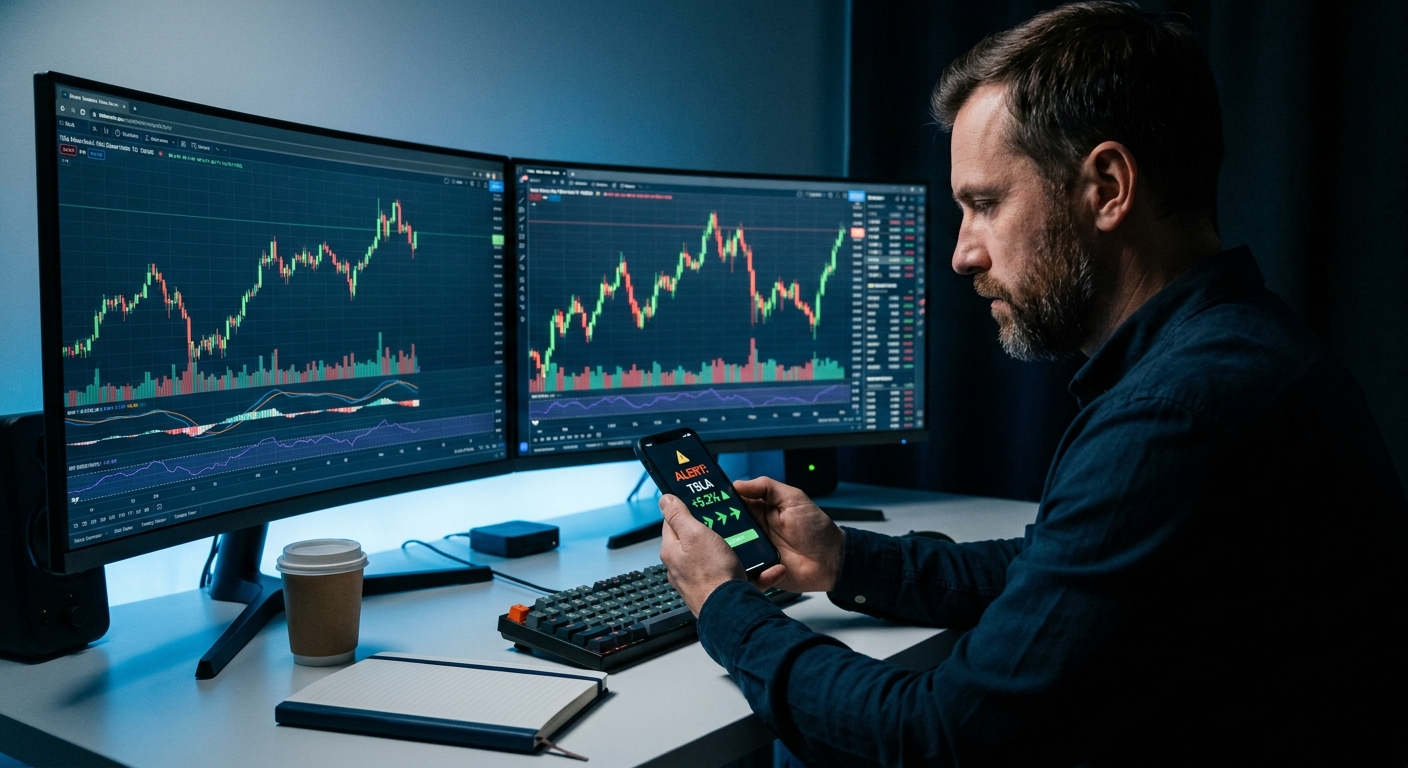
Daily Chart Swing Trade Setups: A Scanner Workflow
Most swing traders with day jobs already know which setups they want to trade. The problem isn't knowledge — it's execution. Specifically, it's the gap between knowing a clean daily chart breakout is forming somewhere in the market and actually finding it before the move is halfway done.
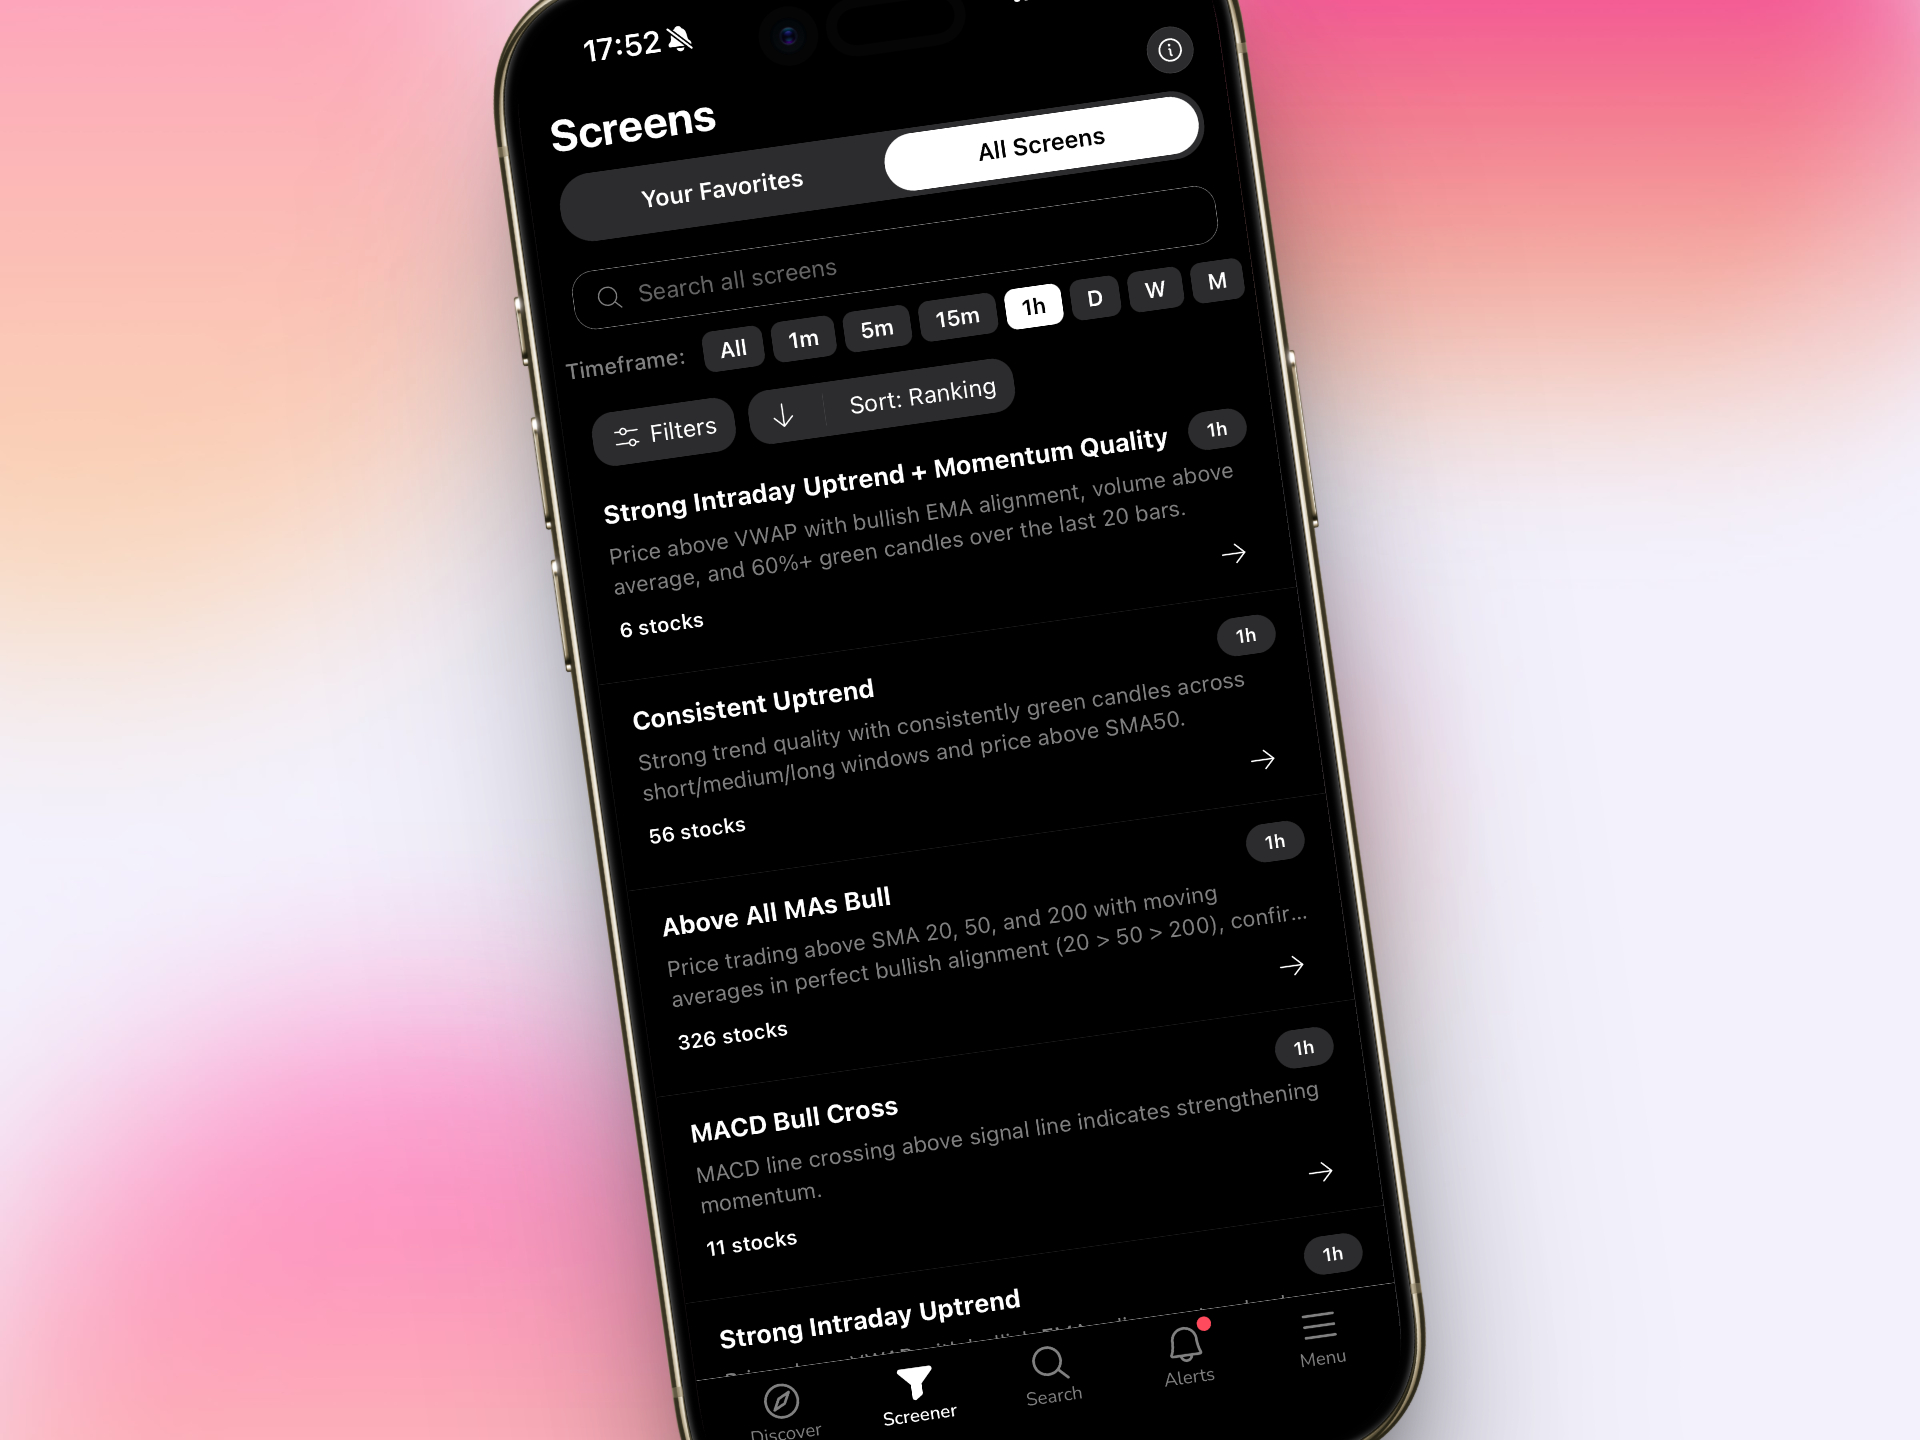
This guide walks through a scanner-powered workflow built around daily chart setups: how to filter for the right patterns, how to get stock alerts to your phone while at work, and how to run a complete end-of-day review in under 30 minutes. No Pine Script. No staring at screens all day. Just a repeatable system that surfaces the best swing trade candidates and puts them in your pocket.

Why Daily Charts Are the Sweet Spot for Swing Traders with Day Jobs
There's a reason experienced swing traders gravitate toward the daily timeframe. Each candle represents a full day of price action — all the intraday noise, the fake breakouts, the stop hunts, compressed into a single bar. What's left is the signal.
For traders who can't watch screens from 9:30 AM to 4:00 PM, this is a structural advantage. A daily chart setup that starts forming on Monday doesn't disappear by Tuesday morning. You have time to spot it, validate it, and set your entry order before the market opens, without needing to be glued to a Level 2 feed.
Compare that to a 5-minute chart, where a momentum setup can trigger, run, and reverse before you finish your next meeting. The daily timeframe is forgiving in a way that intraday charts simply aren't. That's not a consolation prize for part-time traders, it's a genuine edge.
The challenge, of course, is discovery. There are roughly 8,000 tradable U.S. equities. Manually scanning even a fraction of them every evening for clean daily setups is exhausting and inconsistent. That's where automated daily chart screeners change the game entirely. For a deeper look at how to structure your overall trading routine around a day job, the Swing Trading for Busy Professionals: 30-Minute Daily Guide is worth bookmarking.
The 3 Daily Chart Setups Worth Scanning For
Not every technical pattern translates well to the daily timeframe. These three do, and each has a distinct risk-reward profile that suits different holding periods and risk tolerances.
Breakout Setups
A stock that has been consolidating below a key resistance level for several weeks, then closes above it on above-average volume, is one of the cleanest setups in swing trading. The daily chart makes these easy to spot because the consolidation zone is clearly defined. Your scanner should flag stocks where price is within 1, 3% of a multi-week high and RVOL (relative volume) is elevated. For a detailed breakdown of how volume confirms breakouts, see the guide on catching breakout trading opportunities in real time.
Momentum Continuation
These are stocks already in a confirmed uptrend, trading above their 20-day and 50-day moving averages, that pull back to a key support level and resume higher. The daily chart gives you a clear picture of the trend structure. Your scanner filters for MA alignment, a controlled pullback (not a breakdown), and a resumption candle with volume. Holding period is typically 5, 15 trading days.
RSI Divergence / Momentum Divergence
When price makes a new low but RSI makes a higher low, the selling pressure is weakening. On a daily chart, this divergence can precede a meaningful reversal. These setups require more patience, you're often entering before the crowd, but the risk-reward can be exceptional when the divergence resolves. A good screener will flag these automatically so you don't have to eyeball every chart manually.
Each of these setups has a different character. Breakouts are high-momentum, higher-risk entries. Momentum continuations are trend-following with defined pullback risk. Divergence plays are contrarian with wider stops. Knowing which you're trading before you enter is half the battle. The 15 Proven Technical Setups Every Day Trader Should Know covers the full spectrum if you want to expand your playbook.
1. Build Your Daily Chart Scanner Filters
A scanner is only as good as its filters. The goal is to narrow 8,000 tickers down to a shortlist of 5, 15 high-quality candidates each evening, without spending two hours doing it.
Universe Filters (Apply First)
Before any technical criteria, define the universe of stocks you're willing to trade. Common parameters for swing traders include:
- Price: $5–$500 (avoids penny stocks and illiquid names)
- Average daily volume: 500,000+ shares (ensures you can enter and exit cleanly)
- Market cap: $500M+ (reduces manipulation risk)
Technical Filters (Layer In)
Once your universe is defined, apply the technical criteria that match your setup type:
- For breakouts: Price within 2% of 52-week high, RVOL > 1.5x, closing above prior resistance
- For momentum continuation: Price above 20-day and 50-day MA, RSI between 50, 70, pullback of 5, 10% from recent high
- For divergence plays: RSI making higher lows while price makes lower lows, near key support
Why Pre-Built Screens Beat Building From Scratch
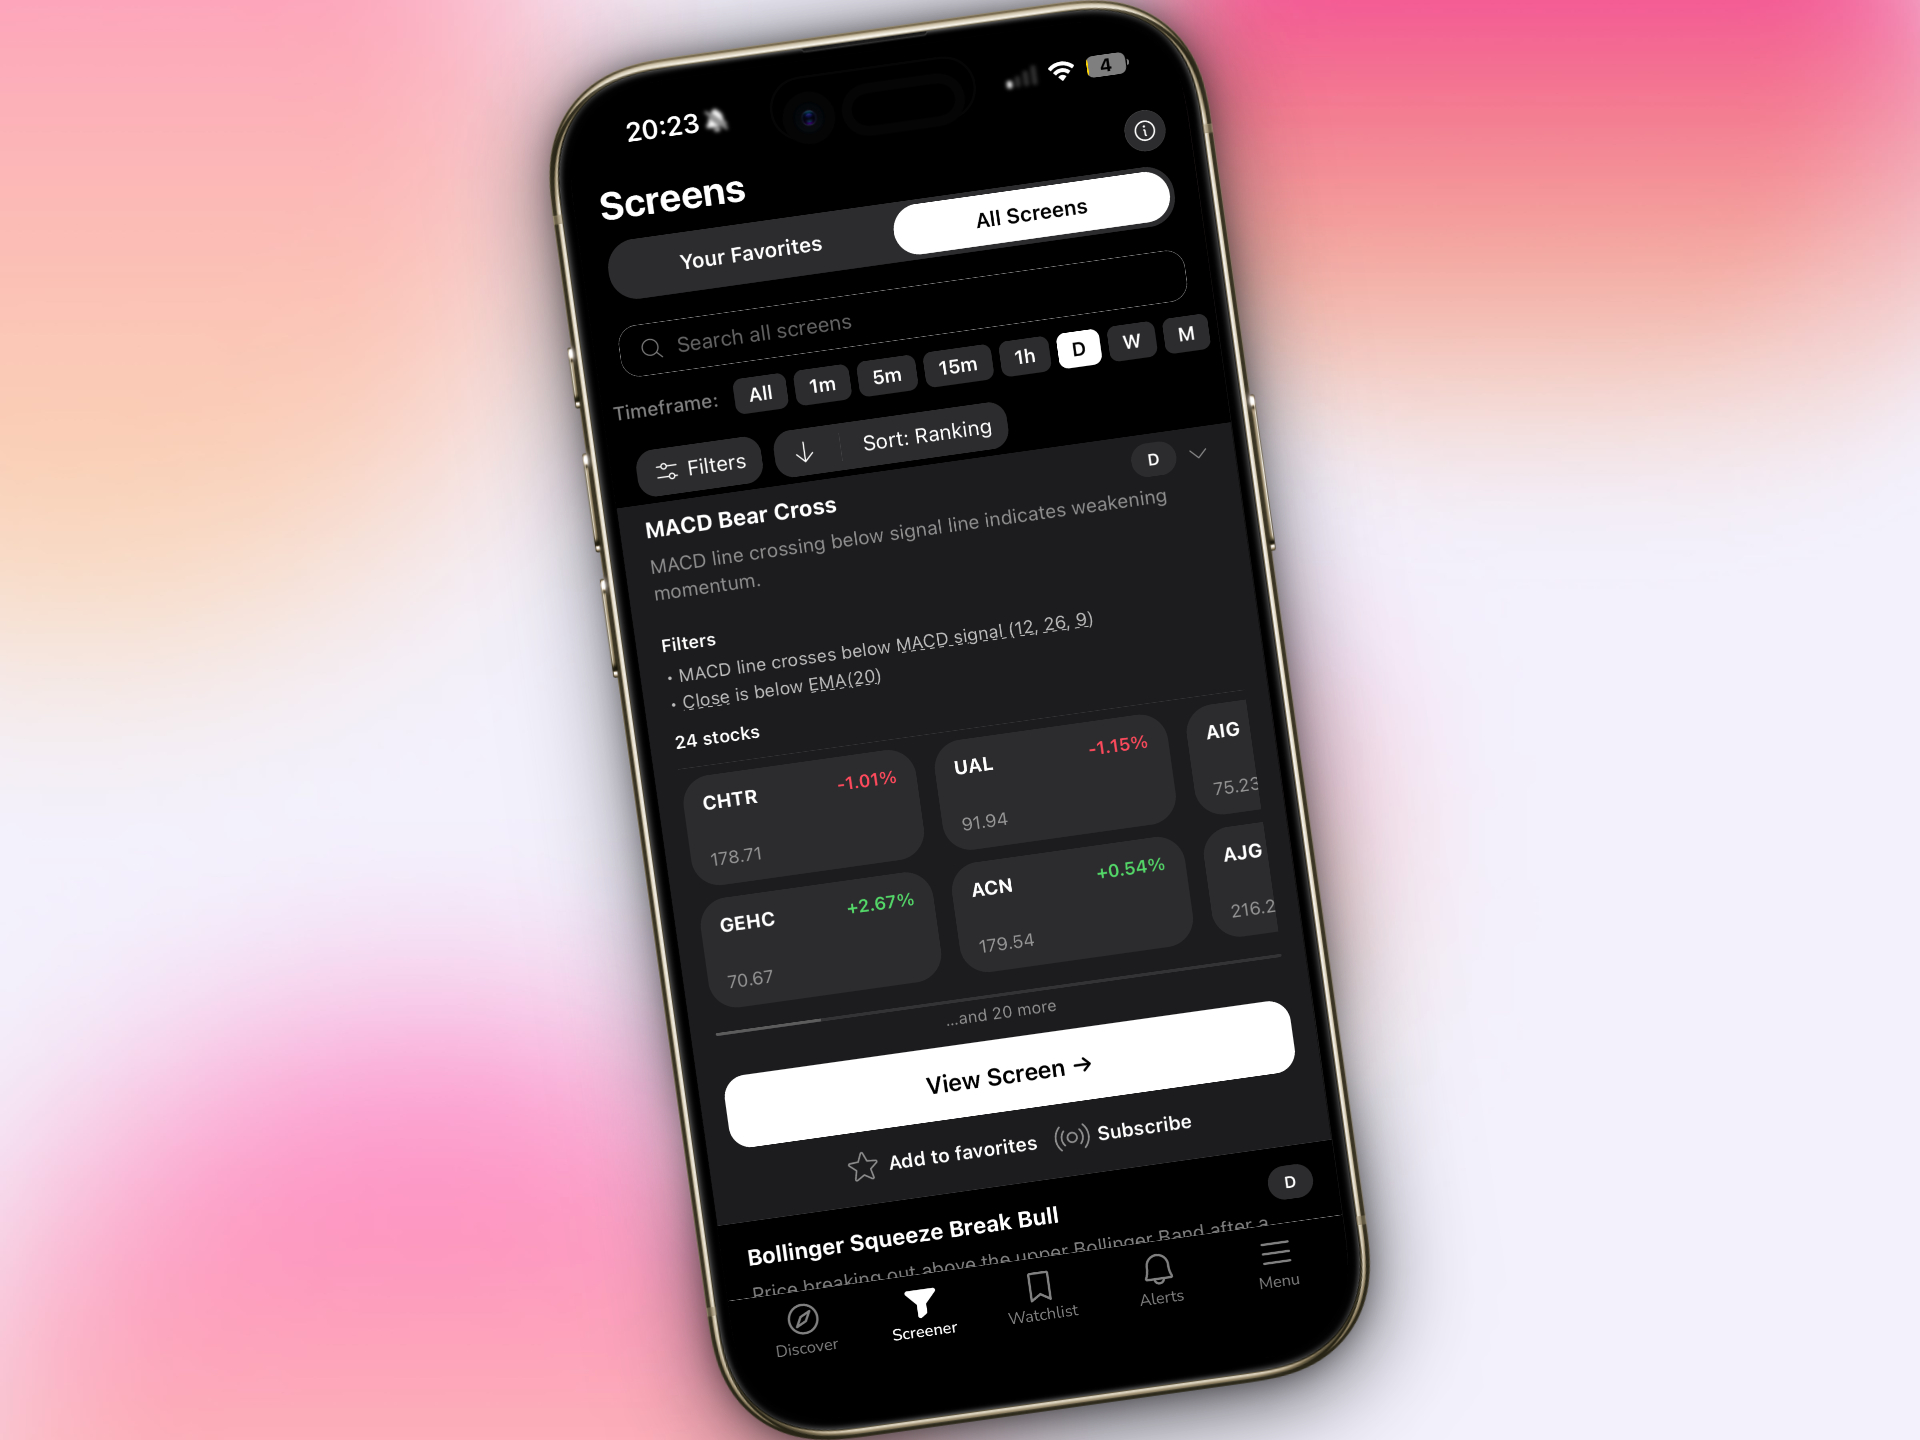
Building these filters from scratch on most platforms requires either coding knowledge (Pine Script on TradingView, for example) or hours of manual configuration. ChartMath's 200+ pre-built technical screens cover all three setup types, and dozens more, without requiring a single line of code. You pick the screen, set your universe preferences, and the scanner does the rest. For traders who want to understand how screeners work under the hood before committing to one, How to Use Stock Screeners for Day Trading in 2026 is a solid starting point.
2. Set Up Alerts That Reach Your Phone While You're at Work
Finding the right scanner filters is step one. Step two, the one most traders skip, is making sure those filters actually notify you when a setup triggers during market hours, not just when you log in at 7 PM.
This is where the "stock alerts to your phone while at work" piece becomes critical. A screener that only shows results when you open the app is a passive tool. What you need is a proactive one, a system that monitors the market continuously and pushes a notification the moment a daily setup triggers, whether you're in a meeting, on a call, or away from your desk.
What a Good Mobile Alert Actually Looks Like
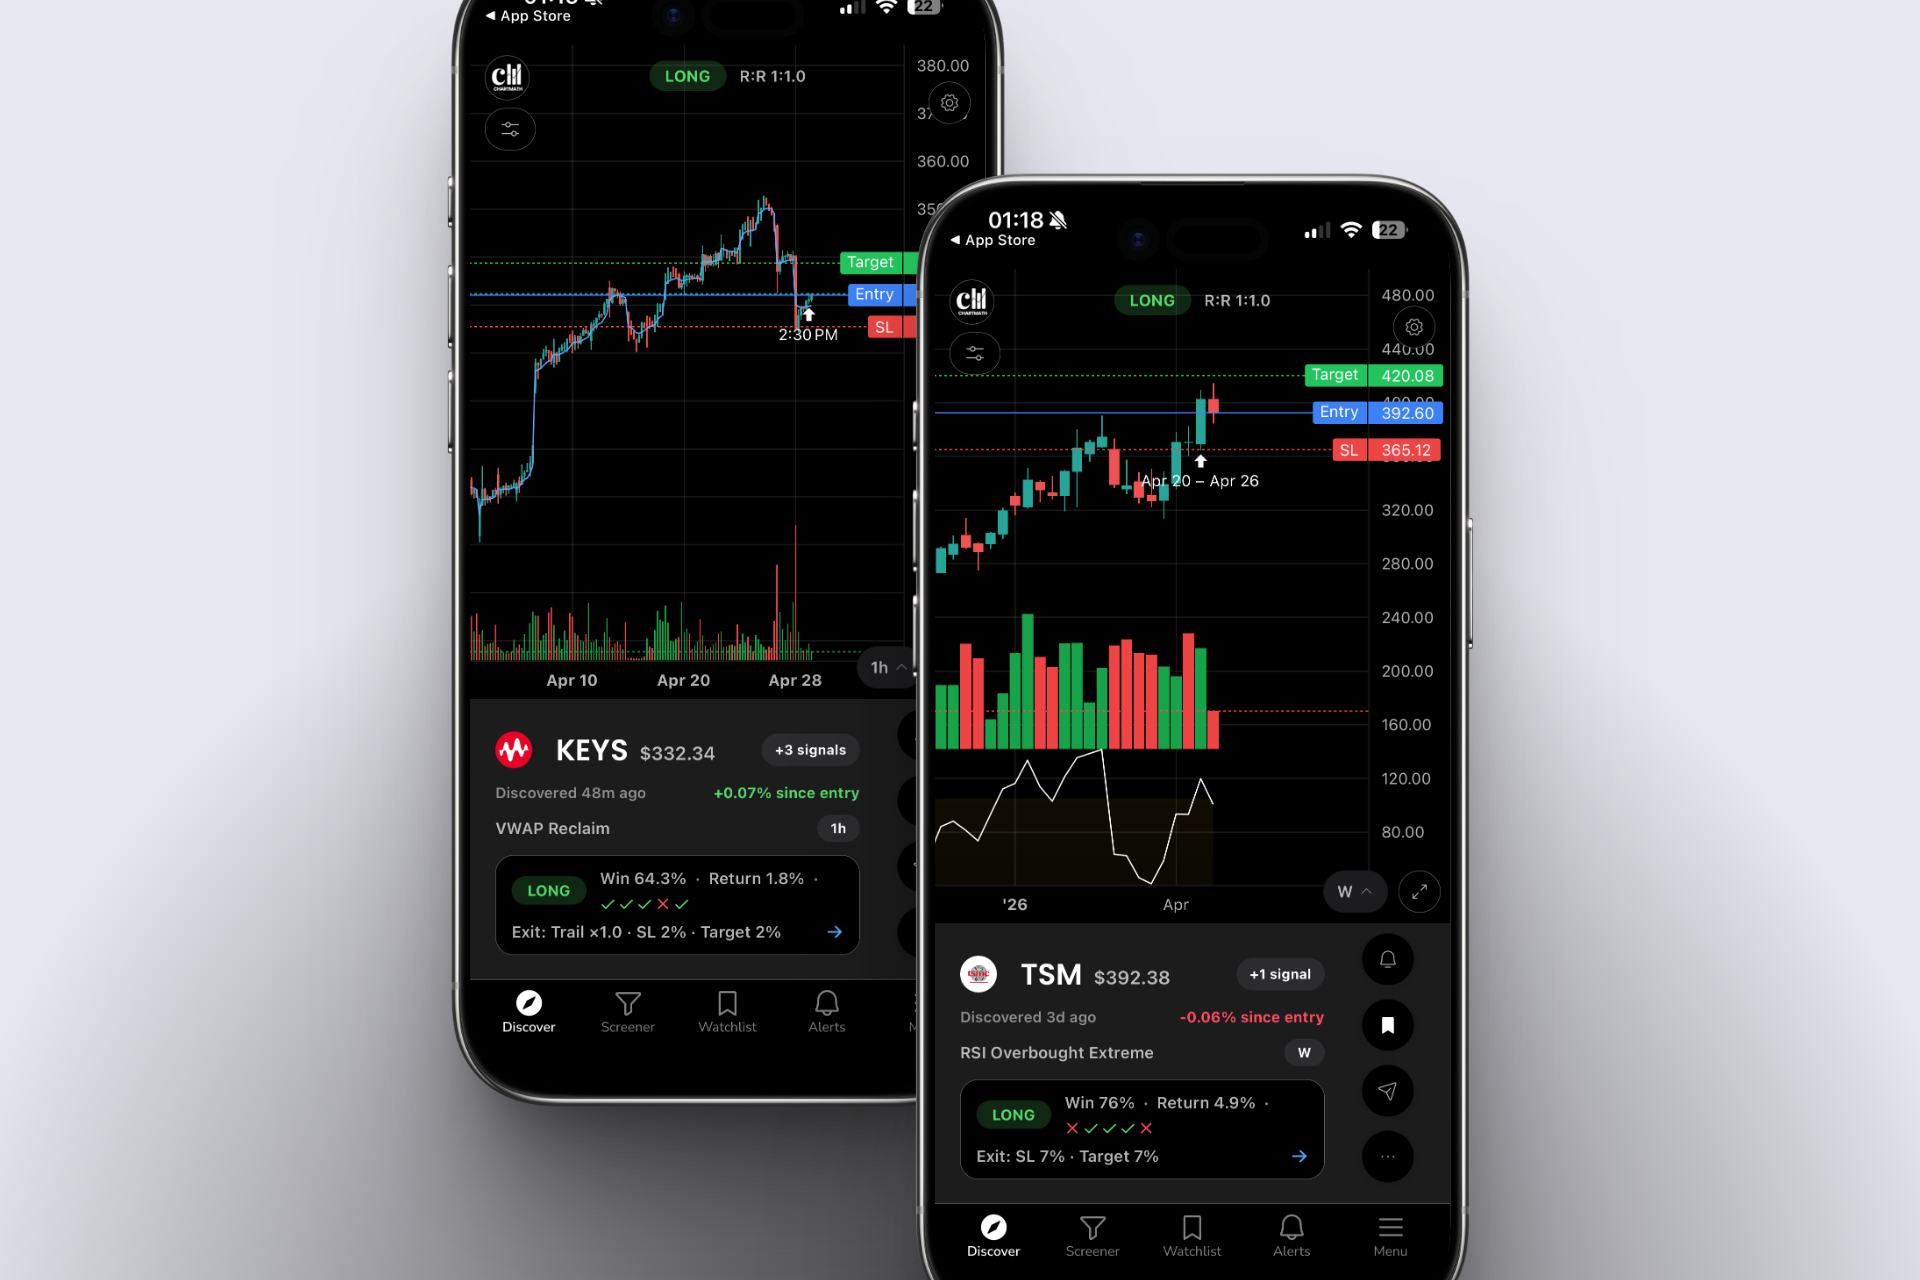
Not all push alerts are created equal. A generic "AAPL triggered your alert" notification tells you almost nothing actionable. A well-designed alert should include:
- The ticker and setup name, so you know immediately what triggered
- Why it triggered, plain-English explanation of the specific criteria met
- Backtest context, historical win rate and average return for this setup type
- A chart snapshot, so you can evaluate the setup at a glance without opening a separate platform
ChartMath's explainable push alerts are built around this model. Each alert tells you in plain English why the setup triggered and surfaces the backtest data behind it, so you can make a quick, informed decision from your phone without needing to pull up TradingView mid-meeting.
Avoiding Alert Fatigue
The flip side of real-time alerts is noise. Platforms that fire 200 alerts a day train you to ignore them. The solution isn't fewer screens, it's smarter filtering. Prioritize quality over quantity: a scanner that sends 5 high-conviction alerts with context beats one that sends 50 generic pings. If you've dealt with alert overload before, the post on integrating trading alerts with your charting platform covers how to layer alerts intelligently without drowning in noise.
3. Run Your End-of-Day Review in Under 30 Minutes
The end-of-day review is where swing traders with day jobs do their best work. The market is closed, the noise is gone, and you can evaluate setups with a clear head. Here's a step-by-step process that takes 30 minutes or less.
Step 1: Check Your Alerts (5 minutes)
Open ChartMath and review the alerts that fired during the day. For daily chart setups, focus on anything that triggered in the last hour of trading, these are the setups most likely to follow through the next morning. Dismiss anything that triggered early and has already moved significantly.
Step 2: Validate Each Setup (15 minutes)
For each alert that looks interesting, pull up the daily chart in your charting platform of choice (TradingView, TrendSpider, or wherever you do your analysis). Check:
- Is the pattern clean? No messy wicks, no obvious overhead resistance immediately above entry
- Is volume confirming? A breakout on below-average volume is a yellow flag
- Is the broader market supportive? A breakout in a weak tape is a lower-conviction trade
- Does the risk-reward work? Define your stop and target before you decide to trade it
Step 3: Build Your Shortlist (5 minutes)
Narrow your validated setups down to 2, 5 highest-conviction candidates. These go on your active watchlist for tomorrow. For each one, note your planned entry (limit order or market on open), stop level, and initial target.
Step 4: Set Your Orders (5 minutes)
Place limit orders or alerts for your entry levels before you close your laptop. This is the step most traders skip, and it's the one that separates traders who execute from traders who watch. If you're not sure how to structure this workflow from scratch, How to Build an Efficient Trading Workflow in 2026 walks through the full system.
4. Validate Every Setup With Backtest Data Before You Enter
Here's a question worth asking before every trade: has this setup actually worked historically, or does it just look good on this one chart?
Most traders skip this step because getting backtest data used to require either coding skills or expensive software. That's changed. ChartMath surfaces historical performance data, win rate, average return, max drawdown, sample size, alongside every alert and every pre-built screen. You can see, before you enter, whether a given setup has a positive expectancy over hundreds of historical occurrences.
What to Look For in Backtest Results
- Win rate: 50, 60% is solid for swing setups with good risk-reward. Don't chase 80%+, it usually means the sample size is tiny or the backtest is curve-fitted.
- Average return per trade: Should be meaningfully larger than the average loss. A 55% win rate with a 2:1 reward-to-risk ratio is a strong edge.
- Sample size: Look for 50+ historical occurrences. Fewer than 20 is statistically unreliable.
- Max drawdown: Tells you the worst historical losing streak. Make sure it's within your psychological tolerance.
For a deeper dive into reading and interpreting backtest results, the complete guide to building winning backtesting strategies covers everything from methodology to avoiding common pitfalls.
5. Manage Your Watchlist So the Scanner Does the Heavy Lifting
There are two ways to use a scanner. The first is reactive: you open it each evening, run a scan, and see what comes up. The second is proactive: you build a watchlist of stocks you're already interested in and let the scanner notify you the moment one of them matches a specific setup.
The second approach is more powerful for swing traders with day jobs, because it means you're not starting from scratch every evening. You're monitoring a curated list of names you already know, and the scanner is doing the watching while you're at work.
Curating a Focused Watchlist
A watchlist of 200 tickers is just a smaller version of the whole market. Keep it tight: 20, 50 stocks you've researched, understand the business of, and have identified as technically interesting. Rotate names in and out as setups develop or fail.
Setup-Based Notifications
The real power comes from pairing your watchlist with setup-specific alerts. Instead of "notify me when NVDA moves 2%," you configure: "notify me when NVDA triggers a daily momentum continuation setup with RVOL above 1.5x." That's the difference between a price alert and a trade alert. ChartMath's watchlist tracking lets you assign any of its 200+ screens to individual tickers, so you only get notified when a stock on your list matches a setup you'd actually take.
Using ChartMath as a Discovery Layer
If you're already paying for TradingView or TrendSpider, you don't need to replace them. ChartMath is designed to work alongside your existing charting platform as a discovery layer, it finds the setups across the whole market, pushes them to your phone, and then you do your deeper analysis in whatever platform you prefer. No duplication, no switching costs. The scanner finds; your charting platform confirms.
A Sample 30-Minute Daily Workflow (Morning + Evening)
Theory is useful. A concrete schedule is more useful. Here's how a swing trader with a 9-to-5 might structure their trading day around daily chart setups and mobile alerts.
Morning (5 minutes, before work)
Check ChartMath for any overnight alerts or pre-market signals on your watchlist. Note any daily setups that triggered after yesterday's close. If you set limit orders the night before, confirm they're still valid given any overnight news. This takes 5 minutes on your phone before you leave the house.
Midday (5 minutes, optional)
If your schedule allows a lunch break glance, check for any intraday breakout alerts on your watchlist stocks. Daily chart setups don't usually require midday action, but if a stock on your shortlist is breaking out intraday, you might want to know. This is optional, the system works fine without it.
Evening (20 minutes, after market close)
This is the core session. Run through the full end-of-day review described in Step 3 above: check alerts, validate setups, build your shortlist, set orders. Twenty minutes of focused work replaces two-plus hours of manual scanning. The scanner did the heavy lifting during the day; you're just making the final calls.
What This Replaces
Before a workflow like this, the typical evening routine for a self-directed swing trader looks like this: open Finviz, run a scan, get 300 results, manually flip through charts for an hour, miss half the good setups because the screener only updates end-of-day, and go to bed unsure whether you found the best candidates or just the ones you happened to click on. The scanner-powered workflow cuts that down to a focused 20-minute review of pre-filtered, pre-validated setups, with backtest data attached.
Frequently Asked Questions
Can I use daily chart alerts if I can only check my phone a few times a day?
Yes, daily chart setups are specifically well-suited to this constraint. Because each candle represents a full day of price action, setups don't trigger and expire in minutes the way intraday alerts do. A daily breakout alert that fires at 2 PM is still actionable when you check your phone at 5 PM. You have time to evaluate it, pull up the chart, and set an order for the next morning's open.
What's the difference between end-of-day and real-time alerts for swing traders?
End-of-day alerts fire after the market closes and are based on the final daily candle. They're useful for identifying setups to enter the next morning. Real-time alerts fire during market hours when a setup triggers intraday, useful for catching breakouts as they happen. For swing traders, a combination of both is ideal: real-time alerts catch intraday breakouts on your watchlist, while end-of-day alerts surface new candidates for tomorrow's shortlist. ChartMath supports both modes.
Do I need to cancel my TradingView subscription to use ChartMath?
No. ChartMath is designed as a discovery layer that works alongside TradingView, TrendSpider, Finviz, or any other charting platform you already use. ChartMath finds and surfaces setups across the whole market; your existing platform handles the deeper chart analysis. Most users keep both, they're solving different problems.
How many alerts per day should I expect from a daily chart scanner?
That depends on your filter settings and watchlist size. A well-configured daily chart scanner focused on high-quality setups should surface 5, 20 alerts per day across the full market, or 2, 8 alerts if you're running it against a focused watchlist of 30, 50 stocks. If you're getting 100+ alerts a day, your filters are too loose. Quality over quantity is the goal, each alert should represent a setup you'd genuinely consider trading.
Which technical indicators work best on daily charts for swing trading?
The most reliable daily chart indicators for swing setups are moving averages (20-day and 50-day EMA for trend context), RSI (for momentum and divergence), and relative volume (RVOL) for confirming breakouts. VWAP is less relevant on daily charts, it's primarily an intraday tool, but weekly VWAP can provide useful context. For a full comparison of these indicators, see VWAP vs RVOL vs ORB: Which Technical Indicators Work Best?
Start Getting Daily Chart Setups Delivered to Your Phone
The gap between knowing your setups and actually catching them comes down to one thing: whether your scanner is working for you while you're at work, or waiting for you to come back to it. A daily chart workflow powered by automated scanning and mobile push alerts closes that gap, you get the shortlist, not the haystack.
ChartMath scans 200+ pre-built technical screens across the full market, sends explainable push alerts the moment a daily setup triggers, and surfaces the backtest data behind every signal, all on mobile, without Pine Script, and without replacing the charting platform you already use.
See how it works in practice: watch the ChartMath demo to see a real daily chart workflow in action, or download the ChartMath app and start getting daily swing trade setups delivered to your phone today. Prefer to try the screener first? Access the web-based screener and run your first daily chart scan in minutes.

See these setups live in ChartMath
200+ curated screens with backtest data. Free. No credit card required.