How to Use Backtested Win Rate to Pick Trades
Four trades in a row go your way. You start to feel like you've found something. Then the next six don't work, and you're back to wondering whether the setup ever had an edge at all. That cycle — confidence, loss, doubt — is what happens when you trade a setup without knowing its historical numbers.
Backtested win rate is the starting point for breaking that cycle. But win rate alone is not enough. A setup that wins 75% of the time can still drain your account if the average loss is three times the average gain. To pick trades with a real, documented edge, you need to read four numbers together: Win Rate, Average Return, Expected Value (EV), and sample size. This guide walks through each one and shows you how to use them as a decision framework before you risk a dollar.
Win Rate Is One Number. It Takes Four to Make a Decision.
Win rate measures one thing: the percentage of historical occurrences of a setup that closed in profit. If a screen fired 100 times and 60 of those trades closed green, the win rate is 60%. That's useful. It tells you the setup has historically resolved in the right direction more often than not.
What it doesn't tell you is how much you made when you won, or how much you lost when you didn't. A setup with a 65% win rate where winners average 1.2% and losers average 3.8% is a losing strategy. The math is straightforward: 65 wins at 1.2% minus 35 losses at 3.8% produces a negative expected outcome per trade. You'd be right more than half the time and still lose money.
This is why most retail screeners leave traders in a worse position than they realize. Tools like Finviz surface tickers that match a filter, but they don't show you whether that filter has historically worked. You get a list with no track record attached. You're essentially trading a hypothesis with no data behind it.
The four numbers that actually matter are:
- Win Rate, how often the setup closed profitable historically
- Average Return, the mean gain or loss per occurrence
- Expected Value (EV), the probability-weighted outcome per trade, combining both
- Sample size, how many historical occurrences the above numbers are based on
None of these is sufficient on its own. All four together give you a picture of whether a setup has a documented edge worth acting on. The rest of this guide covers how to read each one and what to do when they conflict.
1. Read the Win Rate, Then Immediately Check Average Return
Win rate is the headline number, and it's the one most traders look at first. That's fine as a starting point. A win rate below 40% on a swing setup deserves scrutiny. A win rate above 60% is worth a closer look. But the moment you see the win rate, your next move should be to check the average return.
The question you're asking is: when this setup wins, how much does it typically make, and when it loses, how much does it typically lose? A setup with a 55% win rate and an average return of 4.2% per occurrence is a very different proposition from a setup with a 55% win rate and an average return of 0.6%.
A useful mental check: multiply the win rate by the average return on winners, then subtract the loss rate multiplied by the average loss. If the result is positive, the setup has historically produced a net positive outcome per trade. If it's negative or near zero, the win rate headline is misleading you.
You don't need to do that math manually. ChartMath surfaces both Win Rate and Average Return on every screen card, alongside EV, so the calculation is already done for you. But understanding why those numbers exist together is what separates a trader who uses backtest data well from one who just chases the highest win rate they can find.
For a deeper look at how backtesting frameworks work, the post on building winning backtesting strategies covers the mechanics in detail.
2. Check Expected Value, The Number That Combines Both
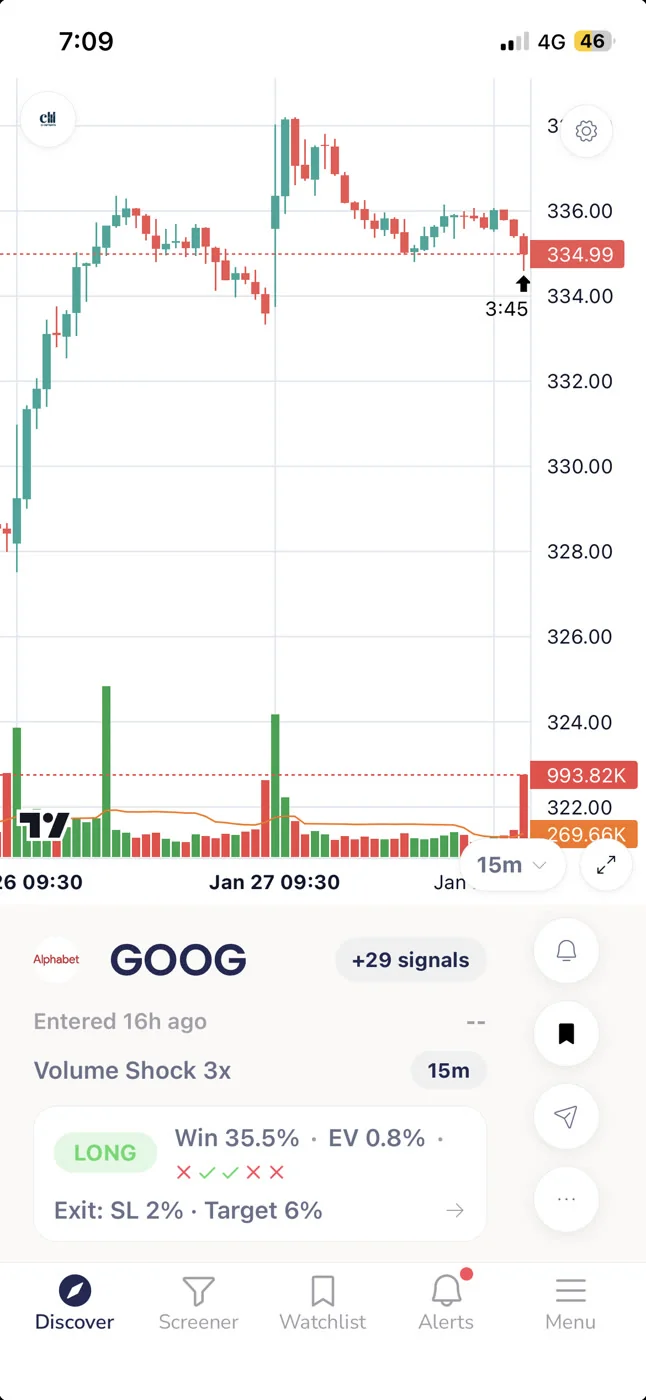
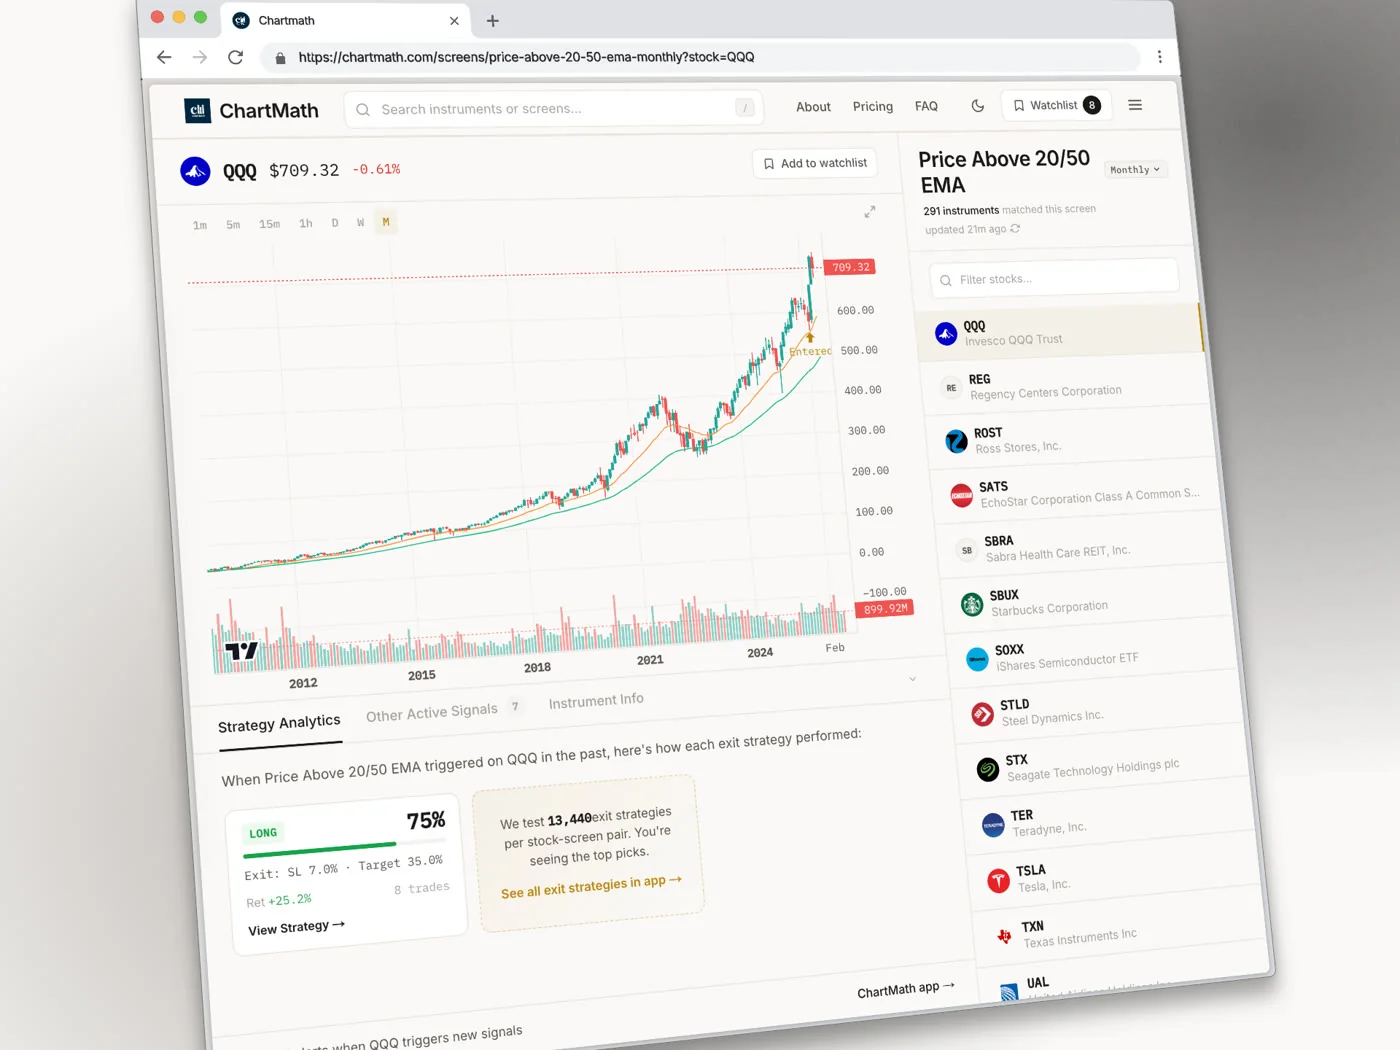
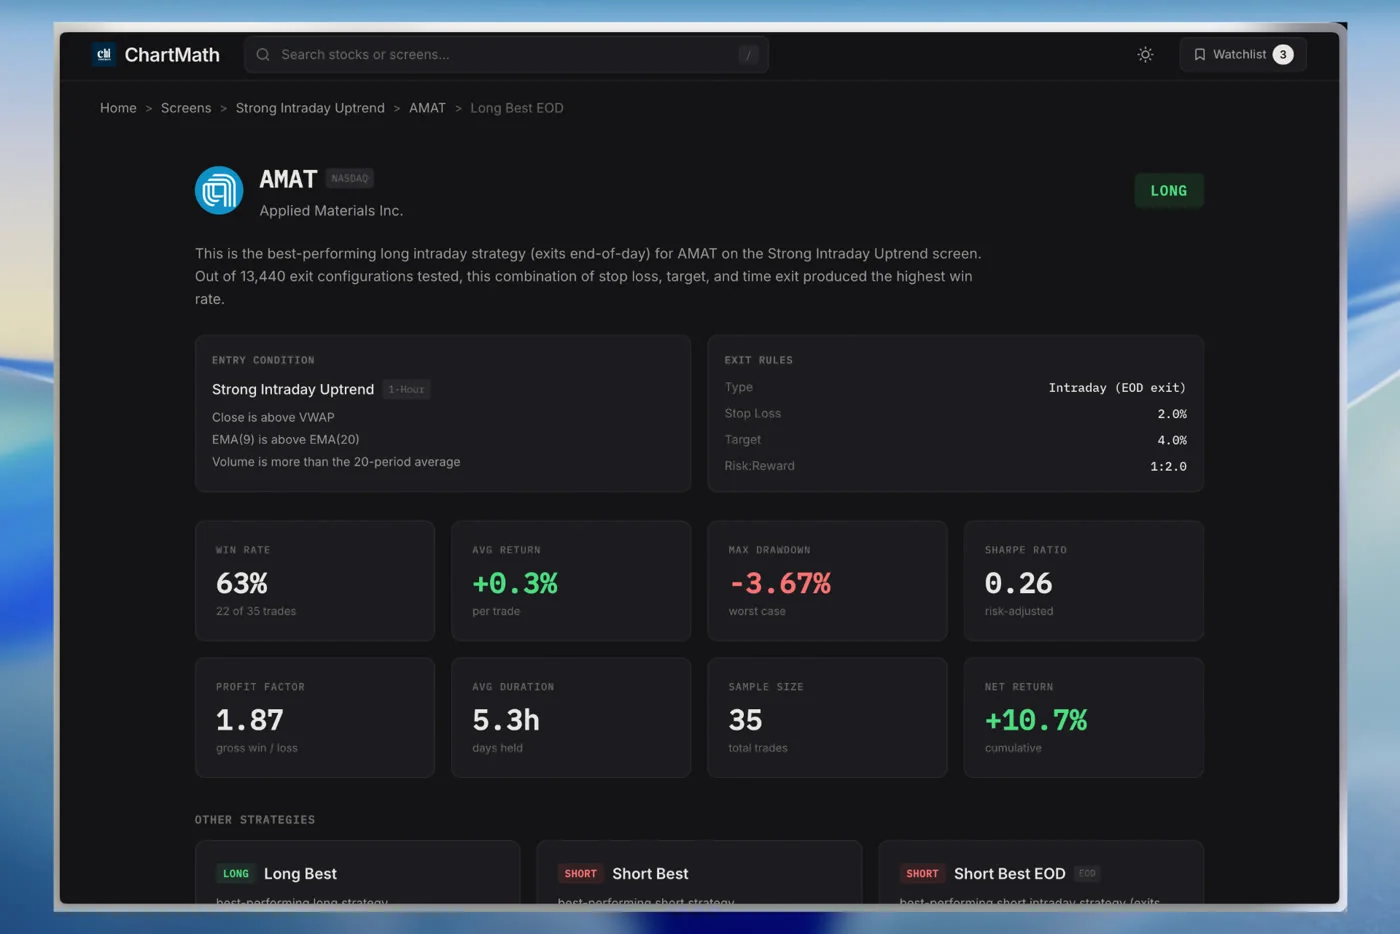
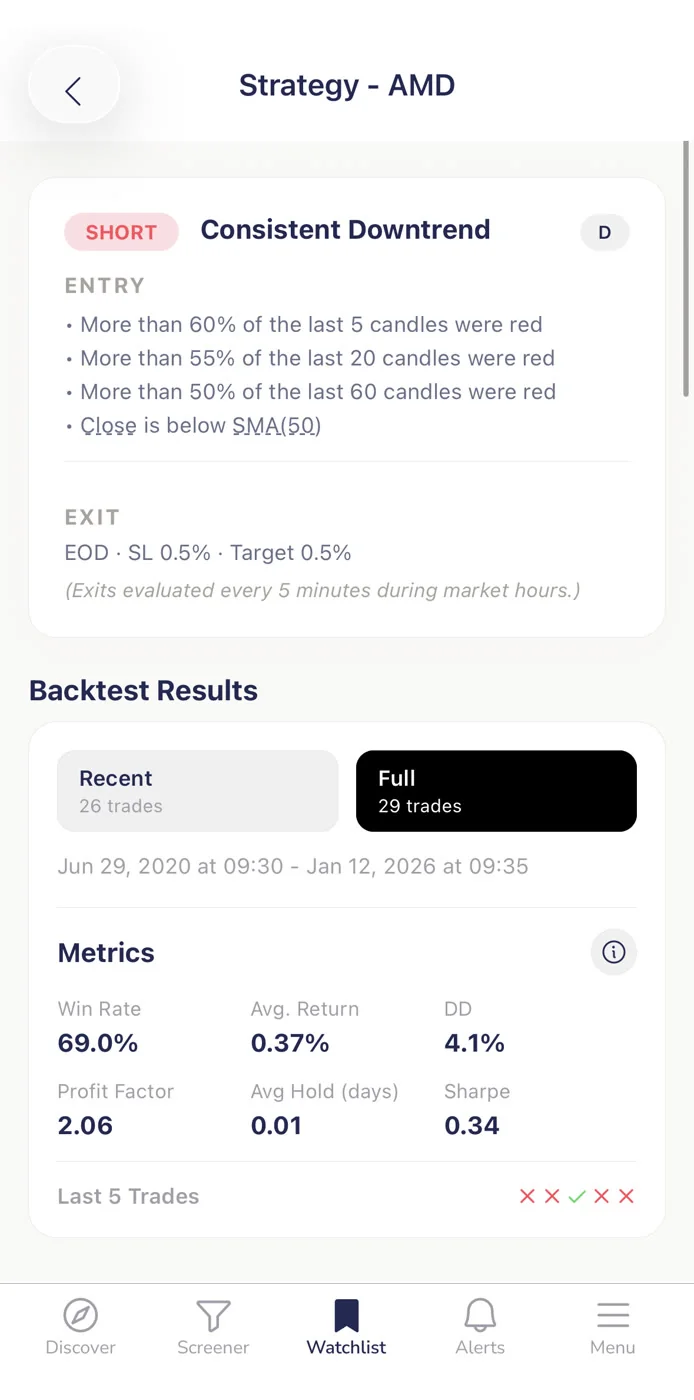
Expected value is the single most useful number on a signal card. It takes the win rate and the average return and combines them into one figure: the average outcome per trade if you took this setup every time it fired, over a large number of occurrences.
Positive EV means the setup has historically produced a net gain per occurrence. Negative EV means it hasn't, regardless of what the win rate says. Near-zero EV means the edge is thin enough that commissions, slippage, and execution variance could easily flip it negative in practice.
When you're looking at a ChartMath screen card, EV is the number that answers the question: does this setup have a documented edge? Win rate and average return are the inputs. EV is the output. If EV is positive and meaningful, the setup clears the first bar. If it's marginal or negative, move on regardless of how clean the chart looks.
One practical note: EV is calculated from historical data. It reflects what the setup has done in the past across the instruments in ChartMath's universe of 500+ US equities, 100 crypto pairs, and 11 US futures. It is not a forecast of what any individual trade will do. A positive EV setup will still produce losing trades. The edge shows up over many occurrences, not on any single one.
3. Validate the Sample Size Before You Trust Any Number
A 90% win rate over 8 trades is almost meaningless. Eight occurrences is not enough data to distinguish a genuine edge from a lucky streak. This is one of the most common traps in retail trading: a setup fires a handful of times, all of them work, and the trader concludes they've found something reliable. Then the next 20 occurrences revert to random, and the "edge" disappears.
Sample size is the quality check on every other number. Before you act on a win rate or an EV figure, ask: how many historical occurrences is this based on? A larger sample means the win rate and average return are more likely to reflect a real, repeatable pattern rather than noise.
There's no universal threshold that makes a sample "good enough", it depends on the setup type, the timeframe, and how frequently the screen fires. But as a general principle, the smaller the sample, the more skeptical you should be. A screen with a modest win rate and a large sample is often more trustworthy than one with a spectacular win rate and a tiny sample.
ChartMath only ships screens that have passed a minimum backtest threshold. Screens that don't have enough historical occurrences to produce reliable statistics don't make it into the app. That's a meaningful filter, but it doesn't mean every screen has the same statistical weight. Sample size is still visible on every card, and it's worth checking before you commit.
This connects directly to a broader point about how backtesting strategies are built and validated. The methodology behind the numbers matters as much as the numbers themselves.
4. Compare Setups Side by Side to Find the Higher-Edge Trade
Sometimes two screens fire on the same ticker at the same time. A VWAP Reclaim and a Low Volatility Compression might both flag the same stock on the same day. Which one do you act on?
This is where side-by-side comparison of the four metrics becomes a practical tool. Pull up both screen cards and compare Win Rate, Average Return, EV, and sample size. The setup with stronger numbers across all four, or at least across EV and sample size, is the higher-edge trade. If one screen has a higher win rate but lower EV, the average return math is working against it. If one has a larger sample, its numbers are more reliable.
Timeframe is also part of this comparison. A daily screen and a 1-hour screen on the same stock are different setups with different holding periods, different risk profiles, and different historical contexts. ChartMath covers 7 timeframes: 1m, 5m, 15m, 1h, Daily, Weekly, and Monthly. A screen that fires on the daily chart has a different character than the same pattern on the 1-hour. The backtest data reflects each timeframe separately, so you're comparing apples to apples when you look at the numbers for each.
The daily chart swing trade scanner workflow covers how to use timeframe selection as part of a systematic setup review. For traders who want to understand how VWAP-based setups fit into this comparison, the VWAP trading guide is a useful reference.
You can browse all 200+ curated screens on chartmath.com/screens to see which ones are active and compare their historical metrics before you decide which ones to favorite.
5. Filter Out Low-Edge Screens Before You Ever See a Signal
The most effective way to use backtest data isn't to evaluate every signal as it arrives. It's to pre-select the screens you trust before any signal fires, so that when an alert comes through, you already know it meets your edge criteria.
ChartMath lets you favorite screens. When you favorite a screen, you get push alerts when a ticker in the universe enters that screen. The practical implication: if you only favorite screens with positive EV, meaningful sample sizes, and average returns that justify the risk, then every alert you receive has already passed your filter. You're not evaluating edge in the moment, you've already done that work.
This is the discipline that separates systematic traders from reactive ones. Reactive traders look at every signal and decide whether it's worth taking based on how the chart looks right now. Systematic traders pre-commit to a set of screens with documented edges and only act on signals from those screens. The chart still matters for timing, but the edge question is already answered.
Alert hygiene is a real problem for traders who don't do this pre-filtering. If you favorite 50 screens without checking their metrics, you'll get a flood of alerts, many of them from setups with thin or negative EV. The volume itself becomes a problem, you start ignoring alerts, which defeats the purpose. The post on trading stocks without watching the screen all day covers how alert selection connects to a sustainable workflow.
6. Treat Backtest Data as Evidence, Not a Guarantee
Backtest data is historical. It tells you what a setup has done in the past across the instruments and timeframes it was tested on. It does not guarantee what any individual trade will do, and it does not account for changes in market conditions, liquidity, or volatility regimes that may affect future performance.
ChartMath's backtests use bar-close entries with no look-ahead bias. They do not model commissions, slippage, or spread. That means the numbers you see are cleaner than what you'd experience in live trading, where execution costs and market impact reduce your actual return. A setup with a thin positive EV in the backtest may have a negative real-world EV once you account for those costs.
This isn't a reason to ignore backtest data. It's a reason to use it correctly: as one input in a decision, not the only input. A setup with strong backtest metrics, a clean chart, and a clear entry level is a better candidate than a setup with strong backtest metrics and a messy chart. The backtest tells you the setup has historically worked. The chart tells you whether this specific occurrence looks like the historical pattern.
ChartMath is a copilot, not an autopilot. It surfaces the setup and the evidence. You make the call. There is no broker connection, no order placement, and no automated execution. You execute in your own brokerage, with your own position sizing, using the backtest data as context for the decision.
For traders building a broader systematic approach, the efficient trading workflow guide covers how to integrate backtest-driven screening into a repeatable daily process.
Putting It Together: A Simple Decision Framework
Here's a practical checklist you can run on any ChartMath signal card before you decide whether to act on it. It takes about 60 seconds and covers the four metrics that matter.
- Win Rate check. Is the win rate above a threshold you're comfortable with for this setup type and timeframe? A swing setup on the daily chart and a scalp on the 5-minute have different reasonable thresholds. Know yours before you look at the number.
- Average Return check. Is the average return large enough to justify the risk, given your position sizing? A win rate of 60% with an average return of 0.5% may not clear your minimum after costs.
- EV check. Is EV positive and meaningful? This is the combined verdict of the first two checks. If EV is positive, the setup has historically produced a net gain per occurrence. If it's near zero or negative, skip it.
- Sample size check. Is the sample large enough to trust the numbers? If the screen has fired very few times historically, treat the metrics with more skepticism, even if they look strong.
If all four pass, the setup has a documented historical edge worth considering. That doesn't mean you take every signal that clears the checklist, chart context, your current position sizing, and your available time to manage the trade all factor in. But you're starting from a position of evidence rather than intuition.
When a signal fails one of the four checks, the right move is usually to skip it. A high win rate with negative EV is a trap. A strong EV with a tiny sample is unreliable. A setup that passes three of four checks but has a sample size of 12 is not a setup you should be sizing up.
How This Fits a Part-Time Trader's Workflow
Most traders using ChartMath have a day job. They're not watching charts from 9:30 AM to 4 PM. The framework above is designed to work in the time you actually have: a 15-minute end-of-day review, a lunchtime check, or a quick scan before the open.
The pre-filtering step, favoriting only high-edge screens, does most of the heavy lifting before market hours. When an alert fires during the day, you already know the screen behind it has passed your metrics check. The in-the-moment decision is about chart context and timing, not about whether the setup has an edge. That question is already answered.
Browse the full screen library at chartmath.com/screens to see which screens are available and review their historical metrics. You can also explore the swing trading with a full-time job system for a broader look at how to structure your trading around a busy schedule.
A Note on What ChartMath Shows and Doesn't Show
Each screen in ChartMath comes with its filter rules written in plain English, a short description of what the setup is looking for, and the backtested metrics: Win Rate, Average Return, EV, and sample size. These metrics are the same for every stock that enters a given screen, the backtest reflects the screen's historical performance across all instruments, not a per-ticker forecast.
What ChartMath does not do: it does not place trades, connect to a broker, or generate a per-signal explanation of why a specific ticker fired. The screen rules tell you what conditions had to be true for the alert to fire. The backtest tells you how that set of conditions has historically resolved. You bring the judgment about whether this specific occurrence, on this specific stock, at this specific moment, is worth acting on.
That's the copilot model. The evidence is there. The decision is yours.
ChartMath starts with a 14-day free trial: every screen, every backtest, every alert, no card to start. After the trial it's $24.99/month founding pricing (locked for 12 months) or $149/year. If you want to start applying this framework to real setups, download the app at chartmath.com/app (iOS and Android) or browse the full screen library at chartmath.com/screens on the web.

Ankush Jindal
LinkedInSee these setups live in ChartMath
200+ curated screens with backtest data. 14-day free trial.