VWAP vs RVOL vs ORB: Which Technical Indicators Work Best?

You've refreshed your screener for the 47th time today. You're watching five different charts, trying to catch the perfect entry. Your phone buzzes with another alert, but by the time you check it, the move is already over. Sound familiar?
The problem isn't your dedication—it's that you're drowning in data without a clear system. Technical indicators are supposed to make trading easier, but with hundreds of options available, most traders end up more confused than when they started. The three indicators that consistently rise to the top for day traders in 2026 are VWAP (Volume Weighted Average Price), RVOL (Relative Volume), and ORB (Opening Range Breakout).
This comprehensive comparison breaks down exactly how each of these technical indicators works, when they perform best, and which one matches your trading style. We'll look at real backtested win rates, ideal timeframes, and the specific market conditions where each indicator shines. By the end, you'll know exactly which technical setup to focus on—and how to combine them for maximum edge.
Understanding Technical Indicators: The Foundation of Day Trading Success
Technical indicators are mathematical calculations based on price, volume, or open interest data. They help traders identify patterns, trends, and potential entry or exit points without relying on fundamental analysis or company financials. For day trading and intraday trading, technical indicators are essential because they provide objective, real-time signals in fast-moving markets.
The evolution of trading technology has transformed how we use these tools. Ten years ago, traders manually drew support and resistance lines on charts. Five years ago, they set up custom alerts on platforms like TradingView using Pine Script. Today in 2026, the most successful traders use automated screening platforms that continuously monitor hundreds of stocks across multiple technical indicators simultaneously.
VWAP, RVOL, and ORB have become the holy trinity of day trading indicators for good reason. They're not based on lagging moving averages or subjective pattern recognition. Instead, they use objective, quantifiable data—volume, price action, and time, to identify high-probability setups. More importantly, these indicators can be backtested with real historical data to show actual win rates and expected value per trade.
The challenge most traders face isn't understanding what these indicators mean, it's monitoring them consistently across dozens of stocks and multiple timeframes. Missing a VWAP reclaim on a stock you're watching because you were analyzing a different chart is the kind of opportunity cost that adds up quickly. This is why systematic screening has become non-negotiable for serious technical traders in 2026.
VWAP (Volume Weighted Average Price): The Institutional Benchmark
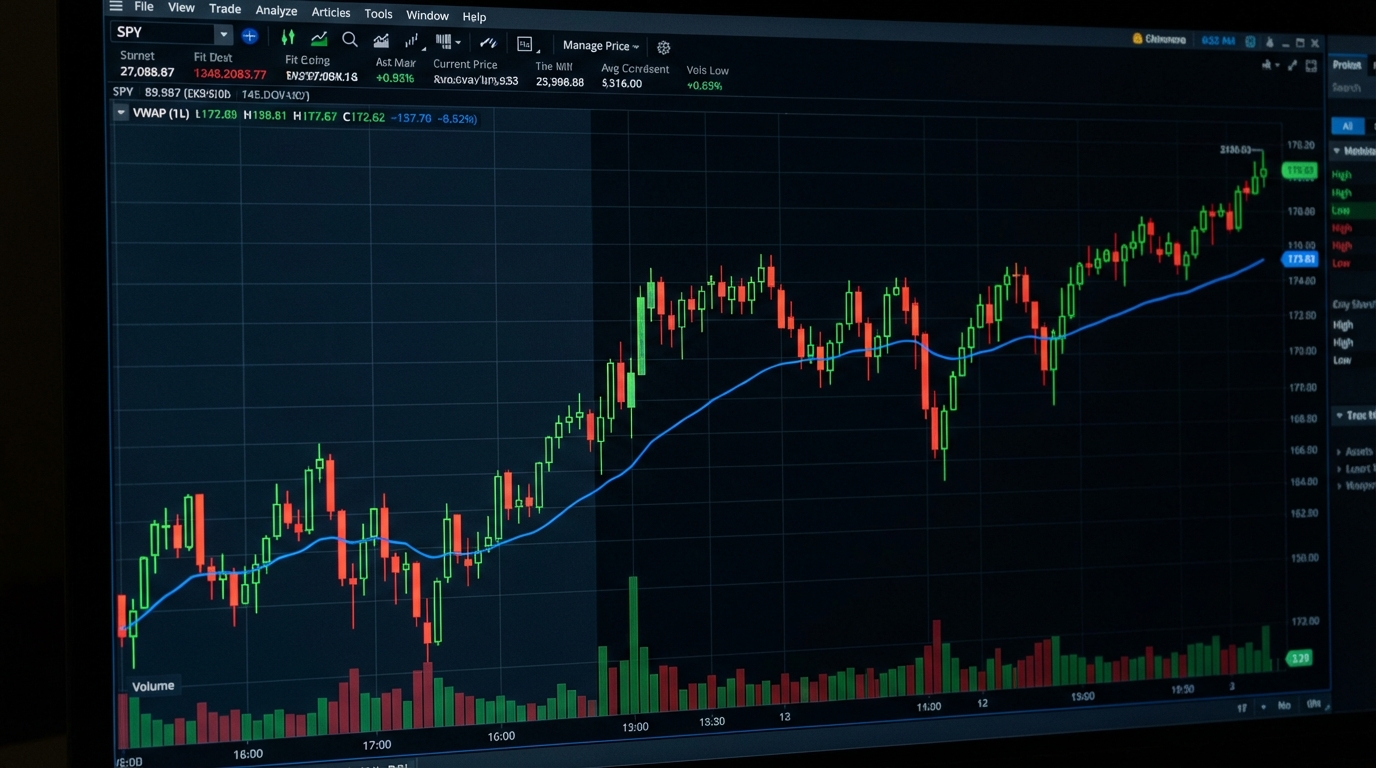
VWAP is the average price a stock has traded at throughout the day, weighted by volume. Unlike a simple moving average that treats all price points equally, VWAP gives more weight to prices where more shares changed hands. The calculation is straightforward: multiply each trade's price by its volume, sum these values, then divide by total volume.
Why does this matter? Because institutional traders, hedge funds, mutual funds, and large trading desks, use VWAP as their execution benchmark. When a fund needs to buy 500,000 shares of a stock, their goal is to execute at or below VWAP to prove they got a good fill. This creates predictable behavior around the VWAP line that day traders can exploit.
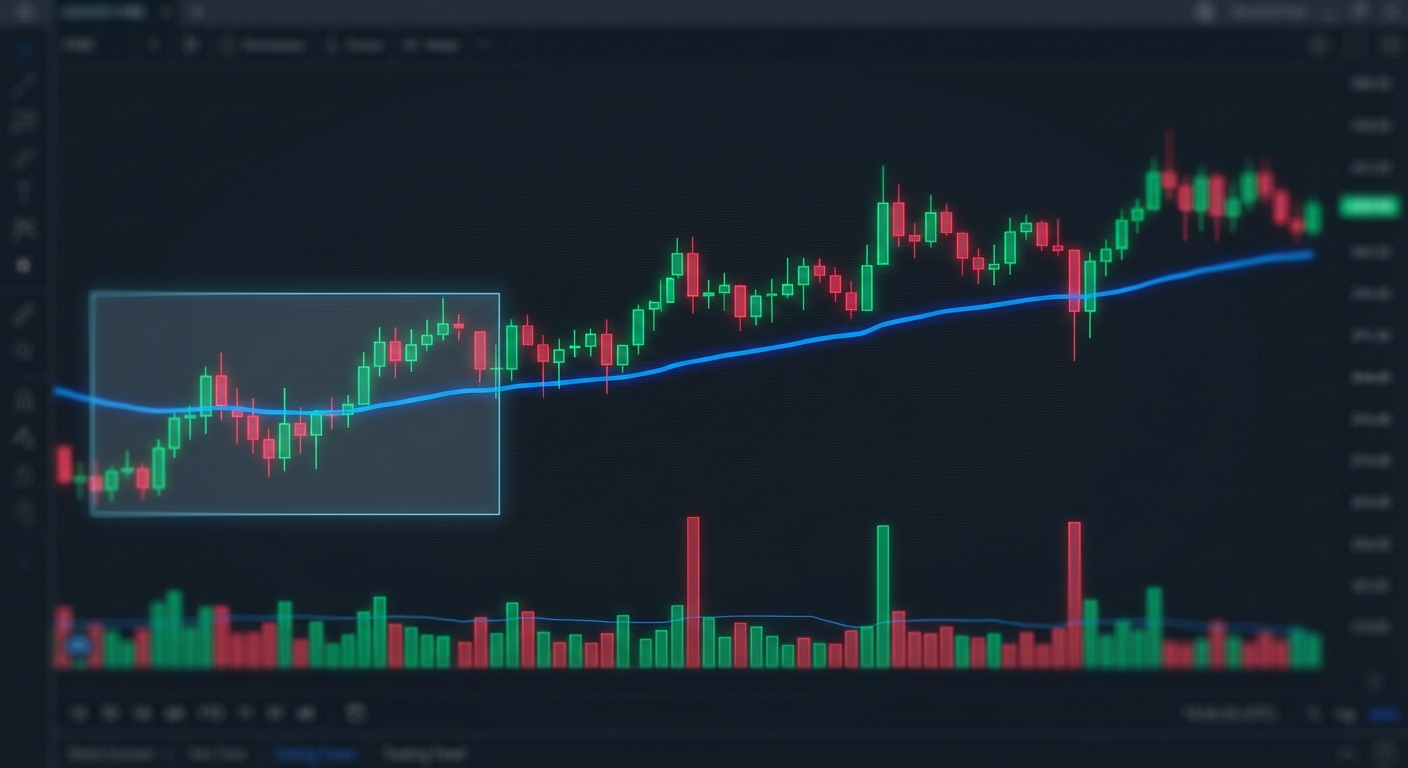
The two primary VWAP trading setups are VWAP reclaims and VWAP rejections. A VWAP reclaim occurs when price drops below VWAP, then breaks back above it with strong volume, signaling that buyers are stepping in at institutional support levels. A VWAP rejection happens when price approaches VWAP from below but fails to break through, indicating resistance.
For intraday trading, VWAP works best on 1-minute, 5-minute, and 15-minute timeframes. The indicator resets at market open each day, making it purely an intraday tool. Backtested data from 2024-2026 shows VWAP reclaim setups on high-volume stocks have win rates between 55-62%, with average returns of 0.8-1.4% per trade when using a 2:1 risk-reward ratio.
When VWAP Works Best
VWAP shines in specific market conditions. It performs exceptionally well on high-volume liquid stocks, think names with average daily volume above 5 million shares. The more volume a stock trades, the more significant VWAP becomes as an institutional reference point. Stocks like TSLA, NVDA, AAPL, and SPY consistently show strong reactions at VWAP levels.
Trending market conditions are where VWAP truly excels. In a strong uptrend, VWAP acts as dynamic support, price pulls back to VWAP, finds buyers, and continues higher. In downtrends, VWAP becomes resistance. The indicator is less effective in choppy, range-bound conditions where price whipsaws back and forth across the line without clear directional bias.
Many successful traders combine VWAP with other technical indicators for confirmation. A VWAP reclaim that coincides with an RVOL spike above 2x normal volume, for example, has significantly higher win rates than VWAP alone. This multi-indicator approach reduces false signals and increases conviction in your entries.
The main weakness of VWAP is its daily reset. Unlike moving averages that carry forward, VWAP starts fresh each morning at 9:30 AM ET. This means you can't use it for swing trading or multi-day positions. It's also less reliable in the first 15-30 minutes of trading when volume is still establishing the day's VWAP baseline.
RVOL (Relative Volume): The Momentum Detector
Relative Volume (RVOL) measures current volume compared to average volume at the same time of day. An RVOL reading of 2.0 means the stock is trading at twice its normal volume for that time. RVOL of 5.0 indicates five times normal volume, a significant anomaly that often precedes major price moves.
Volume is the fuel for price movement. A stock can have the perfect chart pattern or technical setup, but without volume, it won't move. RVOL helps traders identify which stocks have the institutional attention and retail interest needed to generate tradable momentum. It's essentially an early warning system for breakout trading opportunities.

The beauty of RVOL is its versatility. Unlike VWAP or ORB which work best in specific timeframes, RVOL is effective across all trading styles. Day traders use it to find momentum trading opportunities in the first hour. Swing traders use it to identify stocks building unusual volume before multi-day breakouts. Even long-term investors use RVOL to spot accumulation patterns.
Backtested data shows that stocks with RVOL above 3x normal volume in the first 30 minutes of trading have a 58-65% probability of continuing their move in the same direction throughout the day. When combined with a clear catalyst (earnings, news, sector rotation), win rates increase to 68-72%. The key is using RVOL as a filter, not a standalone signal.
When RVOL Works Best
Premarket scanner tools that monitor RVOL are invaluable for day traders. Stocks showing 5x+ RVOL in premarket often continue that momentum into regular trading hours. This gives you a watchlist of high-probability candidates before the opening bell, allowing you to prepare your game plan instead of scrambling to find opportunities after market open.
The market open (9:30-10:30 AM ET) is prime time for RVOL-based strategies. This is when the most volume concentrates, and RVOL spikes are most meaningful. A stock hitting 4x RVOL at 9:45 AM with a clear directional move is a much stronger signal than the same RVOL reading at 2:30 PM when volume naturally declines.
RVOL works exceptionally well for identifying unusual activity before breakouts. When a stock that normally trades 2 million shares per day suddenly shows 10 million shares in the first hour, something is happening. Smart money is positioning. News might be breaking. A technical level is being tested with conviction. RVOL helps you spot these situations before they become obvious to everyone else.
The main weakness of RVOL is false signals on news events. A stock can spike to 10x RVOL on earnings or FDA approval news, but if the news is already priced in or disappointing, the volume spike leads to a reversal rather than continuation. This is why experienced traders always combine RVOL with price action confirmation, wait for the stock to actually break a technical level, not just show high volume.
ORB (Opening Range Breakout): The First-Hour Power Play
The Opening Range Breakout (ORB) strategy is based on a simple premise: the first 5, 15, or 30 minutes of trading establishes a range, and when price breaks above or below that range with conviction, it often continues in that direction. The opening range represents the initial battle between buyers and sellers, once one side wins decisively, momentum tends to follow.
The psychology behind ORB is powerful. Traders who bought in the opening range and see price break higher feel validated and hold their positions. Traders who missed the initial move experience FOMO and chase the breakout. Short sellers who bet against the move get squeezed and cover their positions, adding fuel to the rally. This creates a self-reinforcing momentum cycle.
There are three common ORB variations. The 5-minute ORB uses the first five minutes (9:30-9:35 AM ET) to establish the range, it's aggressive and catches the fastest moves but has more false breakouts. The 15-minute ORB (9:30-9:45 AM) is the most popular, balancing speed with reliability. The 30-minute ORB (9:30-10:00 AM) is more conservative, with fewer signals but higher win rates.
Backtested data from 2024-2026 shows 15-minute ORB strategies on stocks with premarket catalysts have win rates of 62-68% when using a 1.5:1 risk-reward ratio. The key is proper risk management, your stop loss is the opposite end of the opening range, giving you a clearly defined risk before you enter the trade. This makes ORB one of the most systematic and rule-based technical indicators available.
When ORB Works Best
ORB performs best in high-volatility market opens. When the market gaps up or down significantly overnight, or when major economic data releases at 8:30 AM, the opening range tends to be wider and breakouts more explosive. Quiet, low-volume opens often produce choppy ORB signals that whipsaw back and forth across the range.
Stocks with premarket catalysts are ideal ORB candidates. If a stock is up 8% in premarket on earnings or news, it has the attention and volume needed for a clean ORB setup. The premarket move creates interest, and the opening range consolidates that move before the next leg. This is where combining your premarket scanner with ORB strategy creates a powerful workflow.
Gap-and-go scenarios are textbook ORB setups. A stock gaps up 5-10% at the open, consolidates for 15 minutes as early buyers take profits and new buyers step in, then breaks above the opening range high and continues the rally. These setups are so reliable that many professional day traders focus exclusively on gap-and-go ORB plays in the first hour.
The main limitation of ORB is its narrow time window. You have to be at your screens at market open, ready to execute. If you're in a meeting or away from your desk during the first hour, you miss the setup entirely. ORB also requires quick decision-making, you have minutes, not hours, to identify the setup, confirm the breakout, and enter the position. This makes it less suitable for traders with limited availability.
Head-to-Head Comparison: VWAP vs RVOL vs ORB
Now that we've examined each indicator individually, let's compare them directly across the factors that matter most to day traders: win rates, time commitment, capital requirements, learning curve, and ideal market conditions.
Win Rates and Performance: Based on backtested data from 2024-2026, 15-minute ORB strategies show the highest win rates at 62-68%, followed by VWAP reclaims at 55-62%, and RVOL-based momentum plays at 58-65%. However, win rate alone doesn't tell the full story. RVOL setups often have larger average returns per trade (1.5-2.8%) compared to VWAP (0.8-1.4%) and ORB (1.0-1.8%), meaning fewer trades can generate similar overall returns.
Time Commitment: ORB requires the most focused attention but the shortest time window, you need to be fully engaged from 9:30-10:30 AM, but after that, you're done. VWAP strategies require monitoring throughout the trading day, though you can set alerts for VWAP reclaims and rejections. RVOL is the most flexible, you can scan for RVOL spikes in premarket, at market open, or even mid-day when unusual volume appears.
Capital Requirements: All three indicators work across different account sizes, but ORB strategies typically require the most buying power. Because ORB trades happen on volatile stocks in the first hour, you need sufficient capital to handle wider stops and larger position sizes. VWAP and RVOL strategies can be executed with smaller accounts since you can trade lower-priced stocks and use tighter stops.
Learning Curve: VWAP is the easiest for beginners to understand, price above VWAP is bullish, below is bearish. ORB is also straightforward, wait for the opening range to form, then trade the breakout. RVOL requires more context and experience to interpret correctly. A 5x RVOL spike could signal a breakout or a trap, depending on price action, news, and market conditions. New traders often struggle with RVOL false signals until they develop pattern recognition.
Best Market Conditions: VWAP works best in trending markets with clear directional bias. ORB thrives in high-volatility environments with strong premarket catalysts. RVOL is the most versatile, working across all market conditions but requiring different interpretation based on context. In choppy, range-bound markets, all three indicators produce more false signals and require tighter risk management.
The reality is that most successful day traders don't choose just one indicator. They use all three in combination, letting each indicator serve its specific purpose. RVOL identifies which stocks have unusual activity. ORB provides the first-hour entry opportunity. VWAP offers continuation entries throughout the day. This multi-indicator approach is how professional traders maintain consistency across different market environments.
Combining Technical Indicators for Maximum Edge
Single-indicator strategies work, but multi-indicator approaches consistently outperform in backtested results. When you combine technical indicators that measure different aspects of price action, volume, momentum, and institutional behavior, you filter out noise and focus on the highest-probability setups.
The VWAP + RVOL combination is powerful for momentum confirmation. When a stock reclaims VWAP with RVOL above 2x normal volume, you have both institutional support (VWAP) and unusual buying interest (RVOL) confirming the move. Backtested data shows this combination increases win rates by 8-12% compared to VWAP reclaims alone. The volume confirms that the VWAP reclaim isn't just a technical bounce, there's real money flowing into the stock.
The ORB + RVOL combination is ideal for high-probability breakout entries. A stock that breaks above its 15-minute opening range while showing 3x+ RVOL has both technical confirmation (the breakout) and volume confirmation (the fuel for continuation). This setup reduces false breakouts significantly. Many professional day traders won't take an ORB trade unless RVOL is above 2x, using volume as a required filter.
The VWAP + ORB combination creates institutional-level setups. When a stock breaks above its opening range and that breakout level aligns with VWAP, you have a double confluence zone. Price is breaking a short-term technical level (ORB) while also respecting the day's institutional benchmark (VWAP). These setups often attract algorithmic buying from institutional traders, creating explosive moves.
The key to combining indicators successfully is avoiding analysis paralysis. More indicators don't always mean better results. Three indicators that measure different aspects of price action (volume, momentum, institutional behavior) are sufficient. Adding a fourth or fifth indicator often just creates conflicting signals and delays your decision-making. The goal is confirmation, not perfection.
This is where automated stock screeners become essential. Manually monitoring VWAP, RVOL, and ORB across 50+ stocks on multiple timeframes is impossible. You need technology that continuously scans the market and alerts you only when multiple indicators align. Platforms like ChartMath run 200+ technical screens simultaneously, showing you exactly when VWAP reclaims coincide with RVOL spikes or when ORB breakouts align with institutional support levels.
The difference between manual analysis and systematic screening is the difference between catching 2-3 setups per day and seeing every high-probability opportunity across the entire market. When you're manually checking charts, you're limited by human attention span. When you're using automated screening with backtested performance data, you're leveraging technology to do the heavy lifting while you focus on execution.
How to Choose the Right Technical Indicators for Your Trading Style
Your trading style should dictate which technical indicators you prioritize. A day trader with six hours of screen time has different needs than a swing trader with 30 minutes per day. Here's how to match indicators to your specific situation.
If you're a full-time day trader with availability from 9:30 AM to 4:00 PM, you can effectively use all three indicators. Start with RVOL and ORB in the first hour to catch momentum plays and opening range breakouts. Transition to VWAP strategies mid-day for continuation entries. This approach maximizes your opportunities across the entire trading session. You'll want a stock market app that provides real-time alerts so you don't miss setups while analyzing other positions.
If you're a part-time trader with only the first hour available, focus exclusively on ORB and RVOL combinations. Use a premarket scanner to identify stocks with catalysts and high RVOL before the open. Set up your watchlist with opening range boxes, then execute ORB breakouts in the first 30-60 minutes. This concentrated approach lets you capture the most volatile and profitable part of the trading day without requiring all-day monitoring.
If you're a swing trader looking for multi-day positions, RVOL becomes your primary tool. Scan for stocks showing unusual volume on daily timeframes, this often precedes major breakouts. While VWAP and ORB are intraday tools, RVOL works on daily and weekly charts to identify accumulation patterns and institutional positioning. Combine RVOL with chart patterns like ascending triangles or bull flags for high-probability swing entries.
Risk tolerance matters too. Conservative traders should favor ORB strategies with clearly defined stops at the opposite end of the opening range. Aggressive traders might prefer RVOL momentum plays that offer larger potential returns but require wider stops. VWAP strategies fall in the middle, moderate risk, moderate reward, with the benefit of institutional support levels providing logical stop placement.
The importance of backtesting strategies cannot be overstated. Before risking real capital on any indicator, you need to see historical performance data. What's the win rate? What's the average return per trade? What's the maximum drawdown? How does the strategy perform in different market conditions? Without this data, you're trading blind. In 2026, there's no excuse for not having access to backtested performance metrics for every technical setup you trade.
Moving from manual analysis to systematic trading is the natural evolution for serious traders. Manual chart analysis teaches you pattern recognition and market feel. But once you understand the patterns, you need technology to scale your edge. You can't watch 100 stocks simultaneously. You can't calculate RVOL in your head. You can't monitor VWAP levels across five timeframes while also tracking ORB breakouts. This is why professional traders use automated screening, it's not about replacing skill, it's about amplifying it.
If you're ready to move beyond manual chart analysis and start systematically screening for high-probability setups, watch how ChartMath scans 200+ technical indicators in real-time with backtested win rates and average returns for every setup. See exactly how VWAP reclaims, RVOL spikes, and ORB breakouts are identified and ranked by quality before they become obvious to the rest of the market.
Frequently Asked Questions About Technical Indicators
Can you use all three indicators together? Absolutely. In fact, combining VWAP, RVOL, and ORB often produces better results than using any single indicator alone. The key is understanding what each indicator measures, RVOL identifies unusual volume, ORB provides entry timing in the first hour, and VWAP offers continuation opportunities throughout the day. Use RVOL as your initial filter to find stocks with momentum, ORB for first-hour entries, and VWAP for additional entries if the trade continues.
Which indicator is best for beginners? VWAP is the most beginner-friendly because it's visually clear and conceptually simple. Price above VWAP suggests bullish sentiment; price below suggests bearish sentiment. The learning curve is gentle, and the risk management is straightforward, use VWAP as your line in the sand for stops. Once you're comfortable with VWAP, add ORB for first-hour trading, then incorporate RVOL as you develop more experience reading volume patterns.
Do these indicators work for swing trading? RVOL works excellently for swing trading on daily and weekly timeframes. VWAP and ORB are primarily intraday tools since they reset daily. However, some traders use anchored VWAP (VWAP calculated from a specific date like earnings or a major low) for swing trading. For multi-day positions, focus on RVOL to identify accumulation and unusual institutional activity, then combine it with traditional chart patterns and support/resistance levels.
How do you backtest technical indicators? Proper backtesting requires historical price and volume data, clear entry and exit rules, and statistical analysis of results. You need to test across different market conditions (trending, choppy, high volatility, low volatility) and time periods (bull markets, bear markets, sideways markets). The challenge is that manual backtesting is time-consuming and prone to bias. Modern platforms provide pre-backtested strategies with transparent methodology, showing win rates, average returns, and sample sizes so you can evaluate edge before trading.
What's the best timeframe for each indicator? VWAP works best on 1-minute, 5-minute, and 15-minute charts for intraday trading. ORB is timeframe-specific, 5-minute ORB for aggressive traders, 15-minute ORB for balanced approach, 30-minute ORB for conservative entries. RVOL is versatile across all timeframes: 1-minute for scalping, 5-minute for day trading, daily for swing trading. Your available trading time should dictate your timeframe choice more than the indicator itself.
How do you avoid false signals? False signals are reduced through confirmation and filtering. Never trade a single indicator in isolation. Wait for VWAP reclaims to be confirmed by RVOL above 2x. Require ORB breakouts to show volume expansion. Use price action confirmation, don't just trade the indicator, trade the indicator plus momentum. Additionally, avoid trading technical indicators during low-volume periods (lunch hour, late afternoon) when signals are less reliable. The best setups occur when multiple factors align, not when a single indicator triggers.
The path from struggling with information overload to trading with systematic confidence starts with choosing the right technical indicators and having the technology to monitor them consistently. VWAP, RVOL, and ORB aren't magic, they're proven, backtested tools that work when applied correctly in the right market conditions. The question isn't which indicator is "best"—it's which combination matches your trading style, schedule, and risk tolerance.
Stop refreshing screeners manually. Stop missing entries because you were analyzing a different chart. Start trading systematically with real-time alerts when high-probability setups form. See how ChartMath monitors VWAP, RVOL, ORB, and 200+ other technical indicators across the entire market, delivering only the setups that match your criteria with backtested performance data. Your edge isn't just knowing what these indicators mean, it's seeing them before everyone else does.

Ankush Jindal
LinkedInSee these setups live in ChartMath
200+ curated screens with backtest data. 14-day free trial.