Backtest Trading Strategies on Indian Stocks: No Code
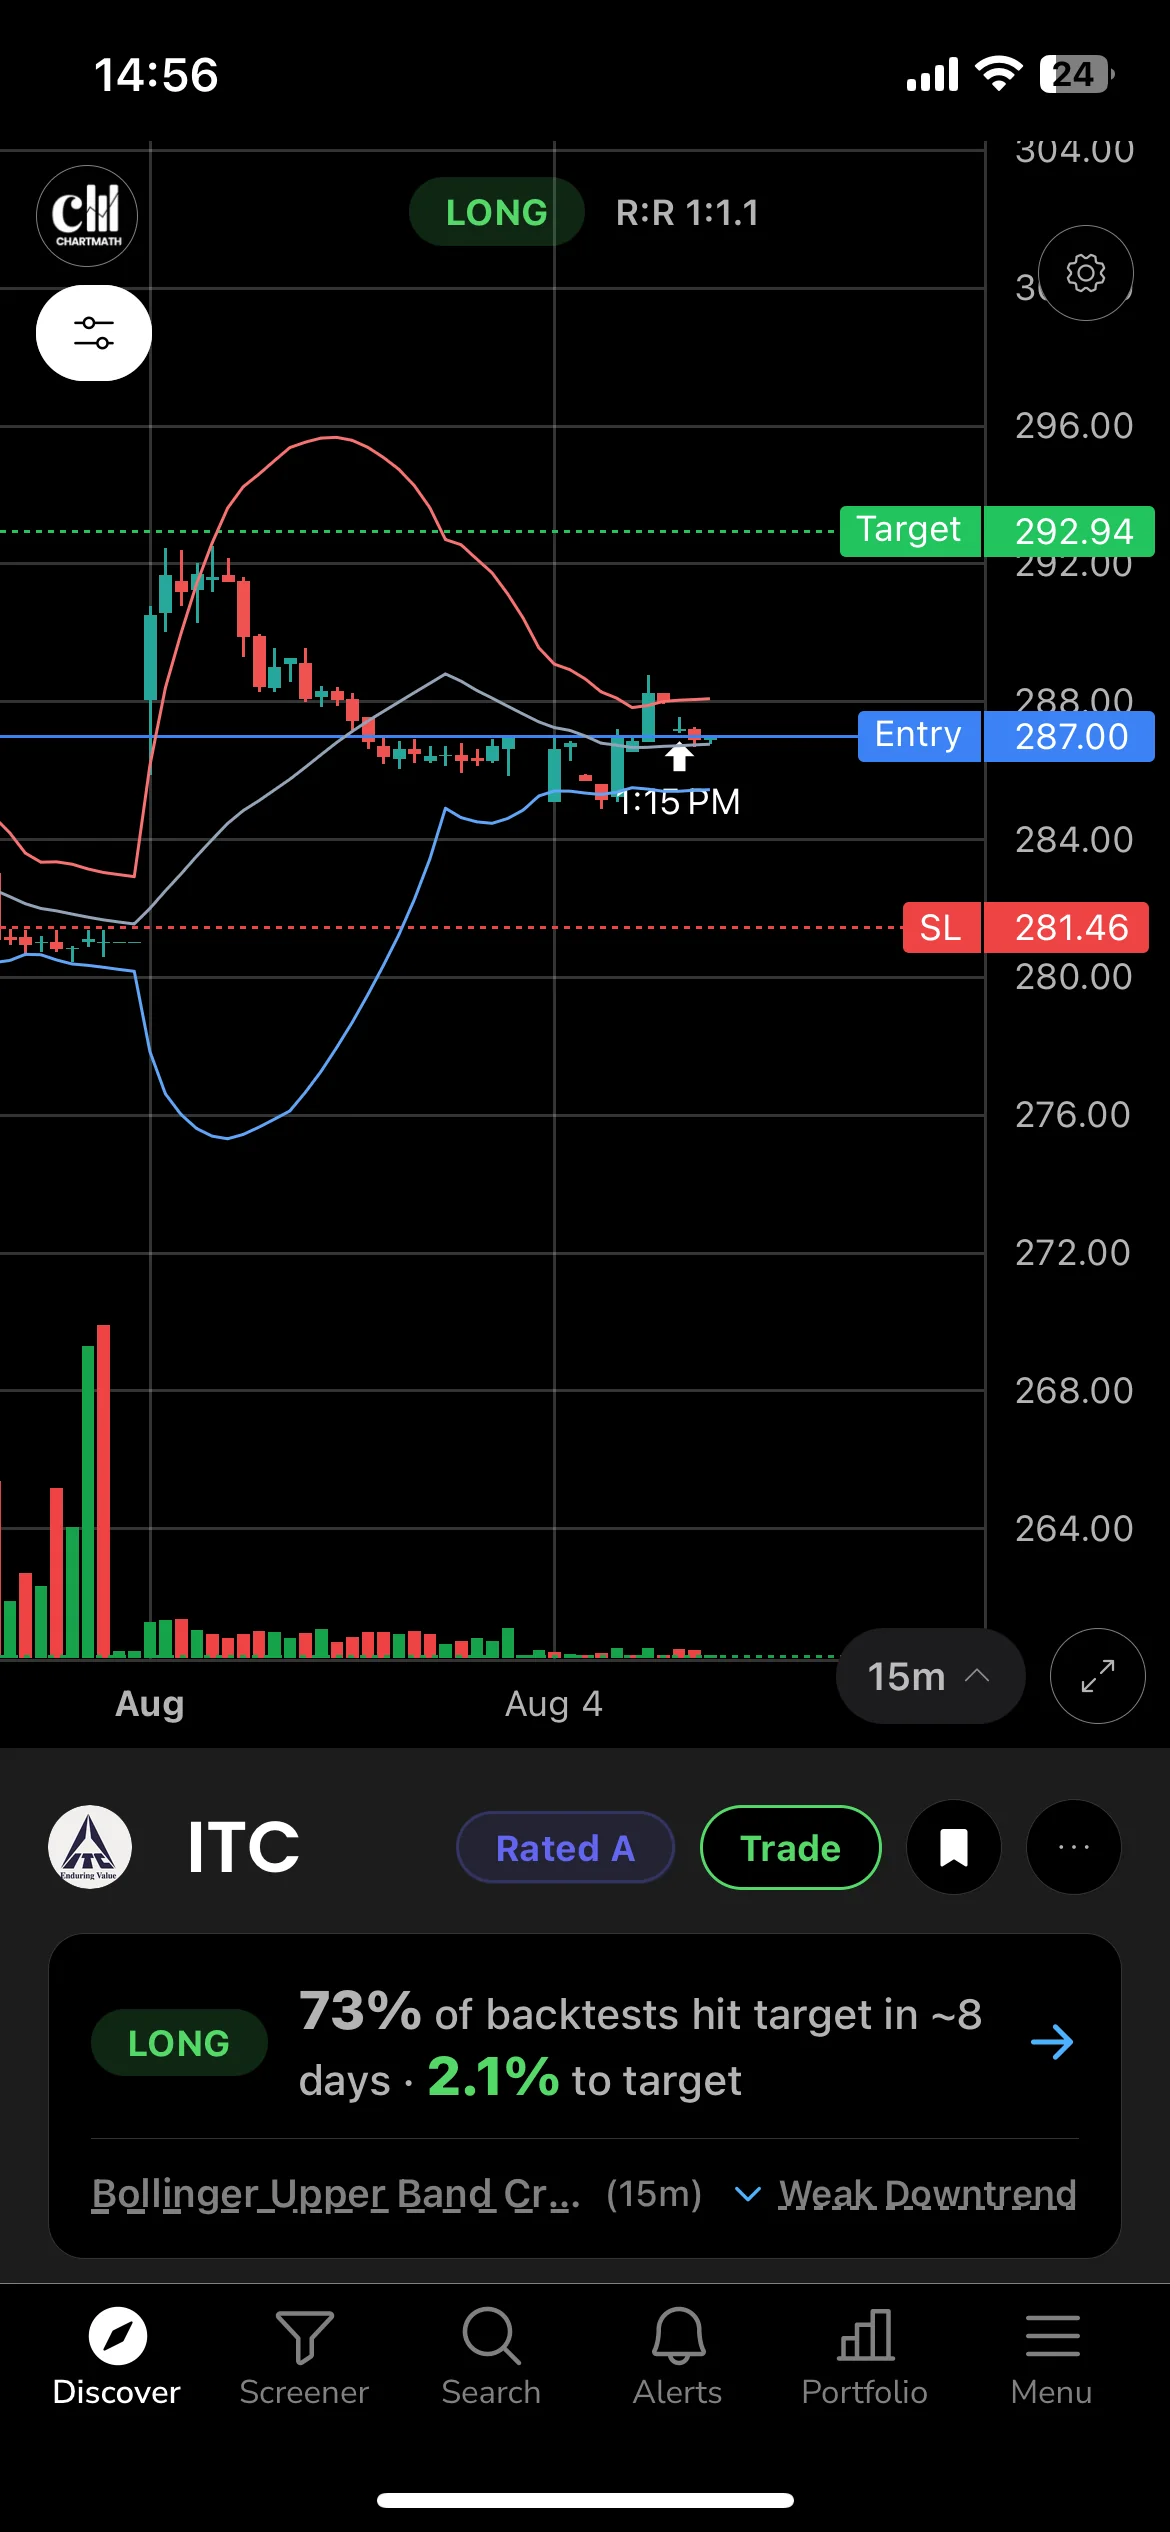
You're staring at a chart on your phone during lunch. Price just crossed above the 50-day moving average, RSI is climbing out of oversold, and every instinct says buy. But you have no idea whether this exact rule has ever worked before, on this stock or any other. That gap, between having a setup and knowing its history, is what backtesting closes. You can backtest a trading strategy in India without writing a line of code, using a defined universe of NSE stocks and four simple rules for how you run the test.
Key Takeaways
- Fix the rule first: entry, stop, and target must be written down before you test, with zero discretion allowed mid-test.
- Test across a defined universe: running a rule on your five favourite stocks tells you almost nothing; a bounded universe gives an honest number.
- Sample size matters more than most traders think: 10 trades is noise, not evidence, no matter how good the streak looks.
- Read win rate and average return together: either number alone can quietly mislead you about whether a rule actually makes money.
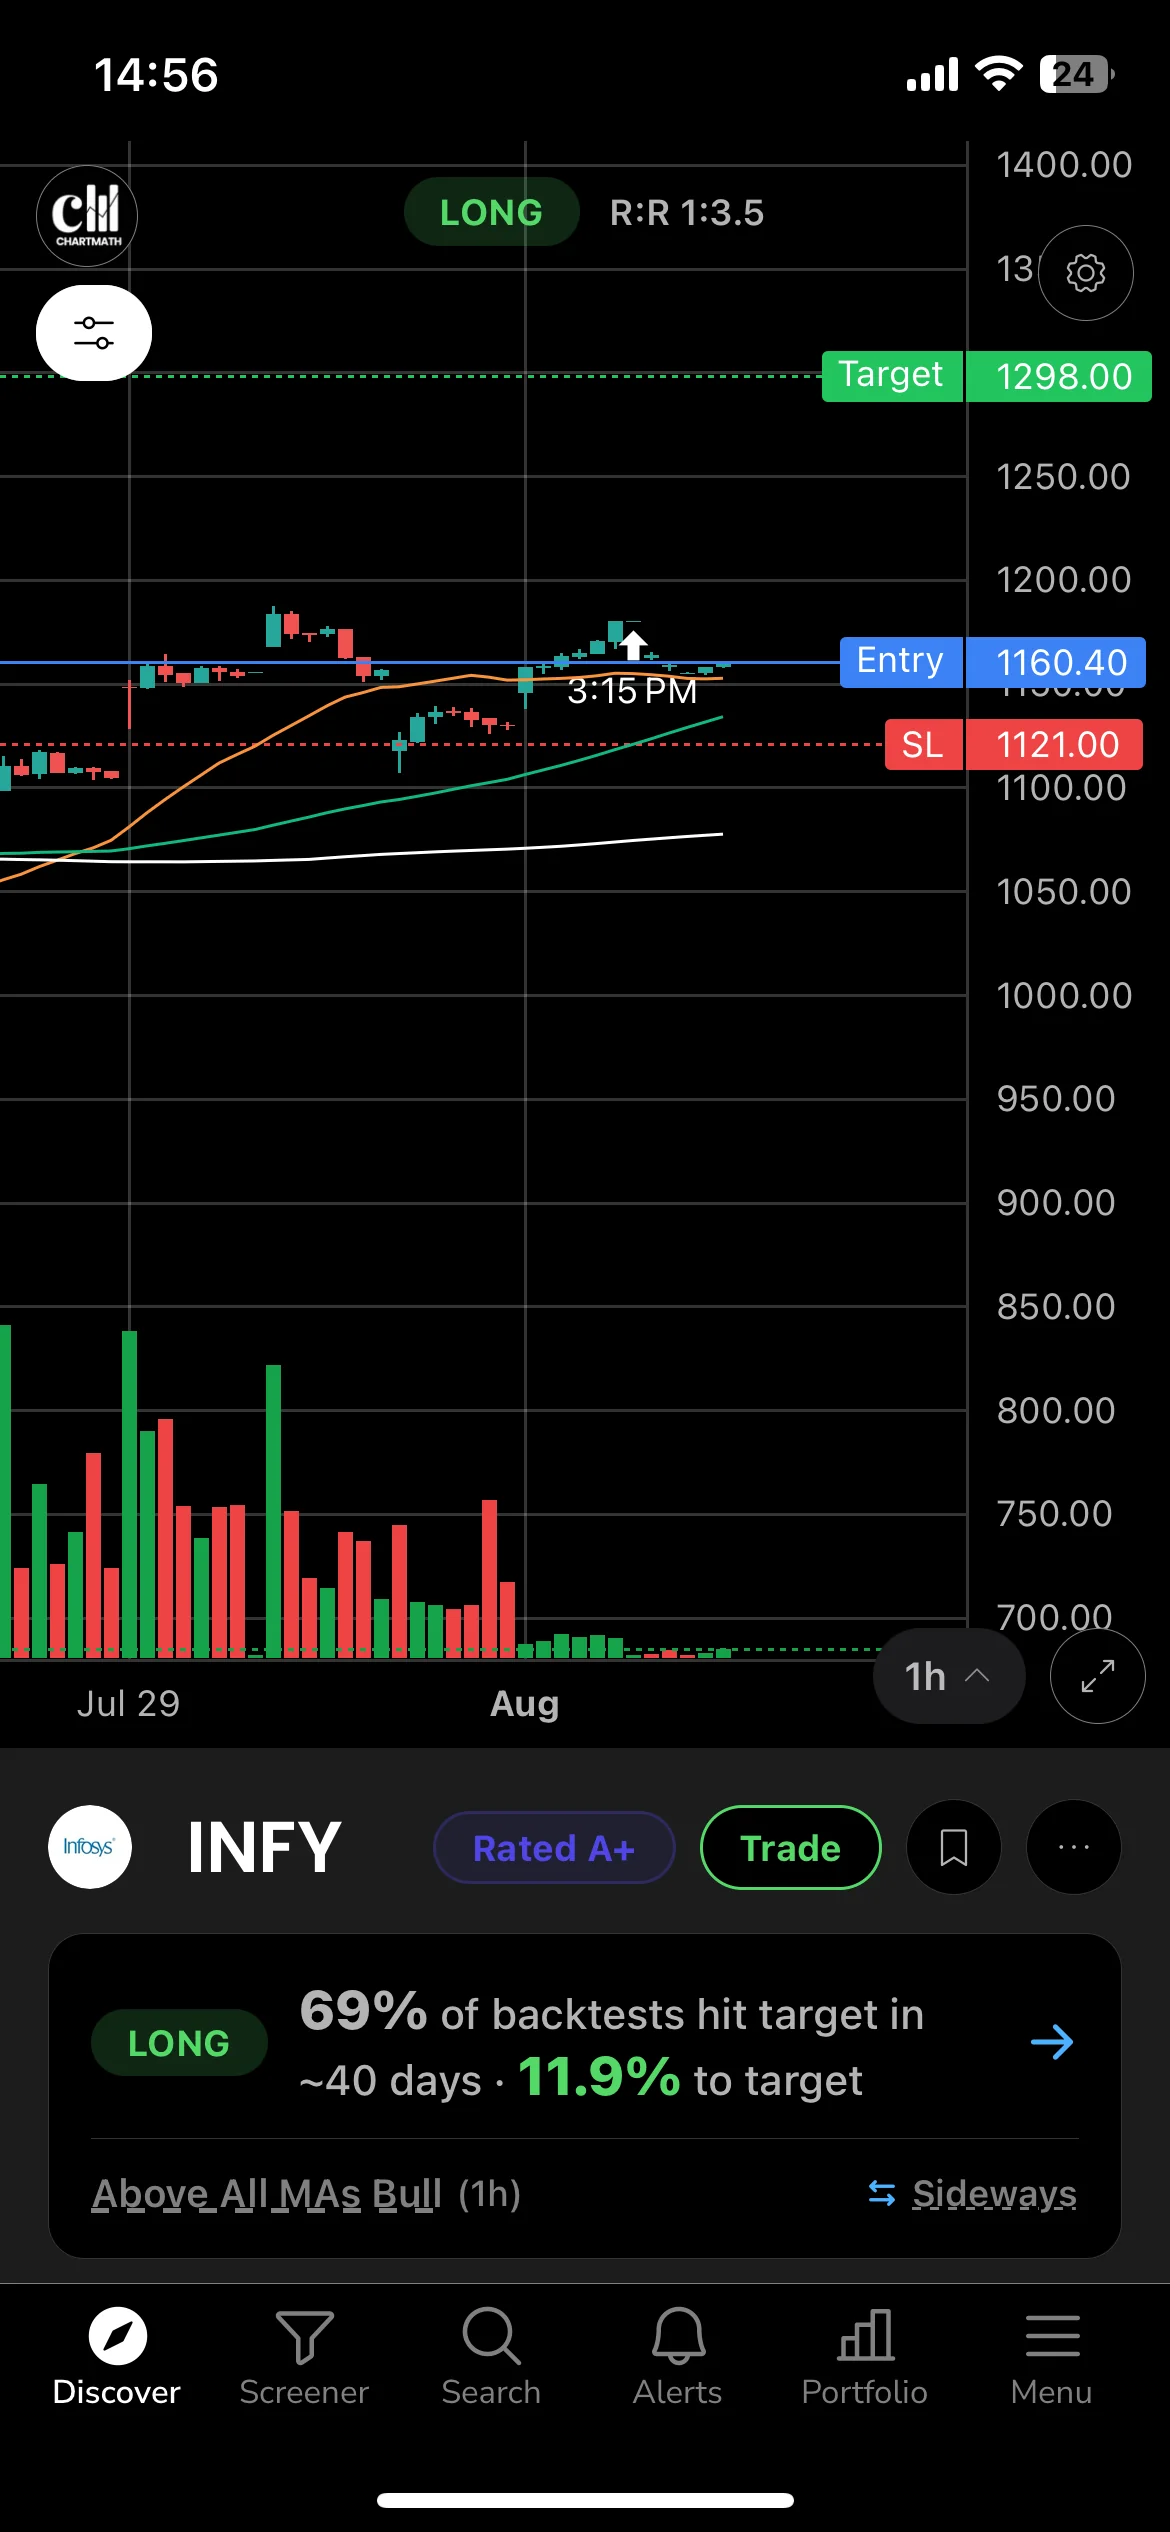
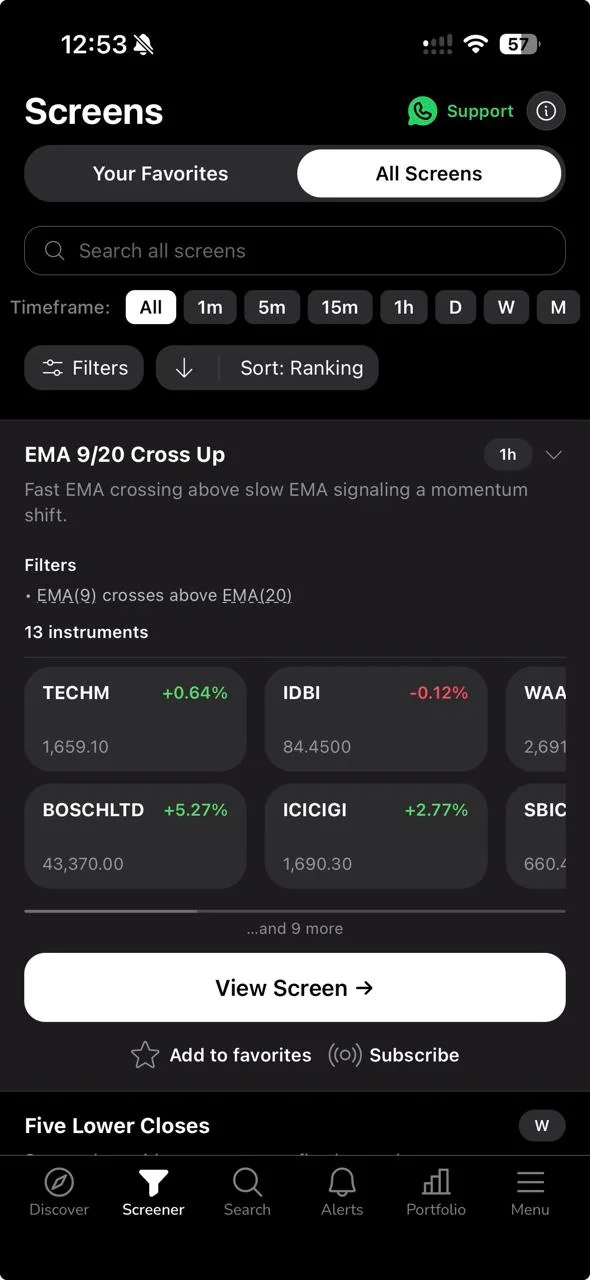
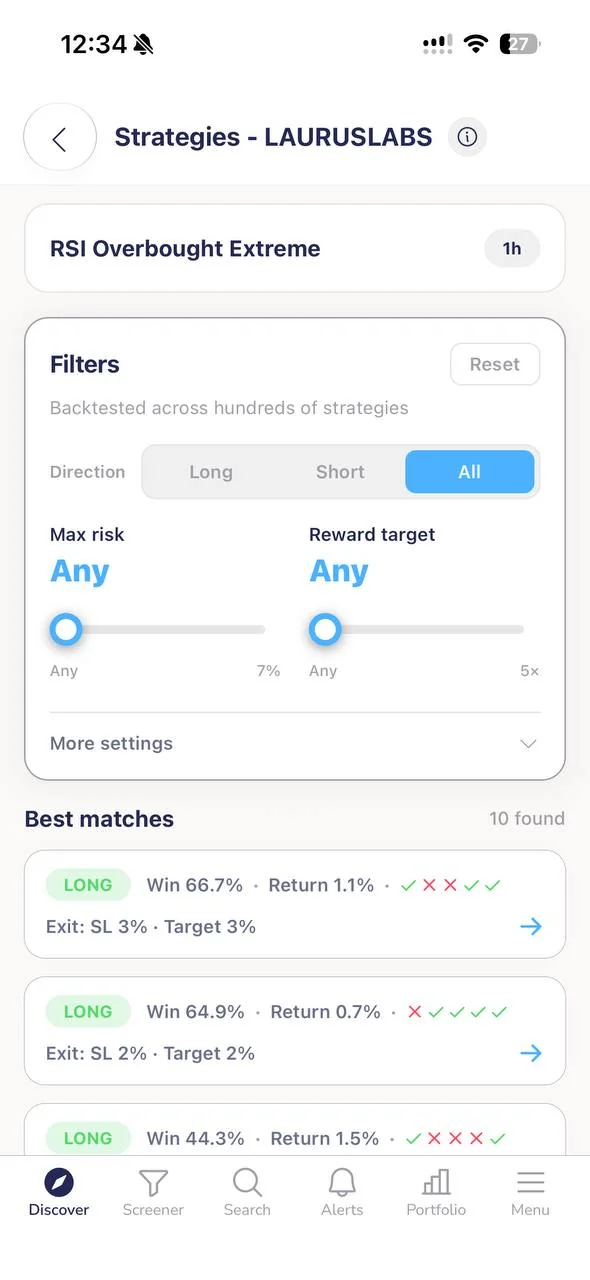
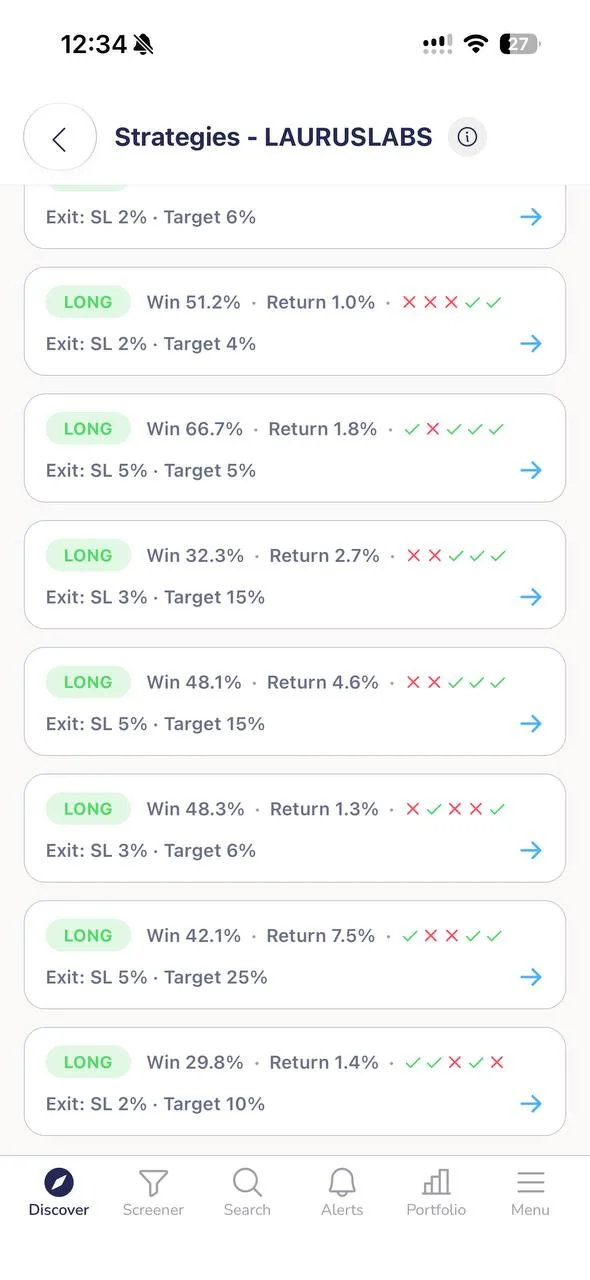
- Pre-built screens skip the coding step: tools like ChartMath run 200+ deterministic screens across actively traded NSE equities, with win rate and average return already computed and recomputable, no Python or Pine Script required.
At a Glance: Backtesting Methods for Indian Traders
| Method | Coding required | Typical cost | Universe size in practice | Sample size ease |
|---|---|---|---|---|
| Manual spreadsheet | No, but tedious | Free | Usually 3-10 stocks | Very low, hours per rule |
| Python / pandas scripts | Yes | Free, but time-intensive to build | As wide as your data source allows | High, once built |
| Pine Script on TradingView | Yes | Subscription plus scripting time | One stock at a time typically | Moderate |
| Paid backtesting platforms | No | Often a recurring subscription | Varies by plan | Moderate to high |
| ChartMath pre-built screens | No | Free, no credit card | actively traded NSE equities | High, results already computed |
Most retail traders in India never get past row one or two of that table. Backtesting gets treated as either a coding project you'll get to someday, or a subscription you can't justify. So the rule never gets tested. The trade gets taken on conviction instead, and the pattern repeats every week.
1. Fix the Rule Before You Test It
A backtest only means something if the rule was fixed before you saw the results. Write down three things in advance: the exact entry condition, the stop loss level, and the target. If your entry is "price closes above the 20-day EMA with RSI above 50," that's a rule. If your entry is "price closes above the 20-day EMA with RSI above 50, unless it looks weak," that's a feeling wearing a rule's clothes.
The discipline here is simple but easy to skip: once the rule is written, you don't adjust it mid-test because a few trades went badly. That adjustment is where curve-fitting begins, and curve-fitting is the single biggest reason a backtest looks great on paper and fails in live markets.
Think of it like a contract with your future self. Before you touch a single historical candle, you commit to the entry, the stop, and the target. Everything that happens after that is data, not opinion.
2. Run It Across a Defined Universe, Not Your Favourite Five Stocks
Here's a trap almost every self-taught backtester falls into: testing a rule on Reliance, TCS, HDFC Bank, and Infosys because those are the names they already know well. The problem is that you already know how those stocks behaved historically, so you unconsciously pick rules and stocks that fit what you remember working. That's survivorship bias wearing a lab coat.
A rule proven on four familiar large-caps isn't a track record. It's an anecdote with a chart attached. The fix is to run the exact same rule, unchanged, across a defined universe wide enough that you can't cherry-pick your way to a good-looking number. A screen that scans actively traded NSE equities and reports how many matched a given rule, and how that rule performed across all of them, gives you a number that means something rather than a story you already wanted to believe.
This is also where a well-defined screen catalog earns its keep. Instead of hand-testing one rule on one stock at a time, a rule like a MACD bull cross can be checked across the full universe at once. If you want to see what that looks like in practice, browse a live example on the MACD Bull Cross daily screen.
3. Get a Sample Size Large Enough to Stabilise the Number
Ten trades tells you almost nothing. Flip a coin ten times and you can easily get seven heads. That doesn't mean the coin is biased, it means ten flips is too small a sample for the true 50% rate to show up reliably. The same math applies to a trading rule. A win rate calculated from 10 or 15 trades can swing wildly with the next two or three outcomes.
As an illustrative example only: imagine a rule shows a 70% win rate after 12 trades. Add 100 more trades from the same rule, unchanged, and that number might settle at 55%, or it might hold near 65%. You genuinely don't know until the sample grows. What you do know is that a number computed from a dozen trades is closer to a guess than a track record.
Practically, this means you either need years of historical data across enough setups to accumulate dozens of matches, or you need a tool that already ran the rule across a wide universe and enough history to report a trade count alongside the percentage. If a screen shows you a win rate but hides the sample size, treat that number with real suspicion. Our post on why a high win rate doesn't equal profitable trading goes deeper into this exact problem.
4. Read Win Rate and Average Return Together
Win rate on its own is a half-finished sentence. A rule that wins 70% of the time but loses big on the 30% can still bleed your account. A rule that wins only 40% of the time but the average winner is three times the average loser can be very profitable. You need both numbers side by side to know what you're actually looking at.
This is the same reason a stop-loss and target matter as much as the entry signal. A rule with a tight target and a wide stop will show a higher win rate on paper, because it takes small wins often and eats occasional large losses. Change the exit rule and the whole picture shifts, even though the entry logic never moved. That's why a serious backtest reports win rate and average return as a pair, not a headline percentage on its own.
If you're testing a low-volatility setup, this pairing matters even more, since smaller average moves make the exit rule the deciding factor. You can see this dynamic on a rule like the Low Volatility Compression daily screen, where the entry condition is tight but the exit choice changes the outcome meaningfully.
A Worked Example: Testing a Moving Average Rule (Illustrative)
Say you want to test this rule: enter when price closes above both the 20-day and 50-day EMA, stop at the recent swing low, target a fixed 2:1 reward-to-risk. Here's how the four steps apply, using illustrative figures only, not a claim about any real outcome:
- Fix the rule: entry, stop, and target are written down exactly as above, before looking at a single trade.
- Define the universe: instead of testing on three stocks you like, you run it across the full NSE-listed universe available to you, say a curated list of NSE equities.
- Check the sample size: the rule needs to have fired often enough, illustratively say 80-plus historical instances, before the resulting percentage is worth trusting.
- Read the pair: illustratively, suppose the rule shows a 58% win rate with an average return of 1.4% per trade. Together those two numbers tell you the edge is modest but real, not a home-run system and not a coin flip either.
Notice what didn't happen anywhere in that process: no adjusting the stop after seeing a few losing trades, no swapping in a different EMA length because the first one looked disappointing. The moment you do that, you're no longer backtesting a rule, you're reverse-engineering a story that fits data you've already seen.
Common Mistakes That Quietly Invalidate a Backtest
A few habits sneak into almost every self-directed backtest and quietly wreck it:
- Curve-fitting: tweaking the rule after seeing results, then calling the improved number your track record. It isn't. It's a fit to noise you've already seen.
- Testing only current index constituents: stocks that got delisted, merged, or dropped out of the index over your test window get silently excluded, which inflates results because you're only testing survivors.
- Ignoring transaction costs and slippage: brokerage, STT, and the gap between your intended entry price and your actual fill all eat into real returns that a clean backtest often skips.
- Not reproducing the result: if you run the same rule again next week and get a meaningfully different number without knowing why, the first result wasn't evidence, it was a snapshot you can't trust.
A rule you keep tweaking mid-test isn't a track record, it's curve-fitting with extra steps. And a result you can't reproduce isn't evidence of anything at all.
Why Most Retail Traders in India Skip Backtesting Entirely
Ask a salaried swing trader why they don't backtest their RSI or MACD setups, and the answer usually falls into one of two buckets. Either it sounds like a coding project, learn Python, install pandas, wrestle with a data feed, or it sounds like an expensive subscription meant for full-time professional traders. Neither option fits someone trading around a 9-to-6 job. So the rule never gets tested. The trade gets taken on a gut feeling that the setup "usually works," and three months later there's still no real answer to whether it actually does. That's the exact gap between having a technical setup and knowing its history, and it's the gap most retail trading in India runs on. Our guide on how to read stock scanner results as a beginner covers the related problem of misreading a signal you don't fully understand.
How ChartMath Does This Pre-Done for NSE Stocks
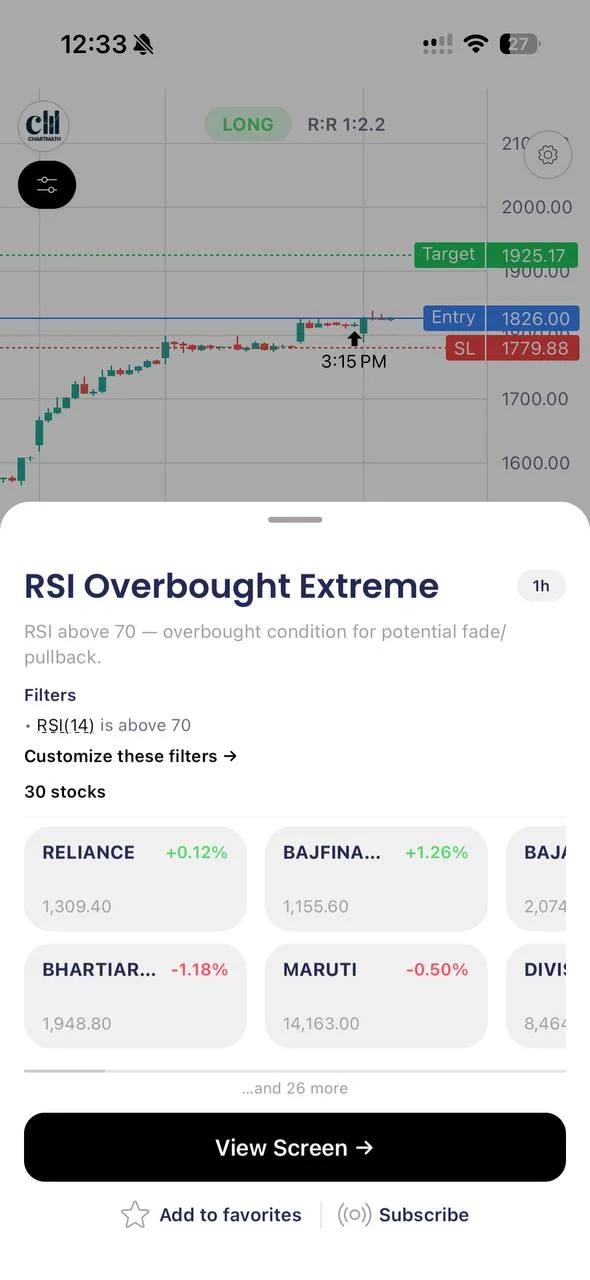
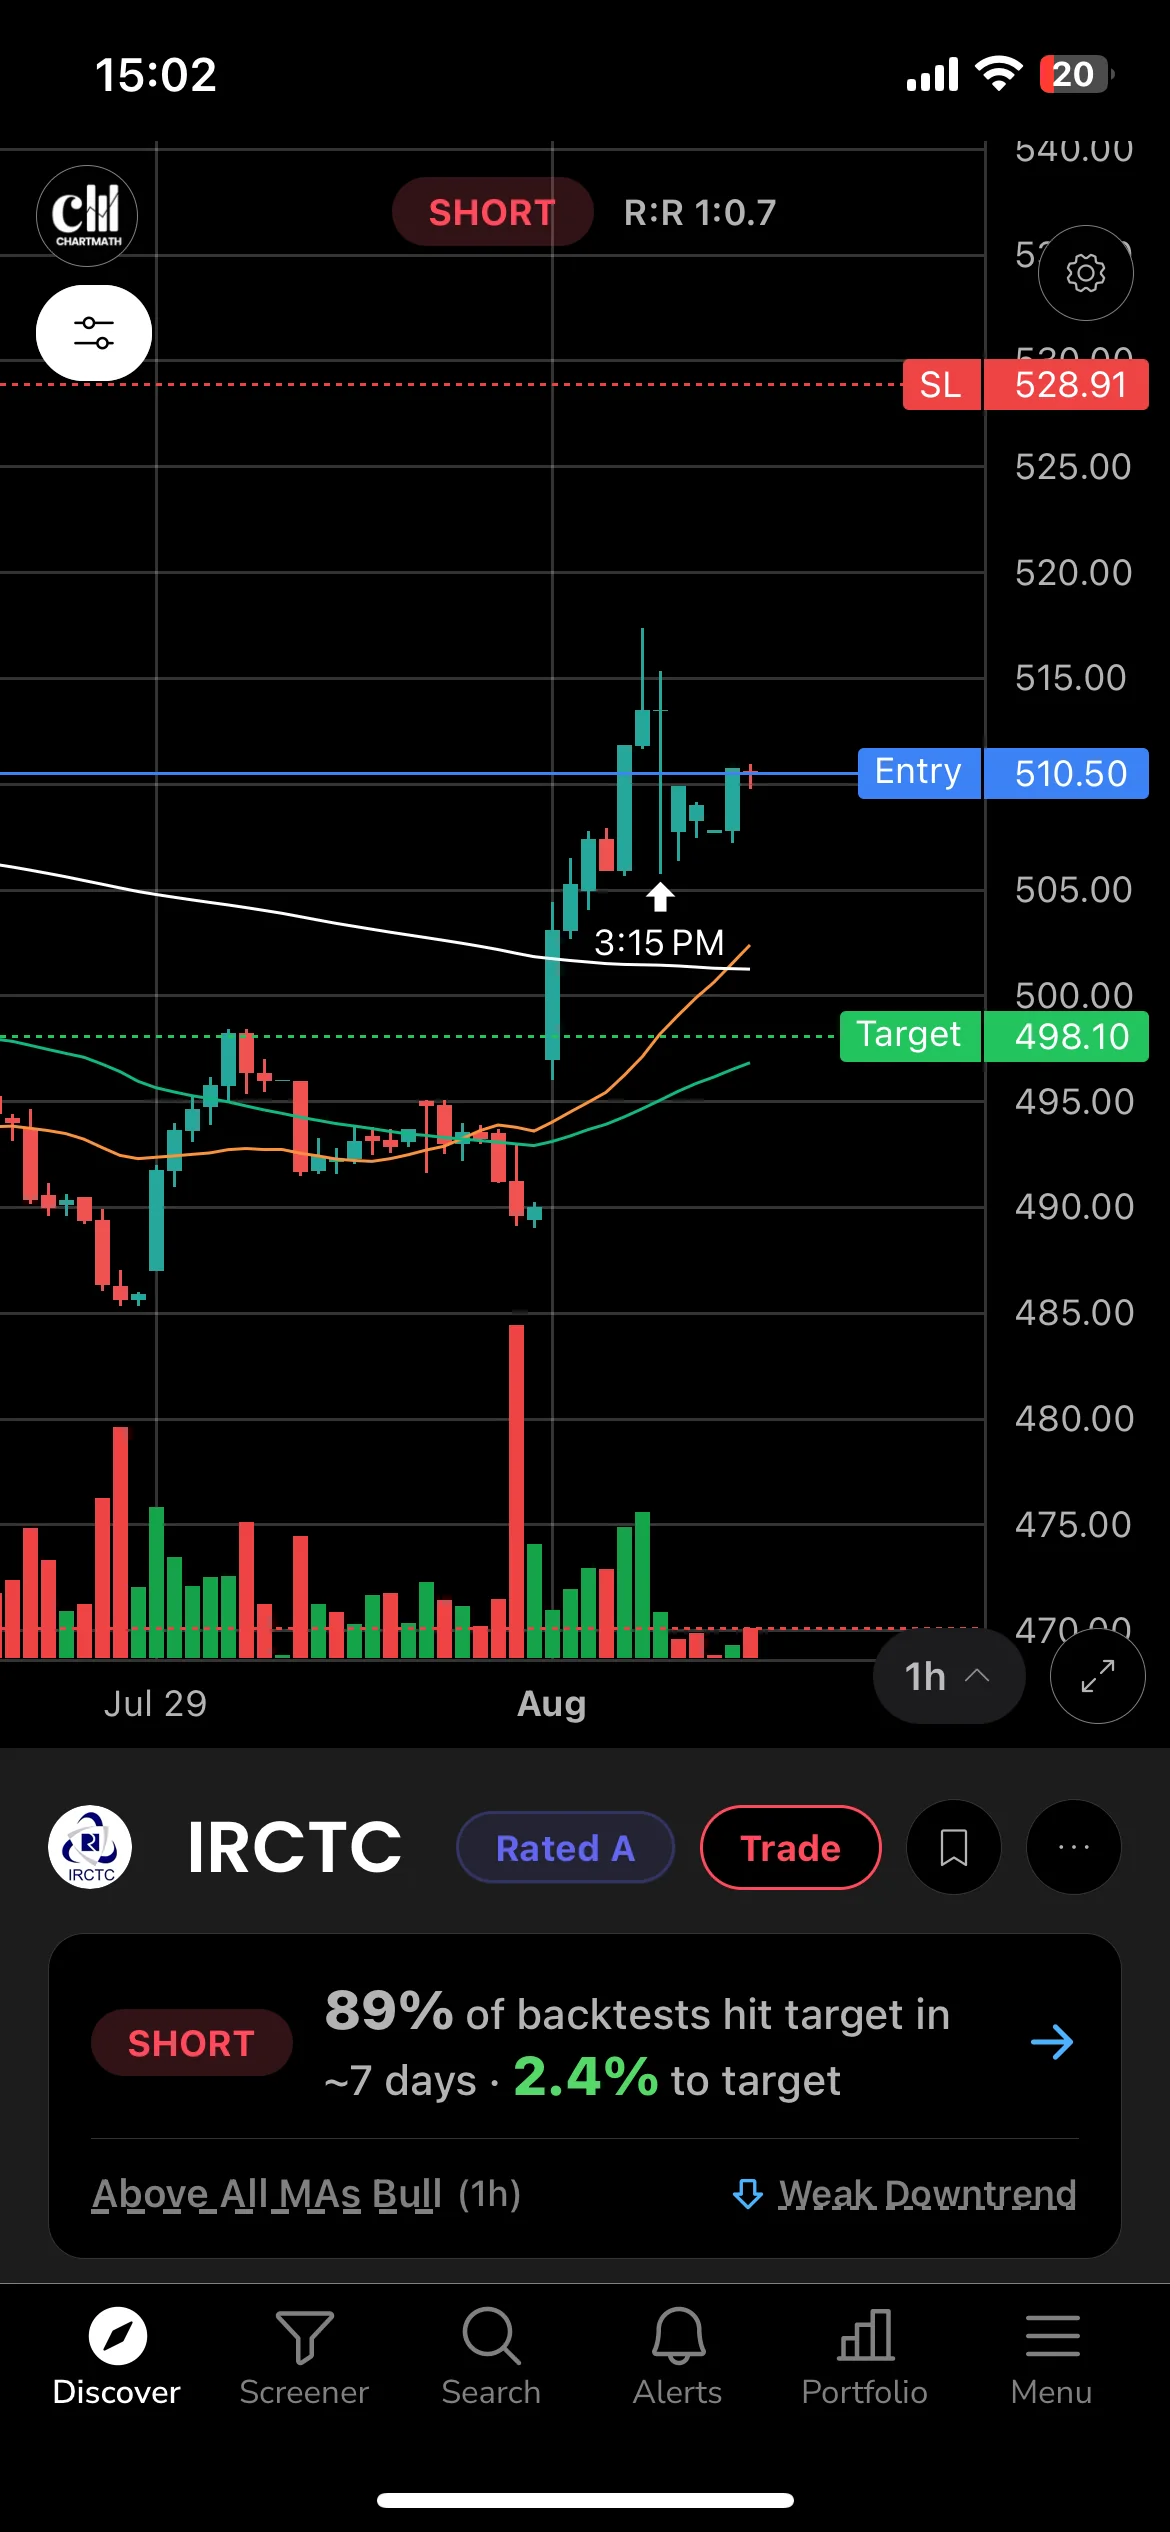
This is exactly the gap ChartMath is built to close. Instead of building your own testing pipeline, ChartMath ships 200+ deterministic technical screens, already run across a defined universe of actively traded NSE equities, each one carrying its own win rate and average return computed from historical data. Because each screen is a fixed, unambiguous rule rather than a discretionary call, its track record can be recomputed at any time instead of taken on faith.
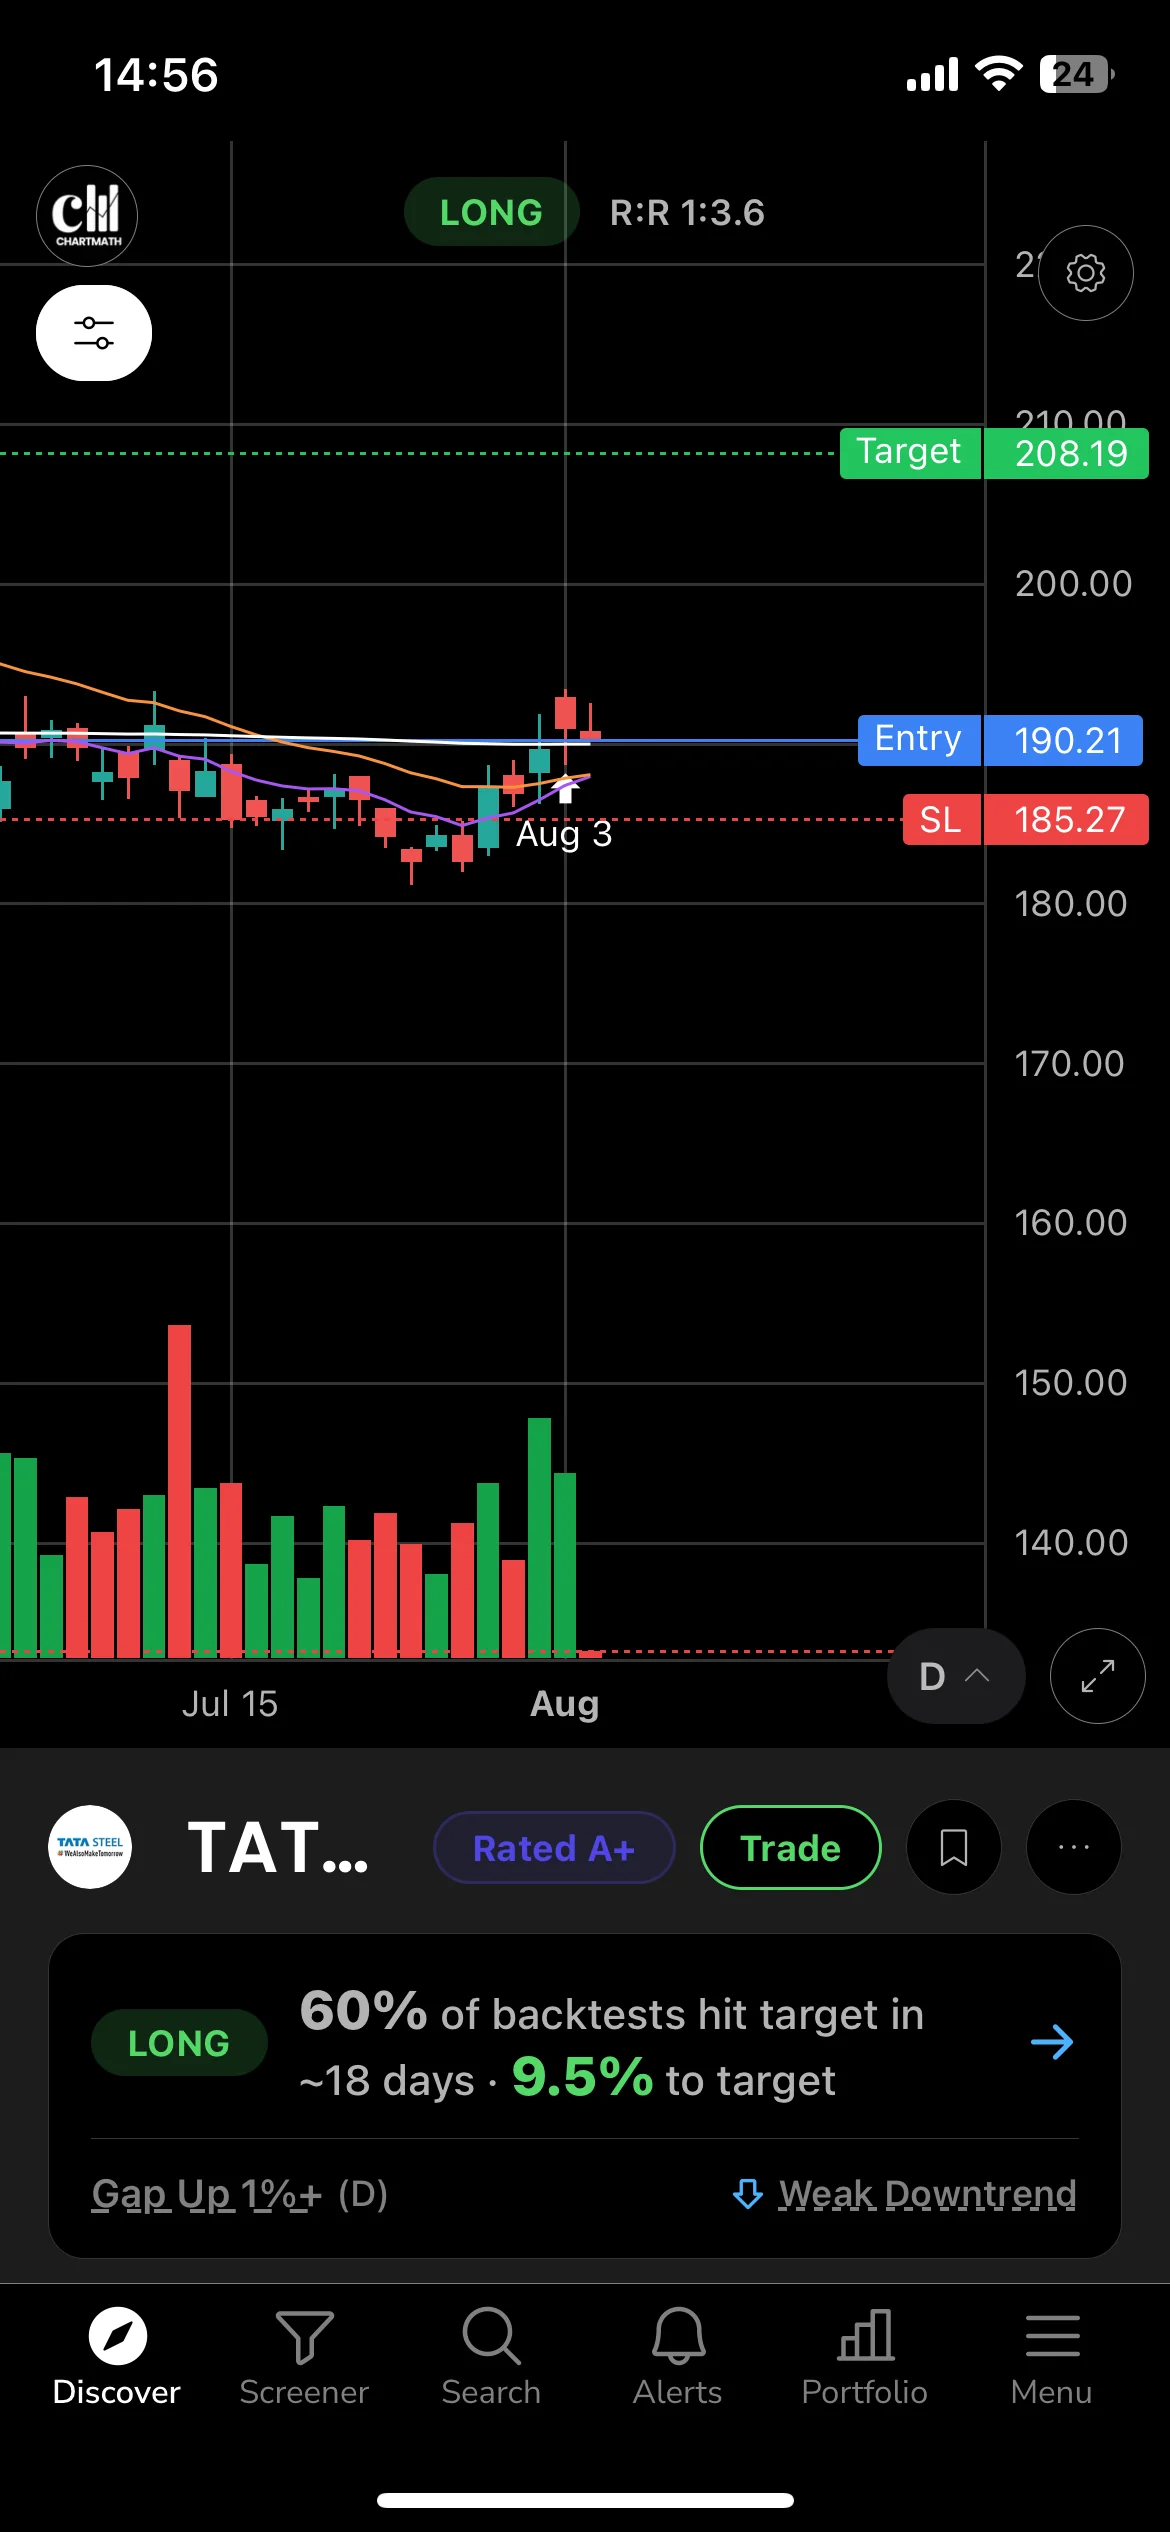
That means the four-step method above, fix the rule, use a defined universe, get a real sample, read win rate with average return, is already baked into every screen you browse. Want to see how a steady uptrend rule performs across the NSE universe? Check the Consistent Uptrend daily screen and look at the trade count next to the percentage before you judge the number.
A few things worth being clear about. ChartMath is copilot, not autopilot: it narrows the field and shows you the backtested history, but you tap to place every trade yourself. There's no screen builder, no Pine Script, no coding, by design, because the point is removing that barrier entirely. The app is free, no credit card required, on iOS and Android. You can also browse the full catalog of screen pages first and read how a screen's win rate and average return are laid out, before installing anything. Those pages run the US universe; for NSE names, switch the market to India inside the app.
One important boundary: NSE coverage here means equities only. There's no F&O, no options, no MCX, no index derivatives behind these screens today.
Educational use only. Not a broker/dealer or investment adviser and not registered with SEBI. Past performance does not indicate future results.
Nothing here is a tip, a recommendation, or a target price on any named stock. It's a method for checking whether a rule has a history at all, applied to a fixed universe you can inspect yourself.
Recap: The Four-Step Backtest Checklist
- Step 1: Write the entry, stop, and target down before you test. No mid-test edits.
- Step 2: Run the rule across a defined universe, not a handful of familiar stocks.
- Step 3: Wait for enough trades to accumulate before trusting the percentage.
- Step 4: Judge win rate and average return as a pair, never one alone.
If you want to see this checklist applied to setups you already understand, like RSI pullbacks or moving average crossovers, our piece on the RSI oversold bounce setup for day-job traders walks through one specific rule end to end.
FAQ
Do I need Python to backtest a strategy in India?
No. Python is one route, but it demands real coding time most salaried traders don't have. Pre-built screening tools apply the same four-step logic, fixed rule, defined universe, adequate sample, paired metrics, without asking you to write a script.
How many trades do I need before I trust a win rate?
There's no single magic number, but 10 to 15 trades is far too small to draw conclusions from. Look for screens or tests that show dozens of instances at minimum, and always check the trade count sitting next to the percentage.
Is a high win rate enough to trade a strategy?
No. A high win rate paired with a tiny average return, or a large average loss on the losing trades, can still be unprofitable after real-world costs. Always look at win rate and average return together, as covered in our post on why high win rate doesn't equal profitable trading.
Can I backtest options or F&O strategies this way?
Not through the NSE equity screens described here. This method and ChartMath's current NSE coverage apply to equities only, with no F&O, options, or index derivatives included.
The next setup you're tempted to take on a gut feeling deserves the same four questions: is the rule fixed, was it tested across a real universe, is the sample big enough, and do the win rate and average return actually support taking it. Rather than building that pipeline from scratch, you can browse screens that already carry this history for NSE equities and see the trade count for yourself. Download the app and check your own watchlist against a backtested rule before your next trade, or start with the screen pages to see the full catalog first.

See these setups live in ChartMath
200+ curated screens with backtest data. Free. No credit card required.