Best Stock Screener for NSE Swing Traders
The best stock screener for NSE swing traders is the one whose universe, logic, and track record you can state out loud, not the one with the flashiest homepage or the loudest Telegram group backing it. Before you pay for anything, you should be able to answer six concrete questions about the tool: what it scans, why a stock matched, whether its track record can be recomputed, whether it fits your actual working hours, whether it needs code, and what the real total cost of your toolkit will be.
Key Takeaways
- Vague universe, vague trust: If a screener can't tell you the exact exchange and instrument count it scans, treat every signal it produces as unverifiable.
- Plain-English reasons beat clever formulas: A filter string like
close > ema(close,20)is a condition, not an explanation. Ask what it means in practice. - Screenshots are not track records: One winning trade posted in a group proves nothing about the underlying rule's edge going forward.
- Your work hours matter more than features: With NSE trading between 9:15 and 15:30 IST, a tool that needs constant manual refreshing during a desk job fails a working trader before it does anything else.
- Total cost is a stack, not a subscription: Most traders end up paying for a scanner, a charting tool, a fundamentals site, and a Telegram fee at once. Add it all up before you commit.
At a Glance: Screener Categories Compared
| Product | Best at | Coding? | Backtest attached to the screen itself? |
|---|---|---|---|
| Chartink | Fast, free, click-built NSE technical scans and a large community scan library | No | 🔴 No. Its backtest shows how many stocks matched on past dates, not how those trades resolved. Its own FAQ says a win rate is planned but not available yet, and that results are computed on current values. |
| Trendlyne | Breadth in one place: scores, derivatives data, analyst coverage, and backtestable screeners | No | 🟡 Partly. Screeners can be backtested and it reports a winners/losers ratio, but it is a rebalancing-portfolio test over a chosen universe: it answers how holding a basket would have gone, rather than how one setup has resolved. |
| Screener.in | Fundamental depth: ten years of financials and custom ratio queries | Query syntax | 🔴 No. Built for fundamental screening, not signal history. |
| Tickertape | The cleanest consumer research experience, strong mobile | No | 🔴 No. |
| StockEdge | Prebuilt scan breadth, plus delivery-volume and FII/DII data retail rarely gets | No | ⚪ Not stated on their own pages. Treat as unknown rather than assumed either way. |
| TradingView | Charting, and unlimited expressive power if you can code | Pine Script for anything custom | 🟡 On a strategy, not a screen. Percent-profitable belongs to a coded strategy on one symbol; the screener and the win rate are separate objects. |
| Streak | No-code strategy building through to live execution with a broker | No | 🟡 On a strategy you build. Zerodha's own write-up describes the scanner as a live filter; to see performance you construct a separate strategy and backtest that. |
| ChartMath | Pre-tested screens for swing traders who would rather spend evenings on selection than on building rules | No | 🟢 Yes. The record is a property of the screen, tested per stock and across exit scenarios, with sample size and date range shown alongside it. |
Read that last column carefully, because the differences are finer than a yes or no. Several of these do run backtests. The question is what is being tested. On TradingView and Streak, you first build a strategy, then test that strategy; the scan and the record are separate things you assemble yourself. On Trendlyne, a screener can be backtested as a rebalancing portfolio, which answers "how would holding these names have gone" rather than "how has this setup resolved". Neither is wrong. They are simply answering a different question from the one a swing trader asks when a stock shows up on a Tuesday and he has twenty minutes to decide.
Vendor features and pricing move quickly, so check each product's own site before you commit to anything. Everything above was read from vendor documentation in August 2026.
Why NSE Swing Traders Get Burned Buying the Wrong Screener
You have a job. Your trading window overlaps with meetings, standups, and a commute. NSE trades from 9:15 to 15:30 IST, which means every minute you spend chasing a screener that doesn't respect your schedule is a minute you're not actually trading. That's the practical problem. The bigger risk is quieter: a lot of what gets sold as a "screener" in Indian trading circles is really a tip-selling operation wearing a dashboard as a costume.
A genuine screener applies a fixed, statable rule to a fixed universe of stocks and shows you the result. A tip-seller shows you a screenshot of a stock that went up 12% last month and asks you to trust the process. The difference matters because one can be checked and the other can't. If you can't recompute a claim, you're not evaluating a tool, you're taking someone's word for it.
1. Can You State the Universe Out Loud?
Ask the tool, or its marketing page, a direct question: which exchange, and how many instruments? A serious screener answers in one sentence. "This screens NSE-listed equities" is a statable claim. "It covers the whole market" is not, because nothing genuinely covers every NSE-listed name with equal depth, and vague phrasing is usually covering for a thin or undisclosed universe.
This matters because a screener scanning 50 large-caps will behave very differently from one scanning 350+ names across market caps. If you don't know which one you're using, you can't judge whether a signal is rare or common, meaningful or noise.
2. Can You See Why a Stock Matched, in Plain English?
Condition scanners like Chartink are genuinely useful, and they're honest about what they are: you write or select a filter condition, and stocks meeting that condition show up. The catch is that the output is a formula result, not a story. "close crossed above 20 ema" tells you what happened mechanically. It doesn't tell you why that pattern has historically mattered, or how often it's actually worked.
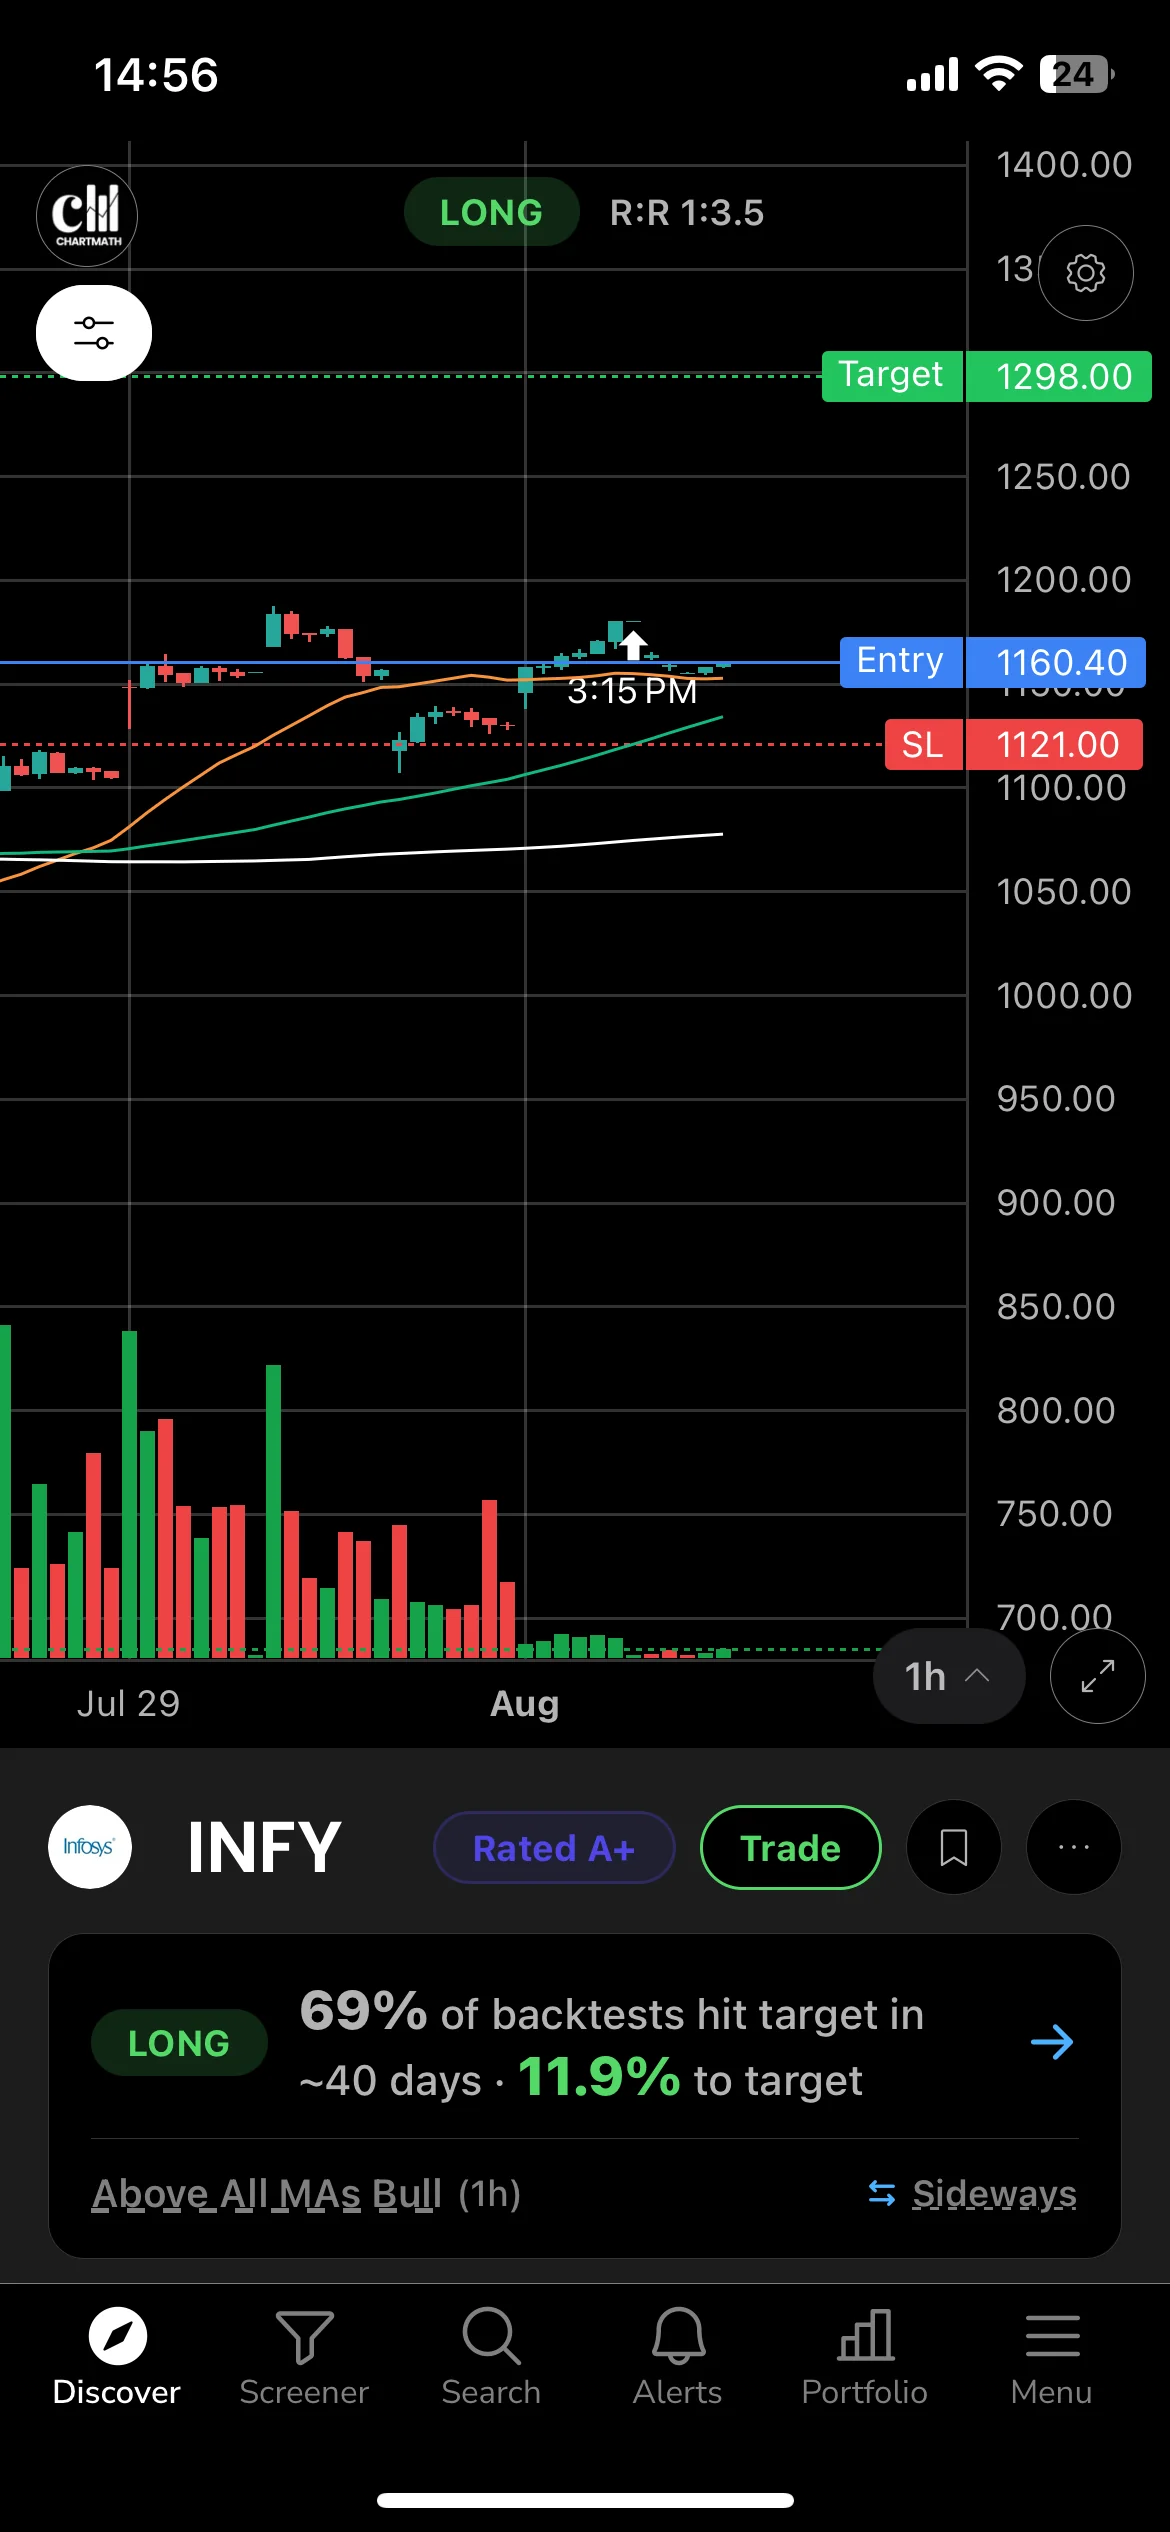
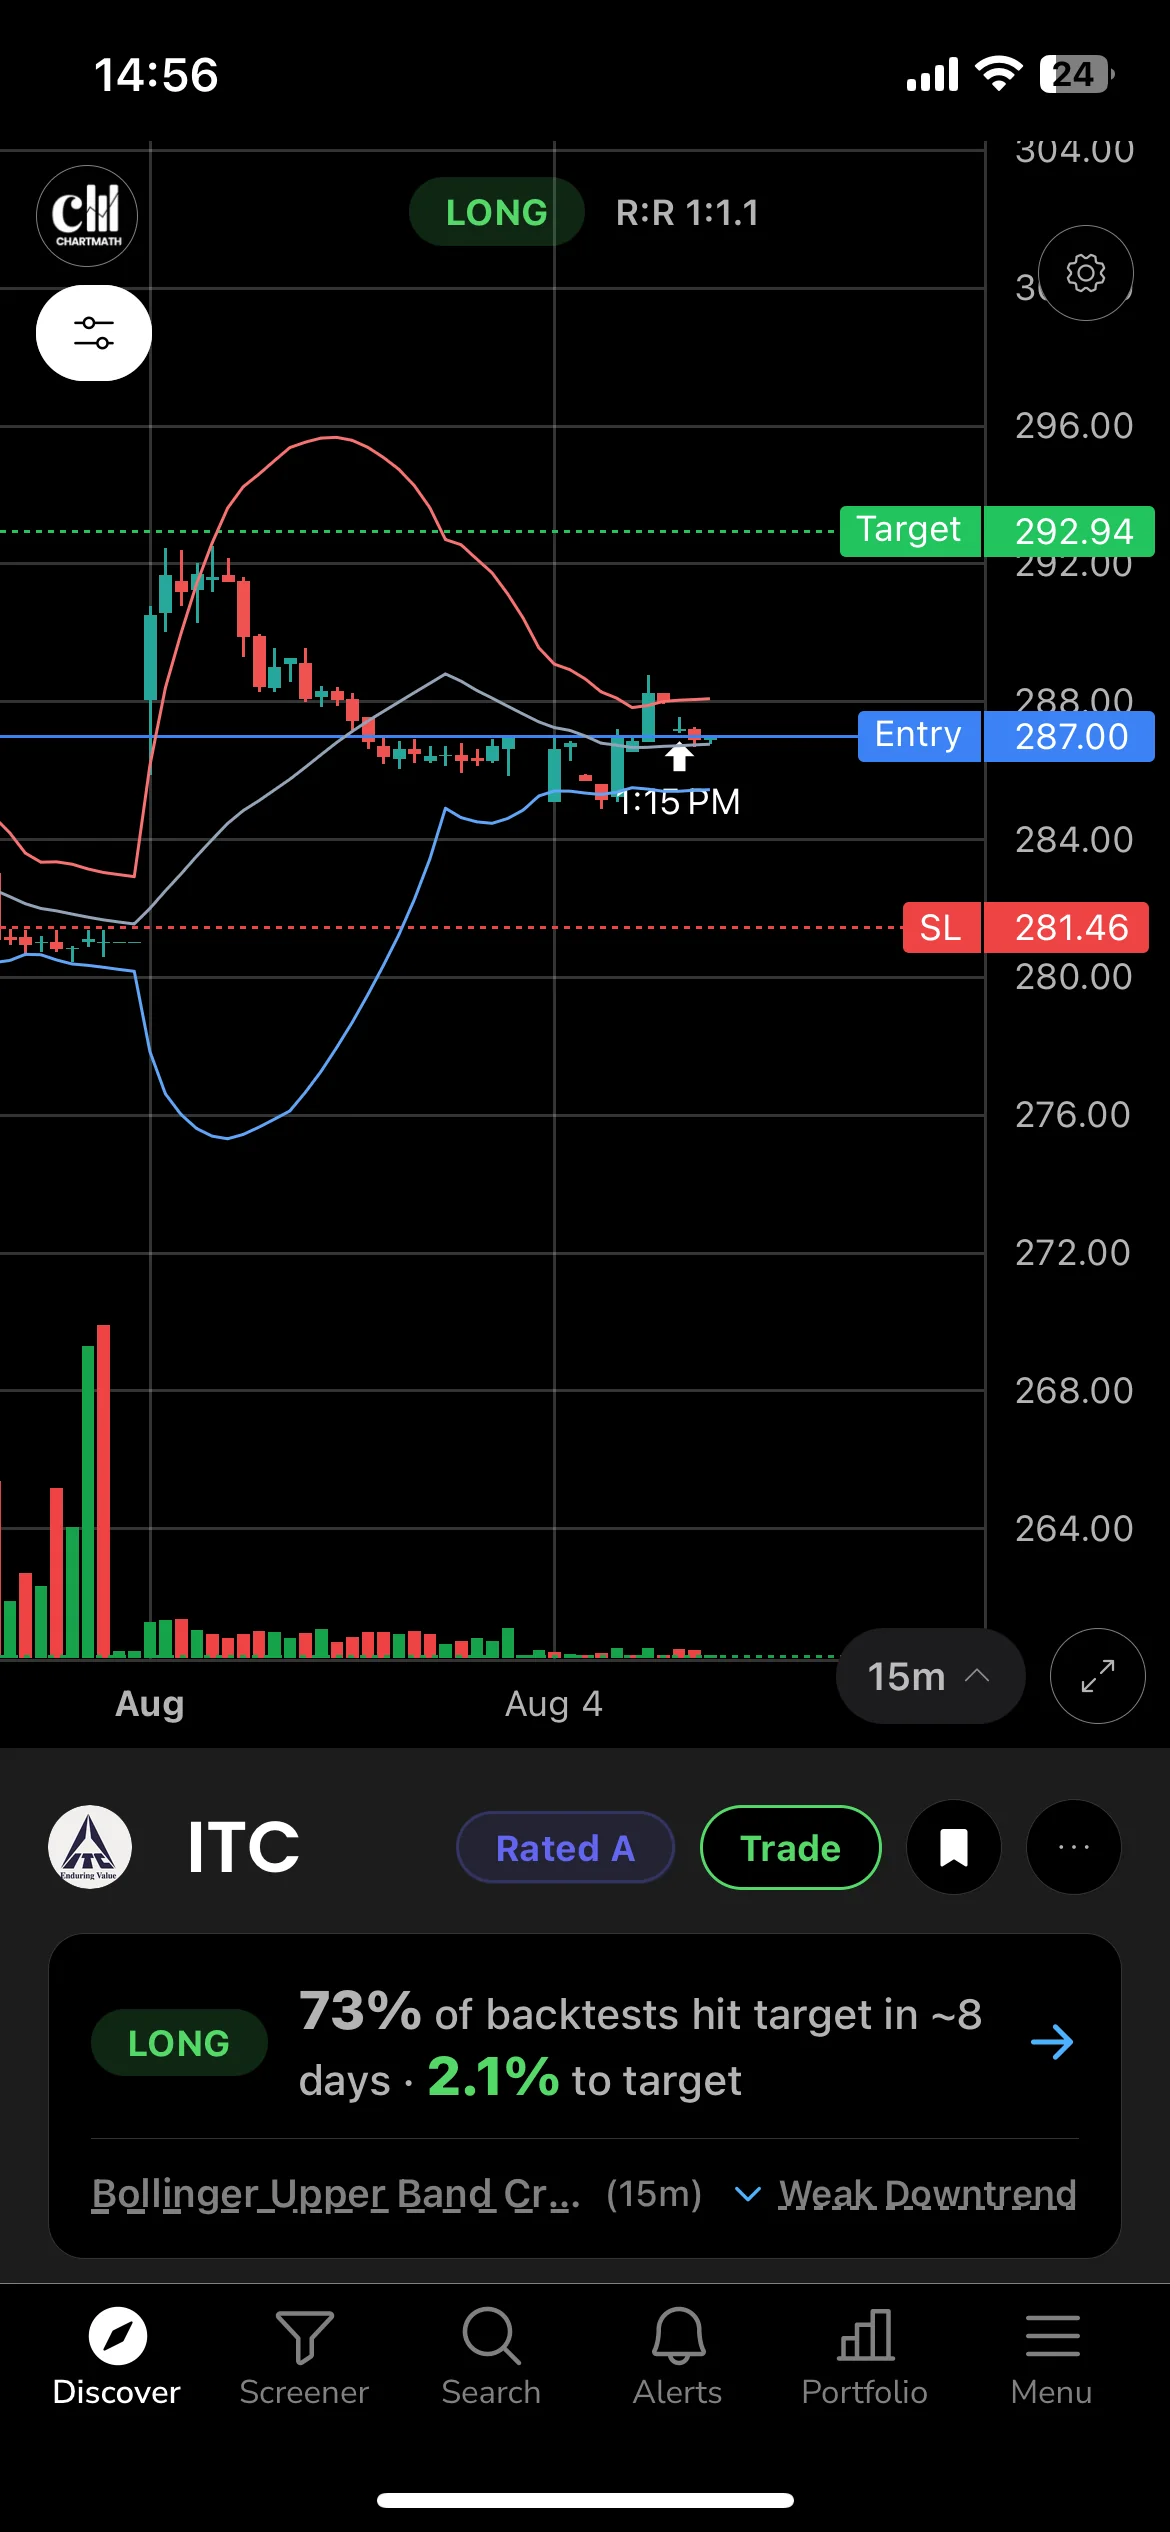
A screener built around backtested rules should be able to translate its own logic into a sentence a non-programmer understands: this stock crossed above its 20 and 50-day averages, a pattern that has triggered a certain number of times historically with a documented win rate. That's a meaningfully different experience from staring at a filter string and guessing at its significance.
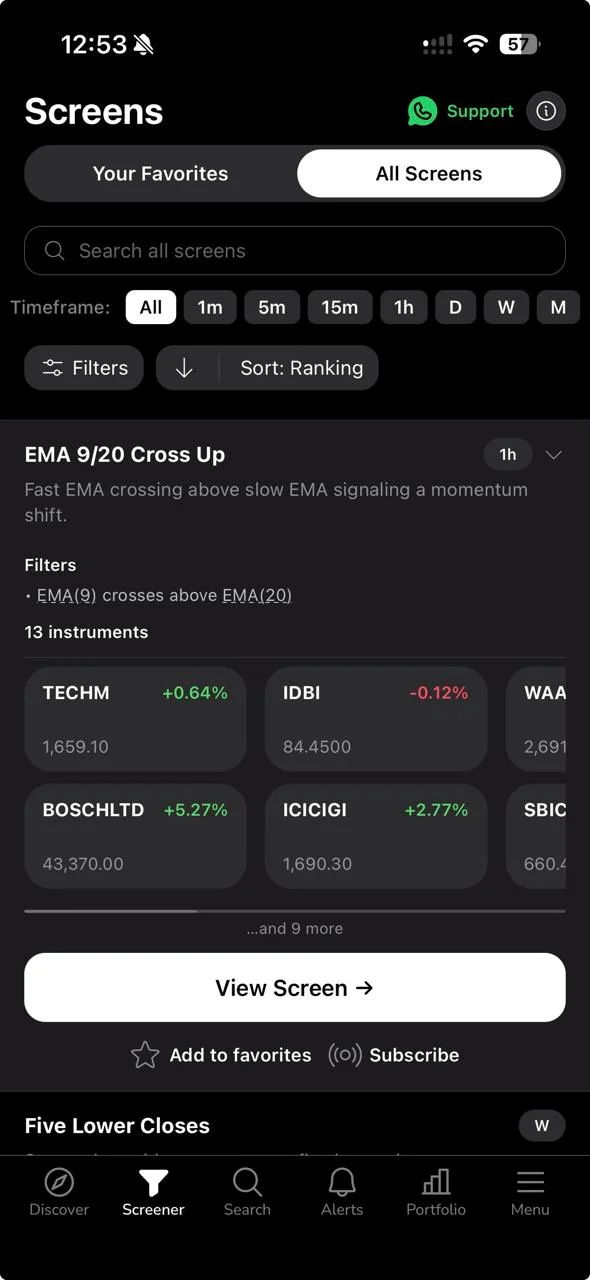
If you're new to reading these outputs at all, our plain-English guide to reading stock scanner results walks through exactly what to look for on a results page before you trust it.
3. Does the Track Record Belong to the Rule, or to One Lucky Chart?
Ask one question of any track record you are shown: is this a property of the rule, or a property of one chart someone chose to show you? A fixed rule run over a defined universe produces a number anyone with the same data can reconstruct. A single "this one hit target in three days" example produces a number you can only take on faith. Both look like evidence. Only one of them survives being checked.
Small sample sizes are the trap here. One good trade, or even five, tells you almost nothing about a rule's real edge. Our piece on why a high win rate doesn't equal profitable trading goes deeper into how sample size and risk-reward interact, which is exactly the kind of nuance a screenshot never shows you.
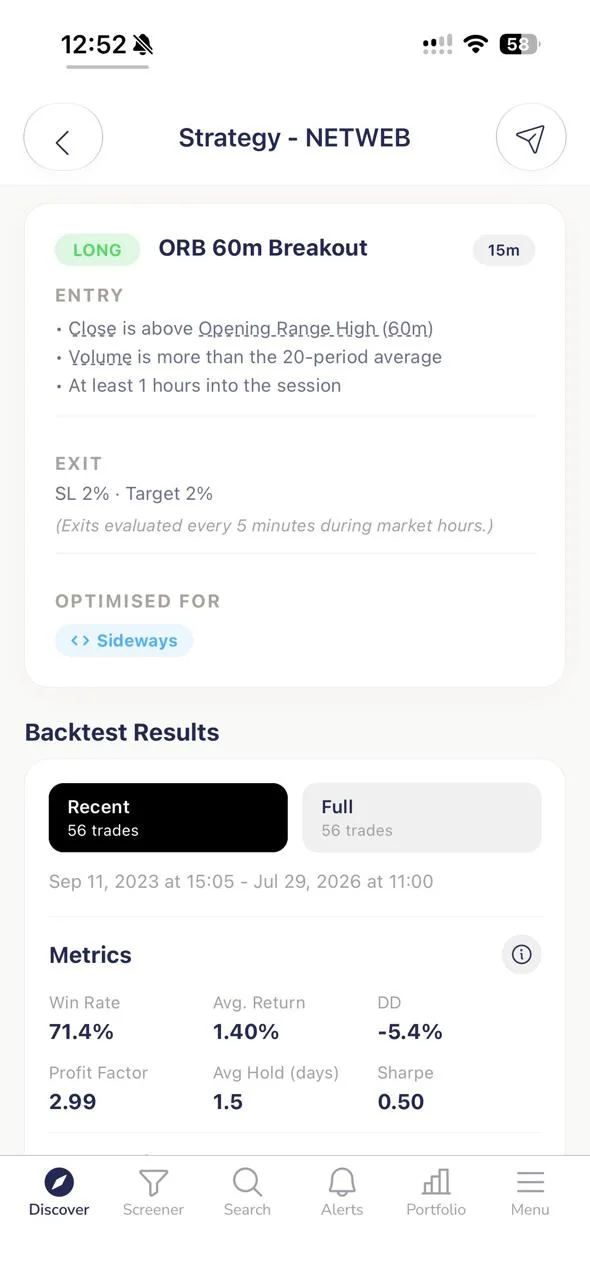
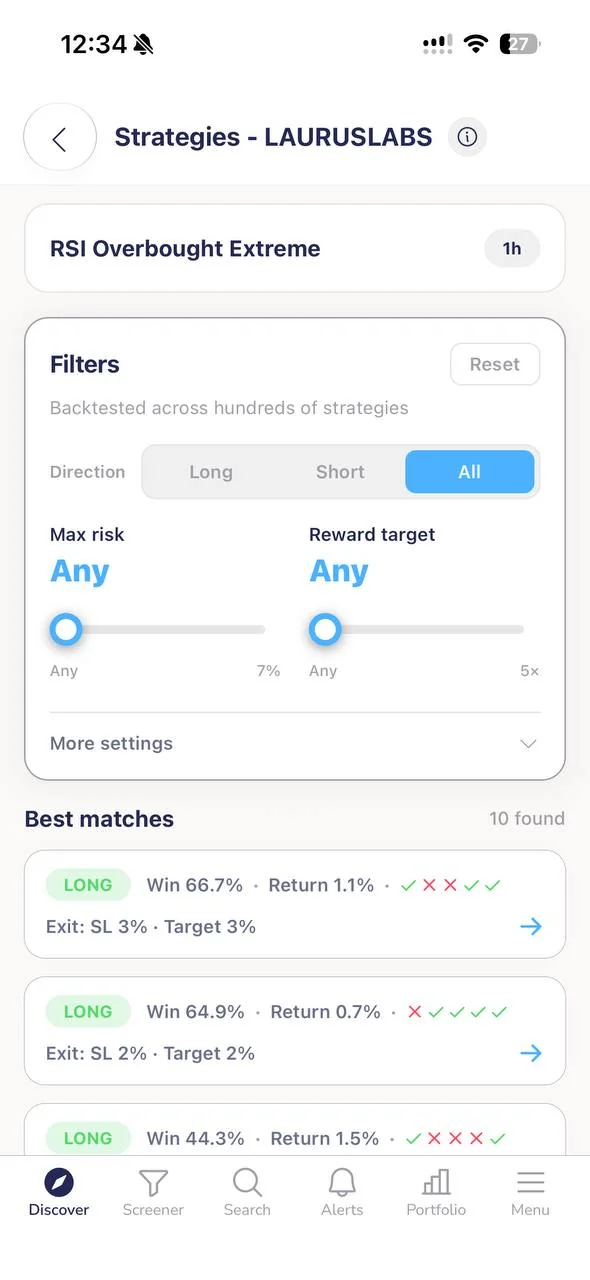
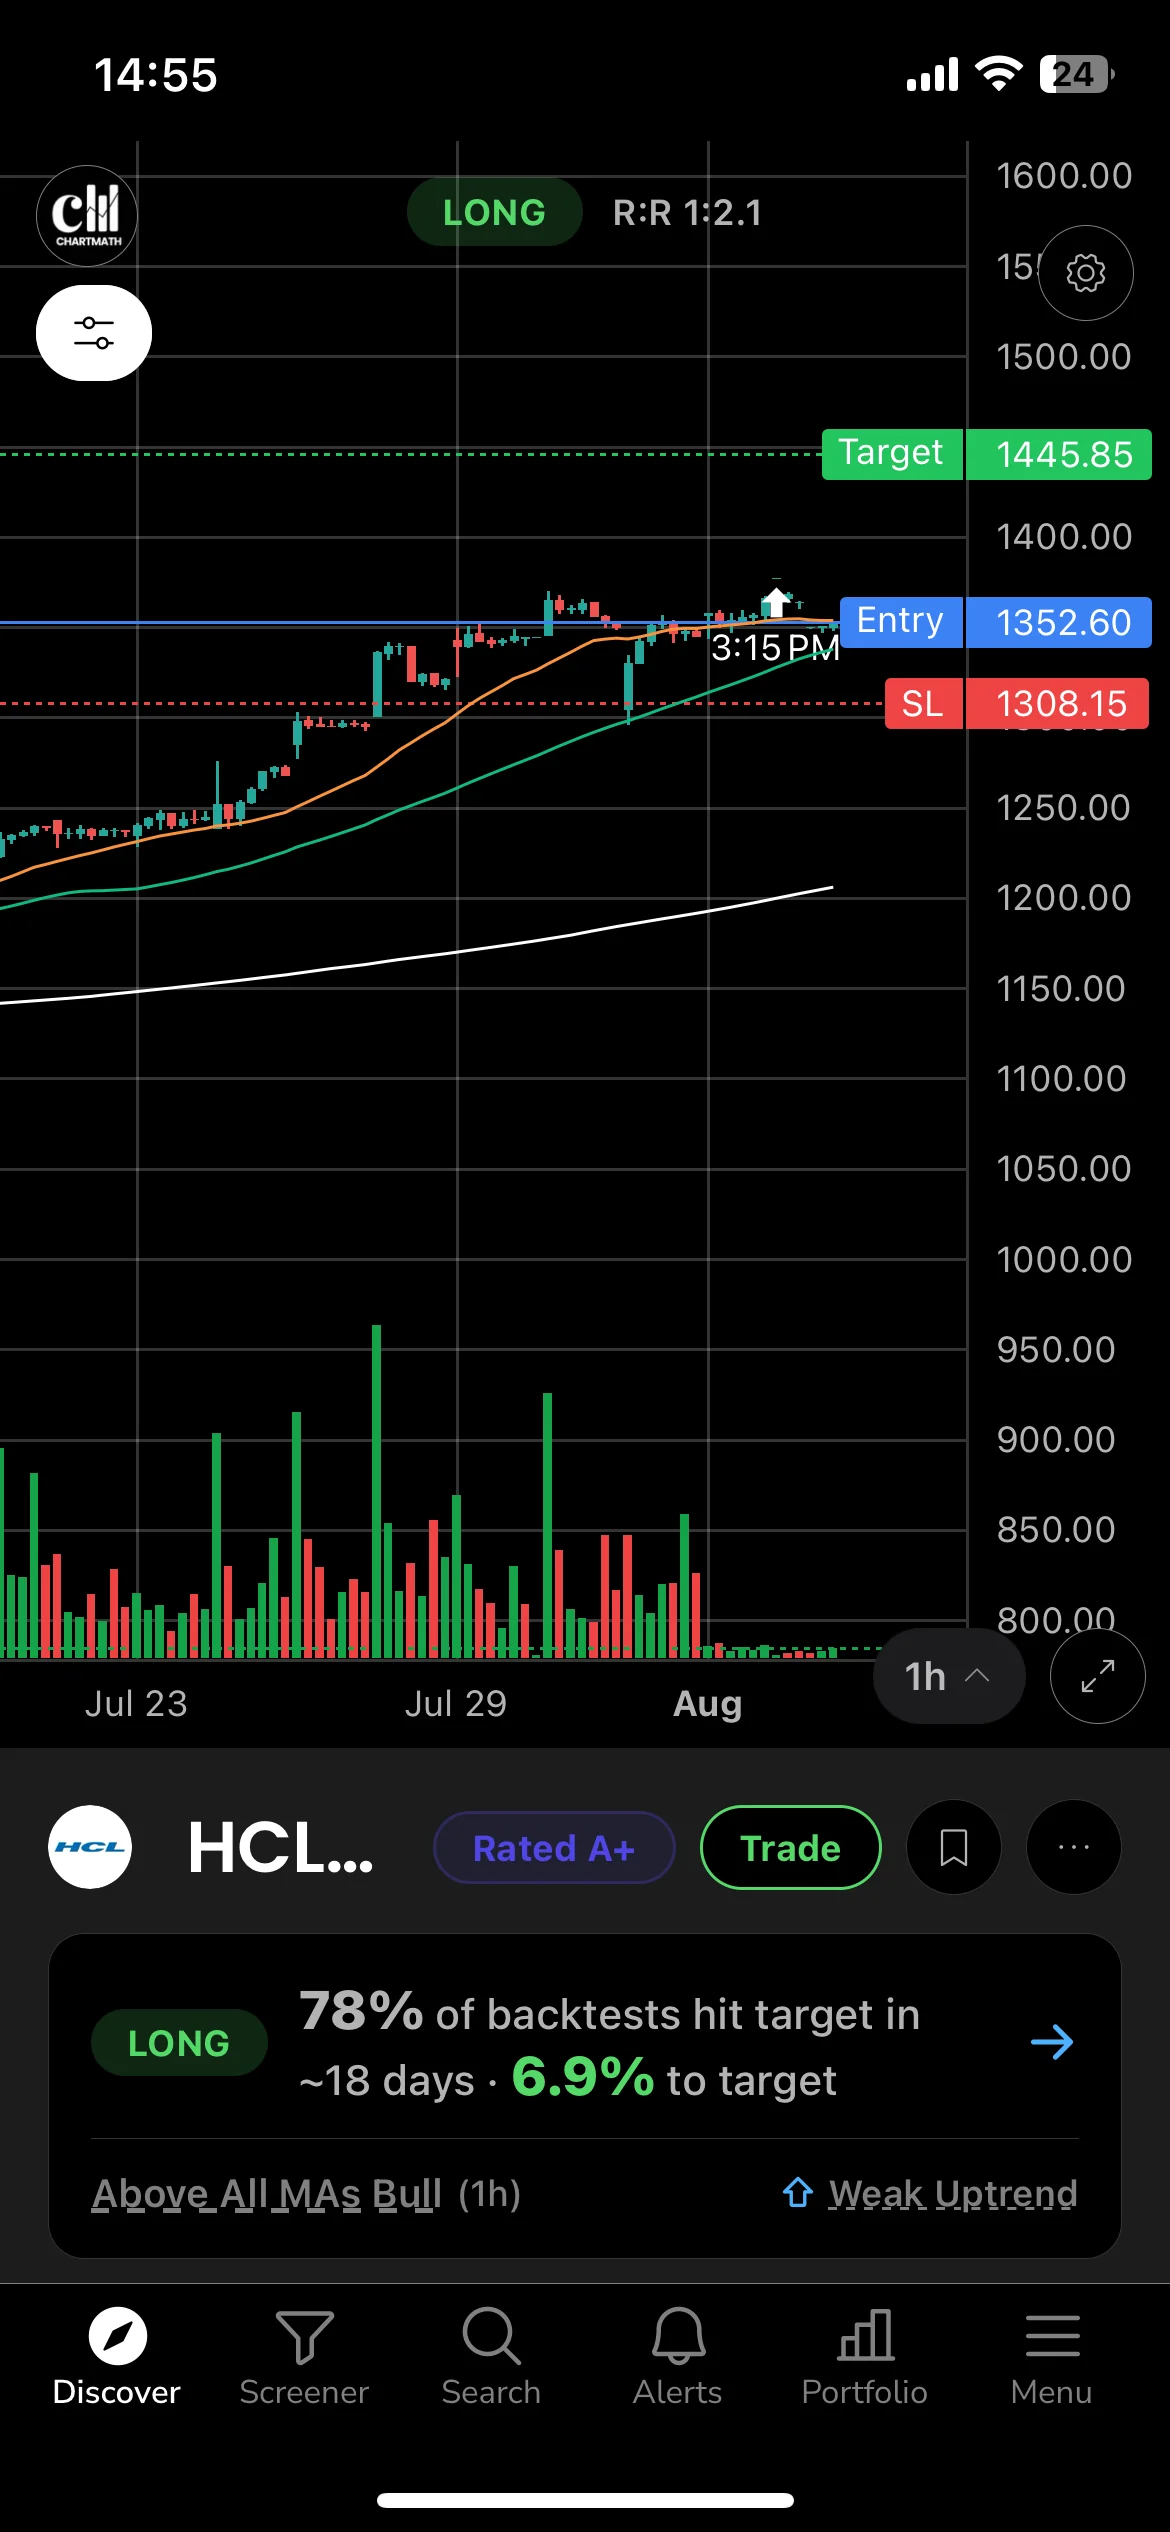
ChartMath's approach here is to attach a recomputable backtested win rate to every one of its 200+ screens, because each screen is a fixed, deterministic rule rather than a discretionary call. That means the number isn't a promise about tomorrow, it's a documented record of what that exact rule has done historically, which you're free to be skeptical of and check yourself.
4. Does It Fit the Hours You Actually Have?
NSE market hours run 9:15 AM to 3:30 PM IST, right through the middle of a typical workday. If your screener requires you to sit at a desk refreshing a browser tab to catch a setup, it's built for someone with a different schedule than yours. Push alerts that reach your phone the moment a condition triggers matter more than almost any other feature on this list, because they're what lets you keep your job and your trading practice at the same time.
Some tools are designed for end-of-day review, which suits swing traders who plan trades at night and execute the next morning. Others push alerts in real time throughout the session. Neither is wrong, but you should pick based on when you're actually free to look at your phone, not on which one has more buttons.
5. Does It Need Coding?
Chartink and TradingView both let you build custom scans, and that flexibility is real value if you're willing to learn their formula syntax or Pine Script. But learning a scripting language is a genuine cost, measured in hours, and most salaried traders don't have those hours to spare on weekday evenings.
Pre-built, ready-to-use screens skip that step entirely. You're trading off customization for speed to first signal. If you already read charts and indicators comfortably but have never written a line of code, a library of pre-built screens gets you scanning today instead of in three weekends.
6. What Is the Real Total Cost of the Stack?
Nobody uses just one tool. In practice, a working NSE swing trader often ends up paying for a scanner, a separate charting subscription, a fundamentals site for company checks, and sometimes a paid Telegram or Discord channel on top. Each piece might seem reasonable alone. Added together, it's a meaningful monthly outlay for overlapping functionality.
Before subscribing to anything, list out what you'd actually need: scanning, charting, fundamentals, and alerts. Then check whether one tool covers two or three of those instead of one. That arithmetic matters more than any single feature comparison.
Screener Categories, Honestly Reviewed
Condition Scanners (Chartink)
Chartink's strength is flexibility. If you know what technical condition you want to test and you're willing to write it, Chartink will scan the market for it. Its limitation is that you're on your own for validating whether that condition has actually worked historically. It's a filter engine, not a research engine.
Fundamentals-Led Platforms (Screener.in, Tickertape, Trendlyne)
These platforms are built for a different job: screening on financial ratios, valuation, and company fundamentals rather than short-term technical setups. Screener.in in particular is a well-regarded resource for fundamental research. If your swing trades are built on catalysts like earnings or valuation gaps, these belong in your toolkit. They're not designed to catch a five-day technical breakout, though.
Education-Plus-Scans (StockEdge)
StockEdge pairs scans with structured learning content, which suits someone who wants to understand market concepts while they screen. That educational layer is valuable for beginners specifically. The tradeoff is that the scanning depth and technical-signal explanations are usually lighter than a dedicated backtested screening tool.
Charting Platforms (TradingView)
TradingView remains the standard for manual chart analysis and custom indicator building. Its screener functionality exists but isn't its core strength, and building a backtested strategy on it usually means learning Pine Script. If you want to eyeball charts yourself and layer your own analysis, it's excellent. If you want a rule that tells you it fired and why, on its own, it needs more setup work.
Backtested Screens (ChartMath)
ChartMath's screens are built around a different premise: each of 200+ screens is a fixed, deterministic rule with its own backtested win rate that can be recomputed rather than taken on faith. On the NSE side, it currently runs against actively traded NSE-listed equities, with alerts delivered by push notification the moment a stock matches, and a plain-English reason attached to every card. You can browse the live logic yourself, including screens like momentum screens for sector-specific names, on the screen pages, and it's free with no credit card required to start. Those pages run the US universe; the NSE side runs in the app, where you switch the market to India.
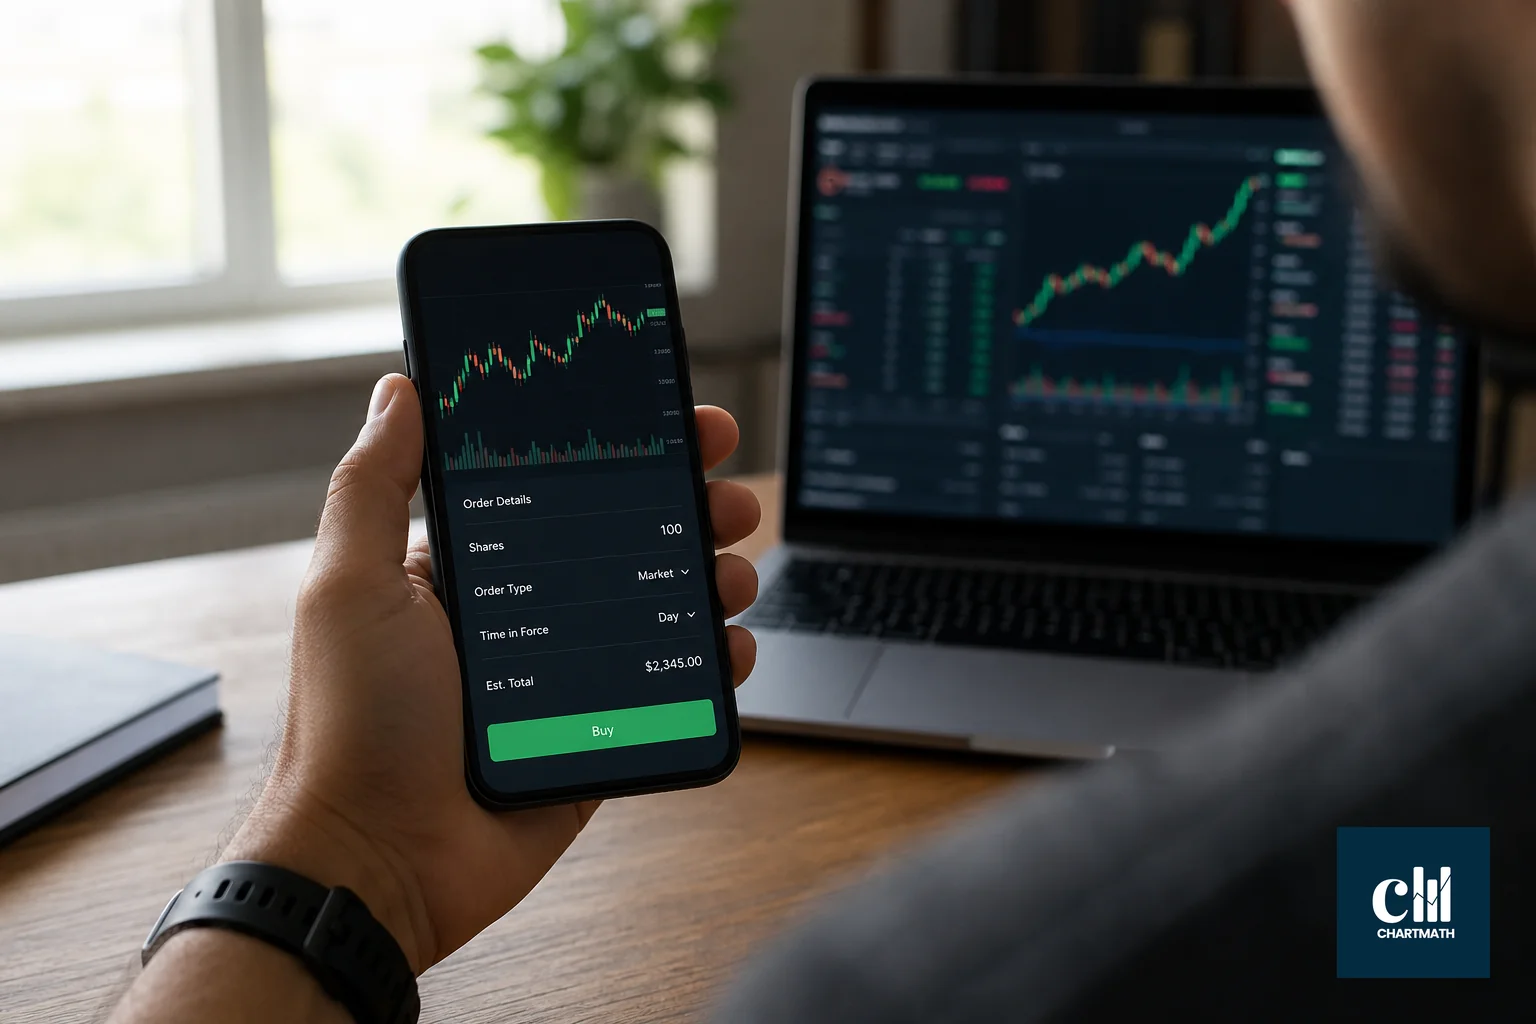
It's worth being precise about what this is and isn't. ChartMath is a copilot, not an autopilot: it narrows down which stocks meet a rule, but you decide whether to act, and you place every trade yourself. There's no order routing into your broker and nothing trades on your behalf.
Who Should Pick What: The Verdict
If you enjoy building your own logic and have time to learn formula syntax, a condition scanner like Chartink gives you the most control. If your swing trades hinge on company fundamentals and valuation, a fundamentals-led platform is the right primary tool, with a technical scanner as a supplement. If you're new to markets and want to learn while you screen, an education-plus-scans platform earns its place. If you want to build and read charts by hand with full manual control, a charting platform is unmatched for that specific job.
If what you actually want is a stated, recomputable win rate attached to a rule you didn't have to build, delivered as a push alert during your workday instead of a tab you have to babysit, that's the backtested-screens category, and it's the gap ChartMath is built to fill. None of these are mutually exclusive. Plenty of traders run a backtested screener for alerts and a fundamentals site for a final gut check before entry. For a wider look at how to compare tools generally, see our guide to the best stock screener for technical traders.
A Note on Tips, Advice, and SEBI Registration
Be direct with yourself about what any of these tools are for. A screener surfaces stocks that meet a stated rule. It is not a tip, a call, a recommendation, or a promise of return, and you should be suspicious of anyone selling a screener alongside language like "guaranteed profit" or "assured returns." Historical performance, even when recomputable, does not predict future results.
ChartMath's screens for India are educational tools, not investment advice. The following applies to any India-facing use of the product: Educational use only. Not a broker/dealer or investment adviser and not registered with SEBI. Past performance does not indicate future results.
Recap: The Six-Question Checklist
- Can the tool state its exact universe, exchange and instrument count, out loud?
- Can it explain why a stock matched in plain English, not just a formula?
- Is its track record recomputable, or is it a screenshot you have to trust?
- Does it deliver alerts in a way that fits 9:15 to 15:30 IST market hours while you're at work?
- Does it require you to learn a scripting language before you can use it?
- Have you added up the real monthly cost of the full stack you'd need?
Run any screener through these six questions before you pay for it, whether that's Chartink, Screener.in, StockEdge, TradingView, or ChartMath. If you want to see how a backtested-screens approach answers each of these, browse the live logic behind a named screen: the 52-week high with volume screen (daily), the above all moving averages screen (daily), or the NR7 bull break screen (daily). Each states its own rule and its backtested record, so you can apply question three to it directly. Or download the app and check the reasoning behind a live alert yourself. It's free, with no credit card required, so the only real cost of checking is a few minutes of your time.

See these setups live in ChartMath
200+ curated screens with backtest data. Free. No credit card required.