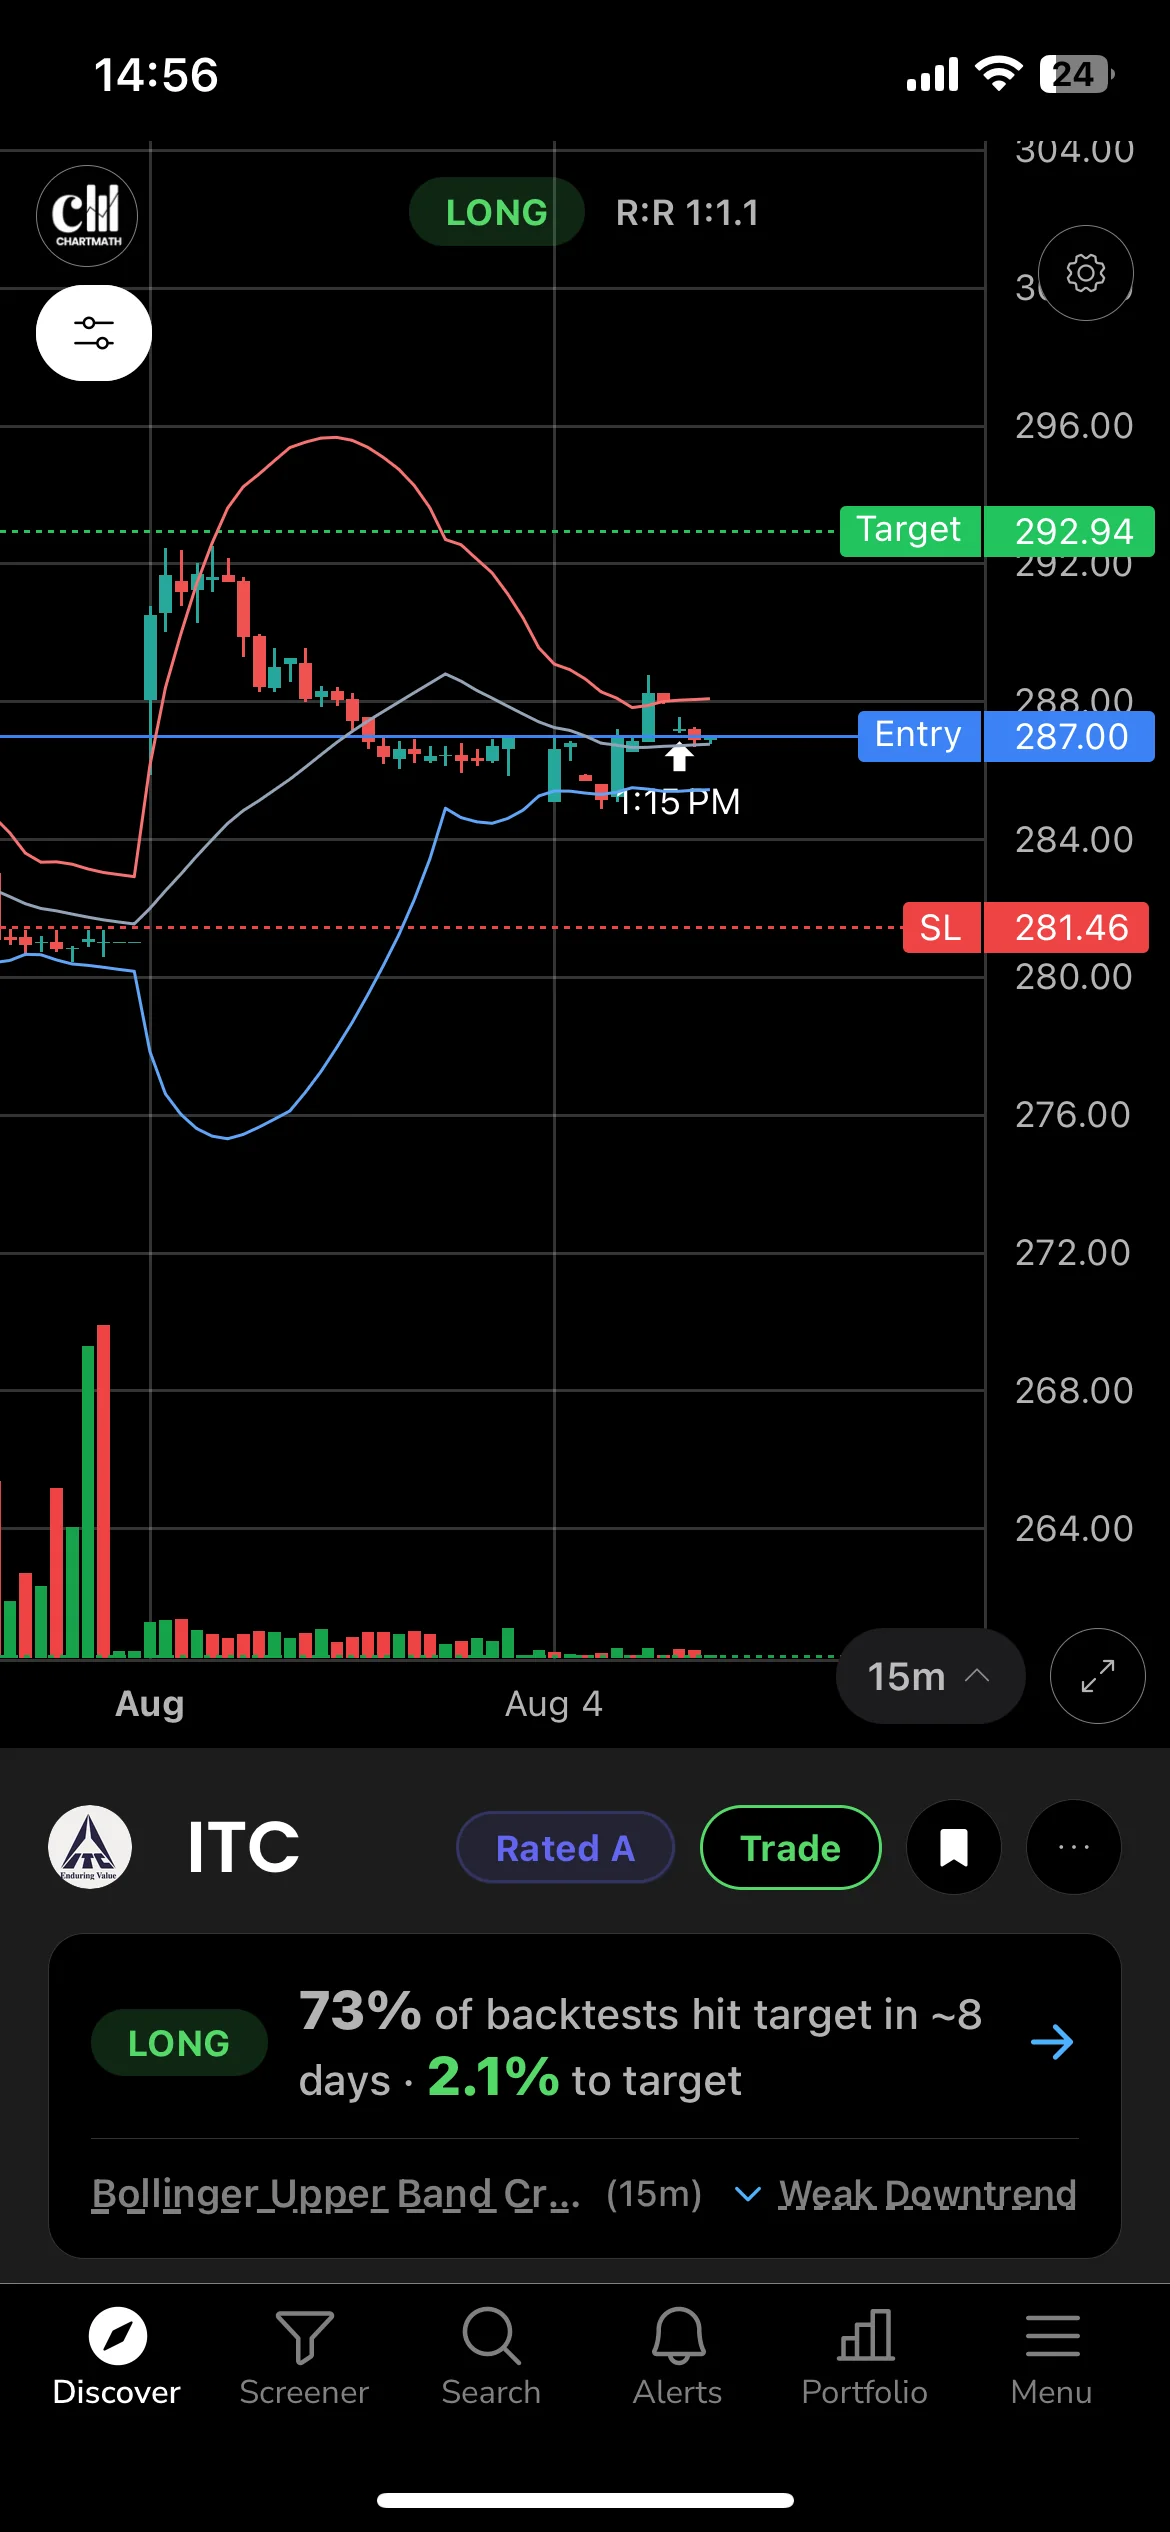
Chartink Alternative: Scan + Win Rate
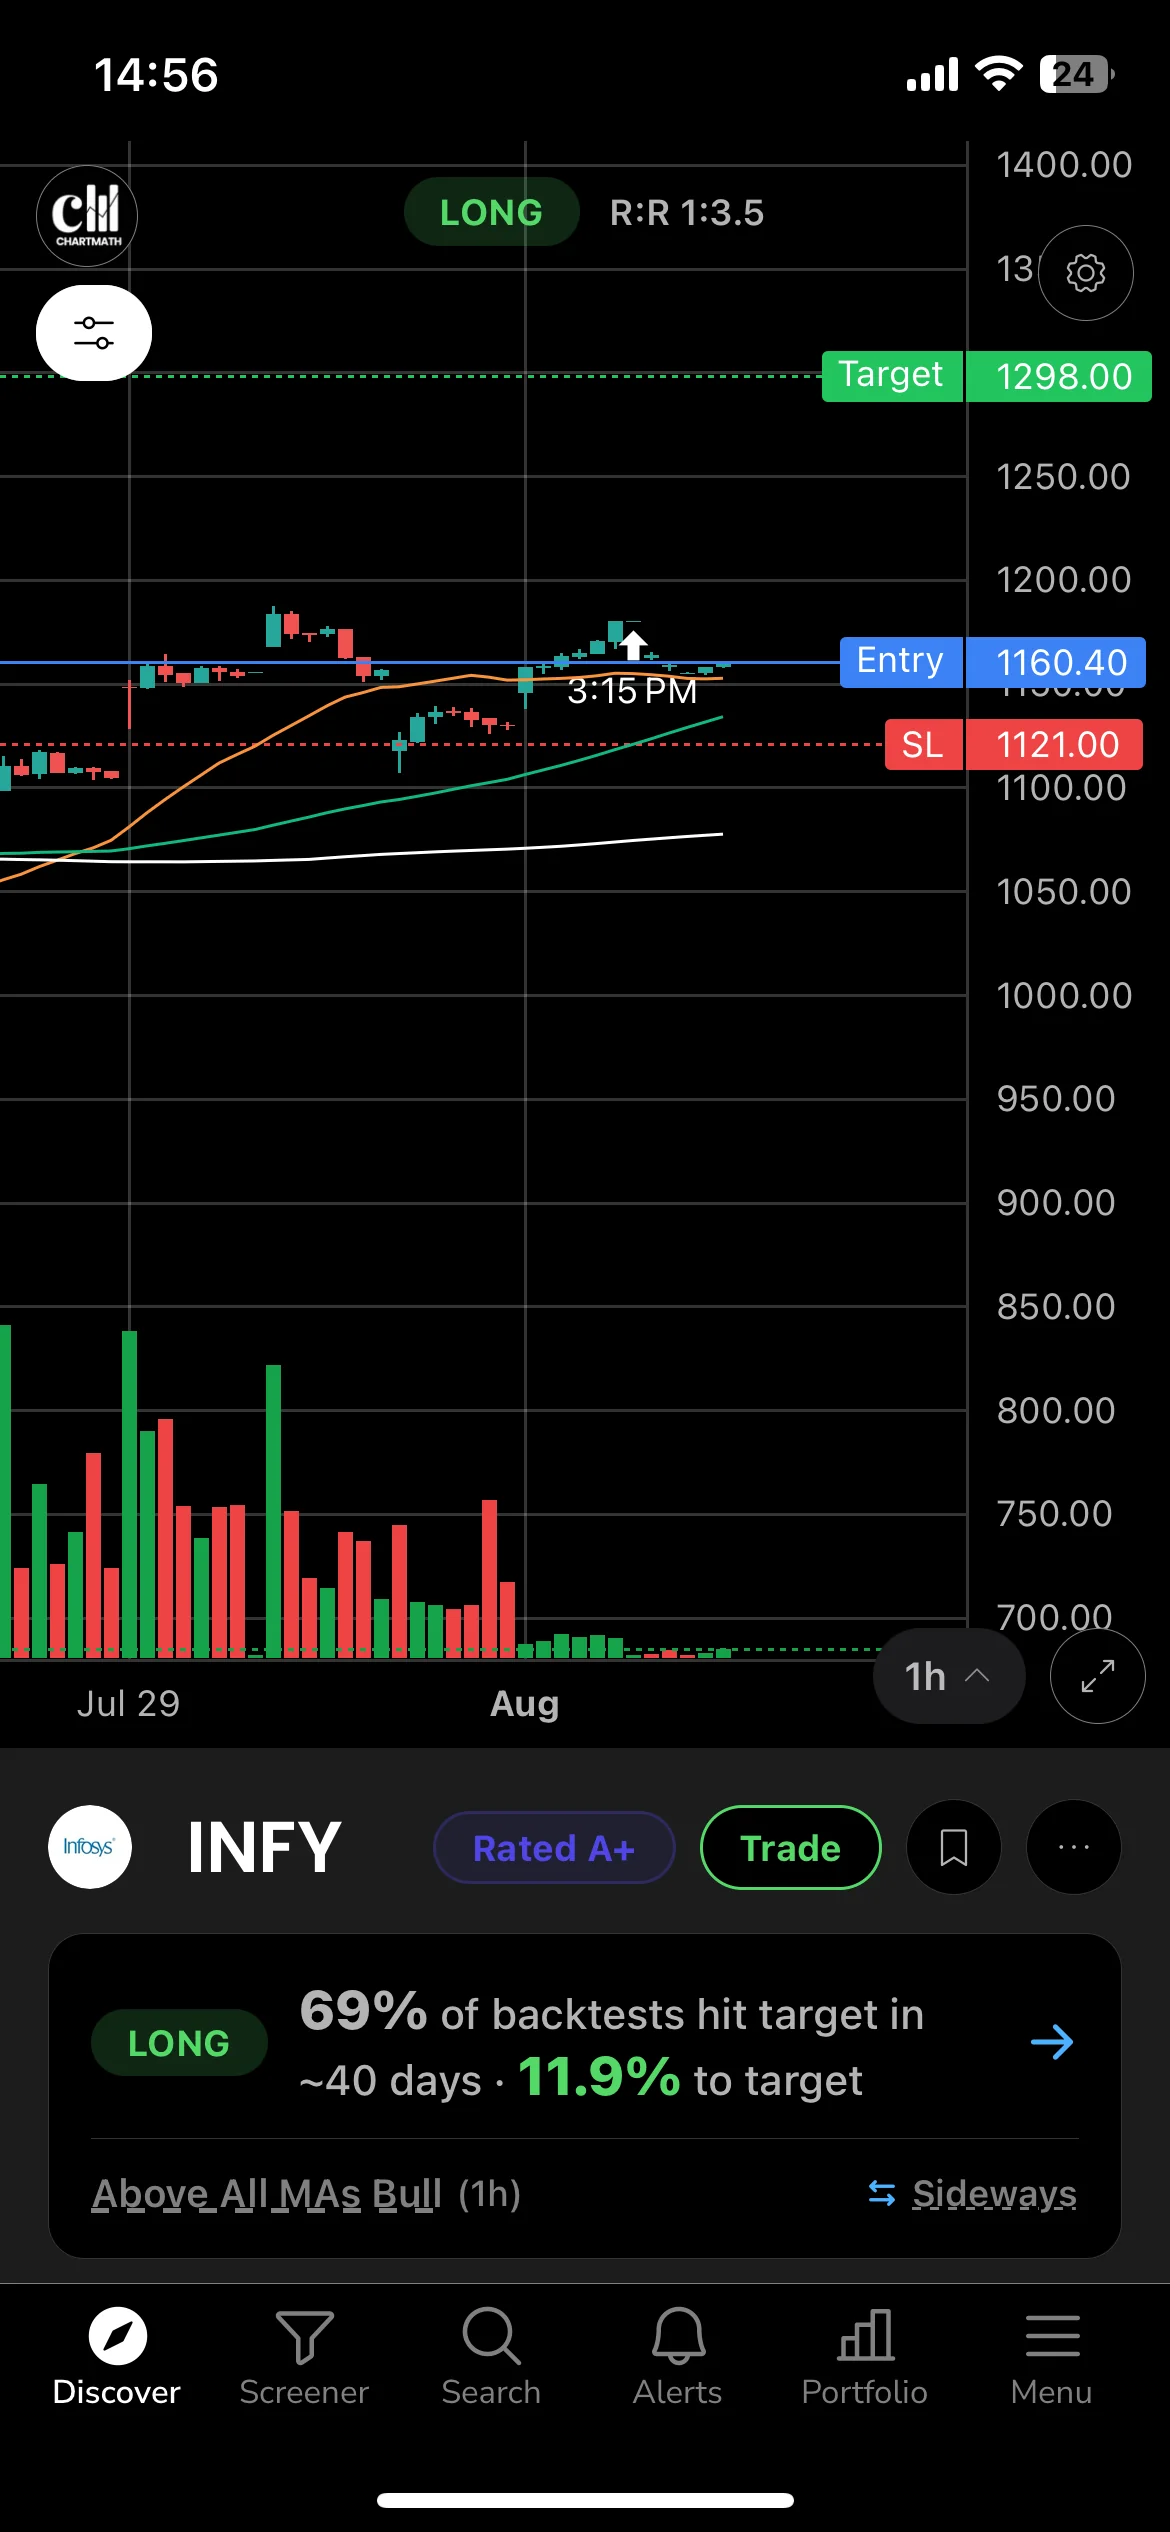
You run the same Chartink scan you always run, hit enter, and 40 tickers land on your screen in under two seconds. That part works. The part that doesn't: nothing on that list tells you whether the condition you just screened has ever actually worked. A genuine Chartink alternative needs to solve exactly that problem, showing you not just who matches a setup today, but how that setup has historically performed before you risk a rupee on it.
Key Takeaways
- Chartink is fast and free: its custom scan syntax and community-shared scans are genuinely useful for quick, ad hoc checks across NSE stocks.
- It attaches zero history to any condition: a scan tells you what matched right now, not how often that match led anywhere useful.
- A backtested screen closes that gap: it reports a win rate and average return computed over every past instance of the same rule.
- ChartMath runs 200+ deterministic screens across NSE-listed stocks, and every screen's track record is recomputable rather than taken on trust.
- This is educational content, not advice: nothing here is a recommendation on any named stock, and no returns are promised.
At a Glance: Chartink vs a Backtested Screener
| Question | Chartink | A backtested screener (e.g. ChartMath) |
|---|---|---|
| Scan speed | Very fast, instant results | Fast, pre-computed screens |
| Cost to start | Free tier available | Free, no credit card required |
| Win rate on a scan | Not shown | Shown per screen, with sample size |
| Custom scan syntax | Yes, full scripting language | No, curated screens only |
| Push alerts to phone | Limited/paid add-ons | Push and email, included |
| Coverage on NSE | Broad NSE universe | actively traded NSE-listed equities |
| Coding required | Scan syntax to write | None, no coding |
The 40-Names-Now-What Moment
It's 9:40 AM. The market has been open ten minutes. You open Chartink, run your usual breakout scan, and 40 names populate the results grid. You scroll. A few tickers look familiar. Most don't. You have exactly one piece of information about each one: it matched the condition right now. You have zero information about whether that condition has ever led anywhere good.
This isn't a one-off. If you've been running Chartink scans for months, you've probably seen this exact scenario hundreds of times. You open the tool, get your list, and then rely on gut feel, chart-reading instinct, or whichever name "looks right" to decide what to actually trade. That's not a knock on you. It's a gap in the tool.
The scan is doing its job. It found stocks matching a rule. What it can't do, by design, is tell you whether that rule has historically paid off, and by how much, and how often it failed. That question sits outside a pure scanning tool's scope.
What Chartink Genuinely Does Better
Give credit where it's due. Chartink built a fast, flexible scanning engine, and for certain jobs it's still the right tool.
- Custom scan syntax: if you have a very specific, unusual condition in mind, Chartink's scripting language lets you write it exactly the way you want, no waiting on someone else to build it.
- Free tier and low cost: you can run real scans without paying anything, which matters if you're just testing an idea.
- Community-shared scans: thousands of scans built by other traders are searchable and copyable, so you rarely start from a blank page.
- Browser-based, no install: for a quick one-off check on a stock outside a fixed universe, opening a browser tab beats downloading an app.
None of that is in question. The issue is narrower and sharper: once you've found a condition worth repeating week after week, Chartink has no built-in way to tell you if it's actually worth repeating.
The Evidence Gap: What's Happening Now vs What Usually Happened Next
Here's the distinction that matters. A scan answers "what is true right now." A backtested screen answers a different, more useful question: "what usually happened next, the last several dozen times this exact condition showed up." Those are not the same question, and conflating them is how traders end up trading a condition that looks convincing on the surface but has a mediocre or even negative track record underneath.
Think about the number 40. Forty names matched your scan this morning. Some of those 40 will work out. Some won't. Without a documented win rate, average return, and sample size attached to the rule that generated them, you're guessing which ones fall into which bucket. You're pattern-matching off memory and gut feel, which is exactly the trap our high win rate doesn't equal profitable trading piece unpacks in more depth.
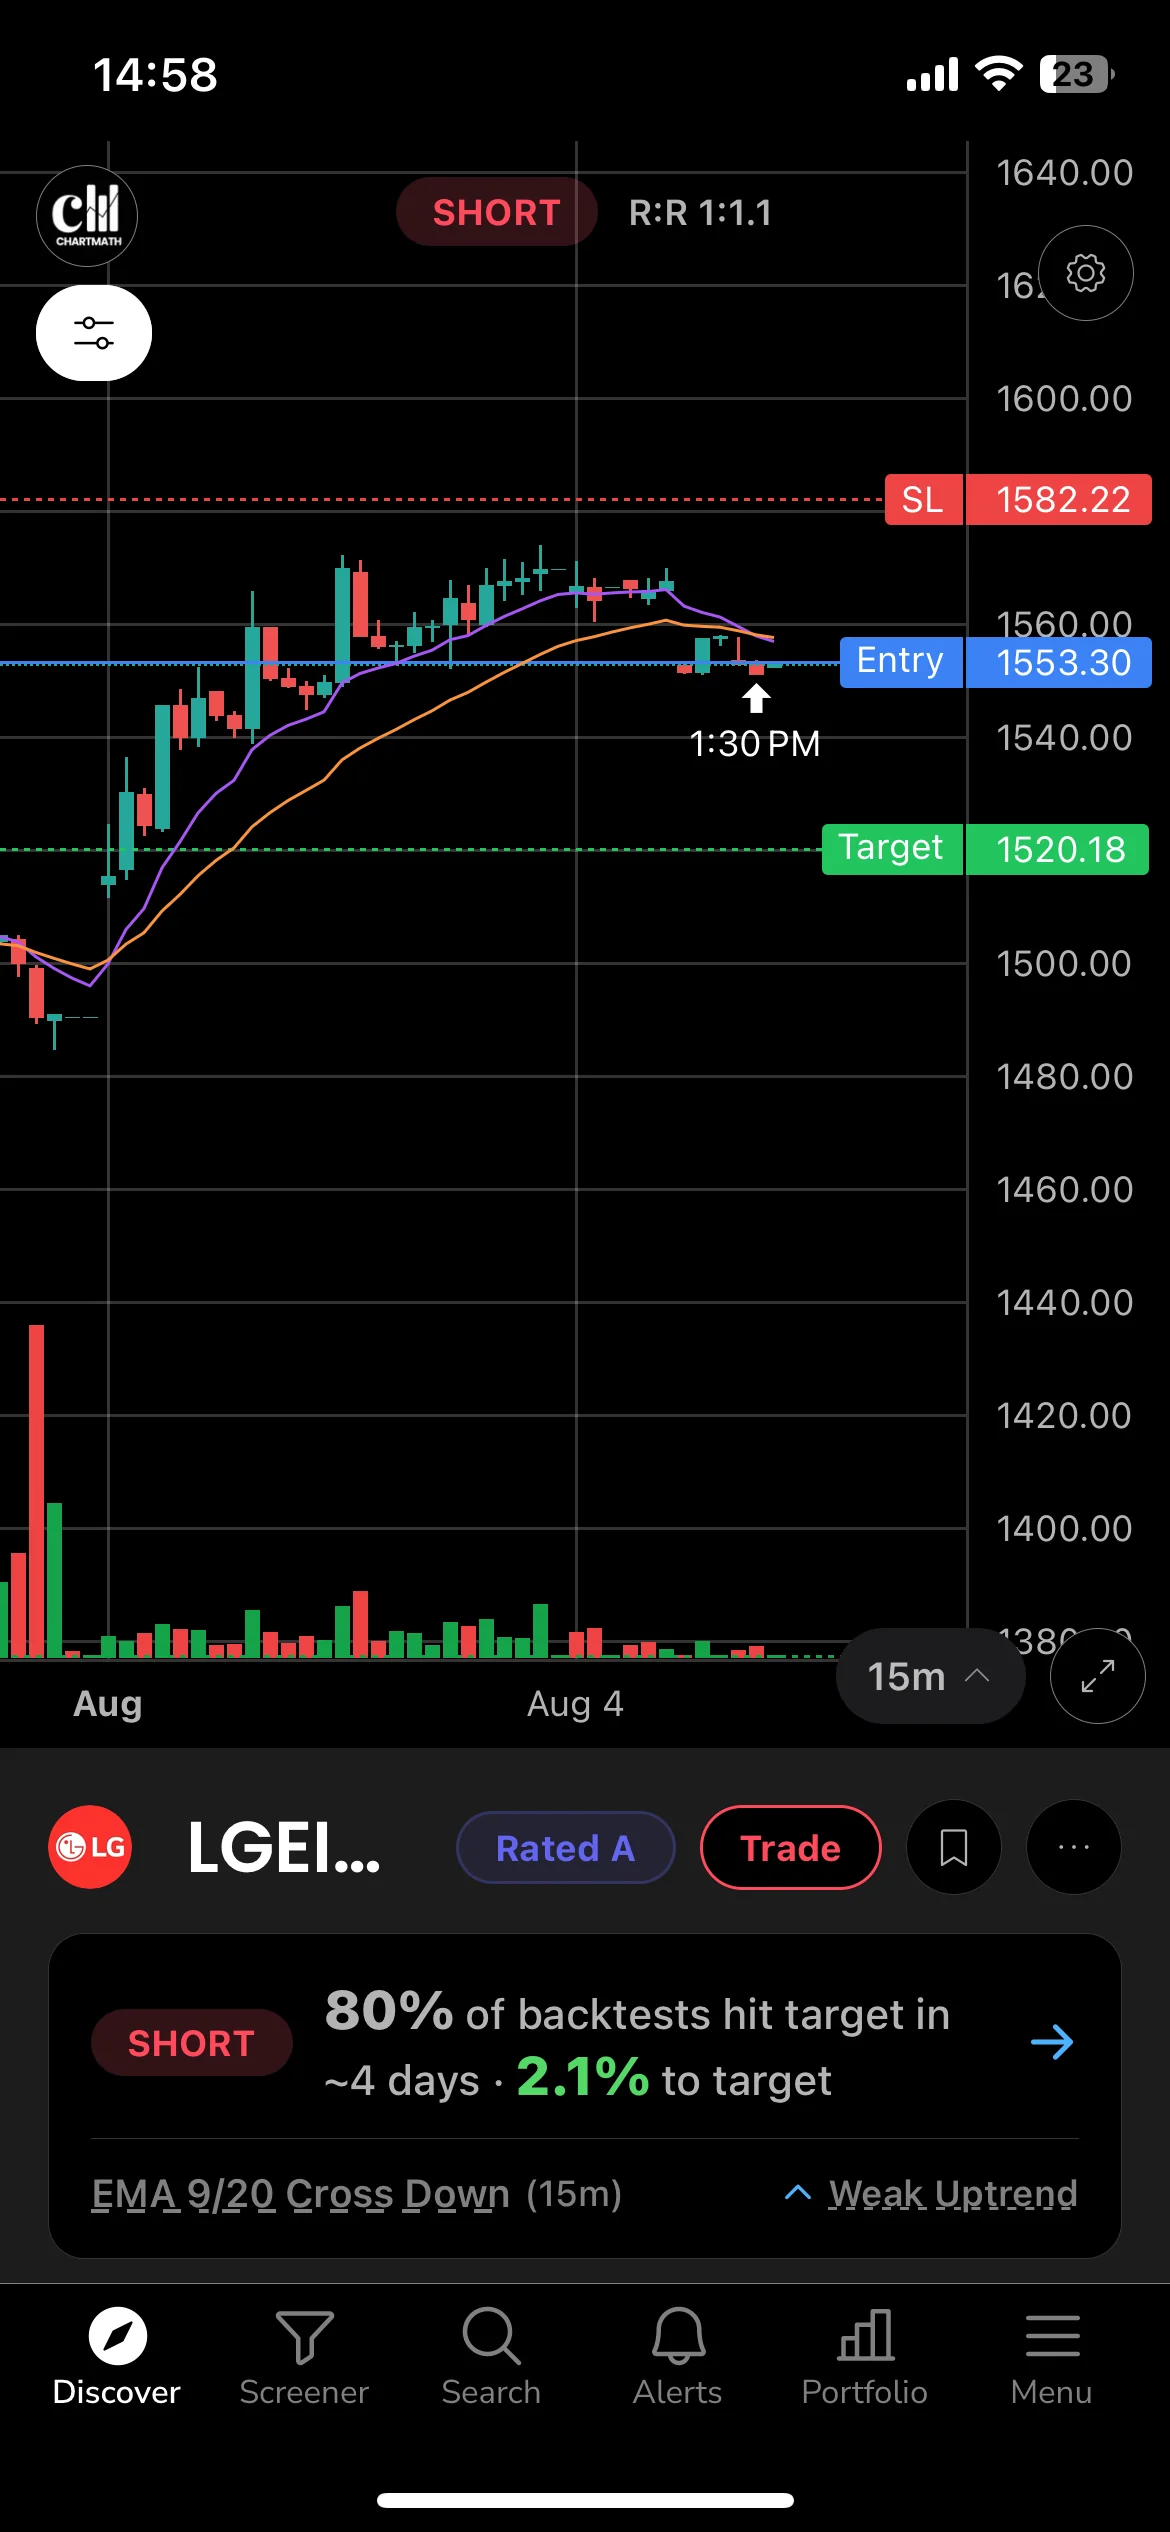
A backtested screen closes this gap by running the identical rule against historical price data and reporting how it actually performed. Not a forecast. Not a promise. A record: this rule matched X times in the past, and here's what typically followed, expressed as a win rate and an average return. Because the rule is fixed and deterministic, that history can be recomputed by anyone at any time, rather than taken on the word of whoever posted the scan.
This is the core reason a growing number of Indian retail swing traders are looking for a screening tool that goes one layer deeper than a live scan. As the U.S. Securities and Exchange Commission notes in its investor guidance, verifying claims with independent evidence is a basic protection every retail investor should apply, and the same logic extends to trading rules: verify the rule's track record before you repeat it.
Chartink vs ChartMath: A Side-by-Side Comparison
To make the comparison concrete, here's how the two tools stack up on the things that actually decide whether a screen is worth trading.
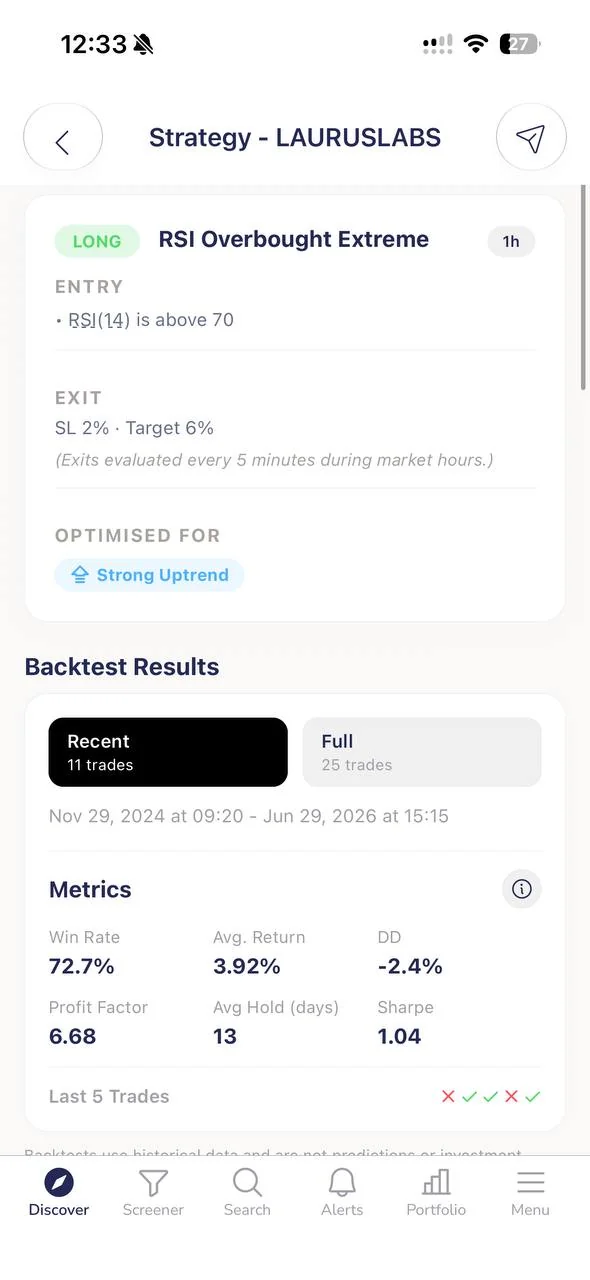
| Feature | Chartink | ChartMath |
|---|---|---|
| Live scanning of NSE conditions | Yes, custom scripted | Yes, across 200+ pre-built screens |
| Backtested win rate per screen | Not provided | Shown on every screen, with matched sample size |
| Average return per screen | Not provided | Shown alongside win rate |
| Plain-English reason for a match | You read your own script | Every alert states why it fired |
| Push alerts on match | Add-on, limited | Push and email, included |
| NSE coverage | Broad, user-defined universe | actively traded NSE-listed equities |
| Coding or scripting needed | Yes, scan language | No, no coding, no Pine Script |
| Custom condition builder | Yes | No, curated screens only |
Notice the trade-off. Chartink wins on flexibility and custom scripting. A backtested screener wins on evidence: it will not let you trade a rule blind. If you already know exactly what condition you want and it's unusual, Chartink still has the edge. If you want to know whether a common, repeatable setup is worth trading at all, that's the evidence gap a screen with an attached win rate is built to close.
How to Check a Screen's History Yourself
Before you repeat any scan for the tenth time, run this quick check. It takes under a minute and it changes how you treat the results.
- Open the screen, not just the scan output. Look for a dedicated screen page rather than a bare list of matched tickers.
- Find the win rate and average return. These should be labeled clearly, computed over the screen's full matched history, not a single recent trade.
- Check the sample size. A win rate from 8 historical matches means far less than one computed from 150. Always look for the trade count next to the percentage.
- Read the exit rule. A win rate is meaningless without knowing what "win" means: is it end-of-day, a fixed stop and target, or a trailing exit? A trustworthy screen states this plainly.
- Confirm the timeframe matches how you actually trade. A daily screen and an hourly screen can carry very different win rates for what looks like the same setup.
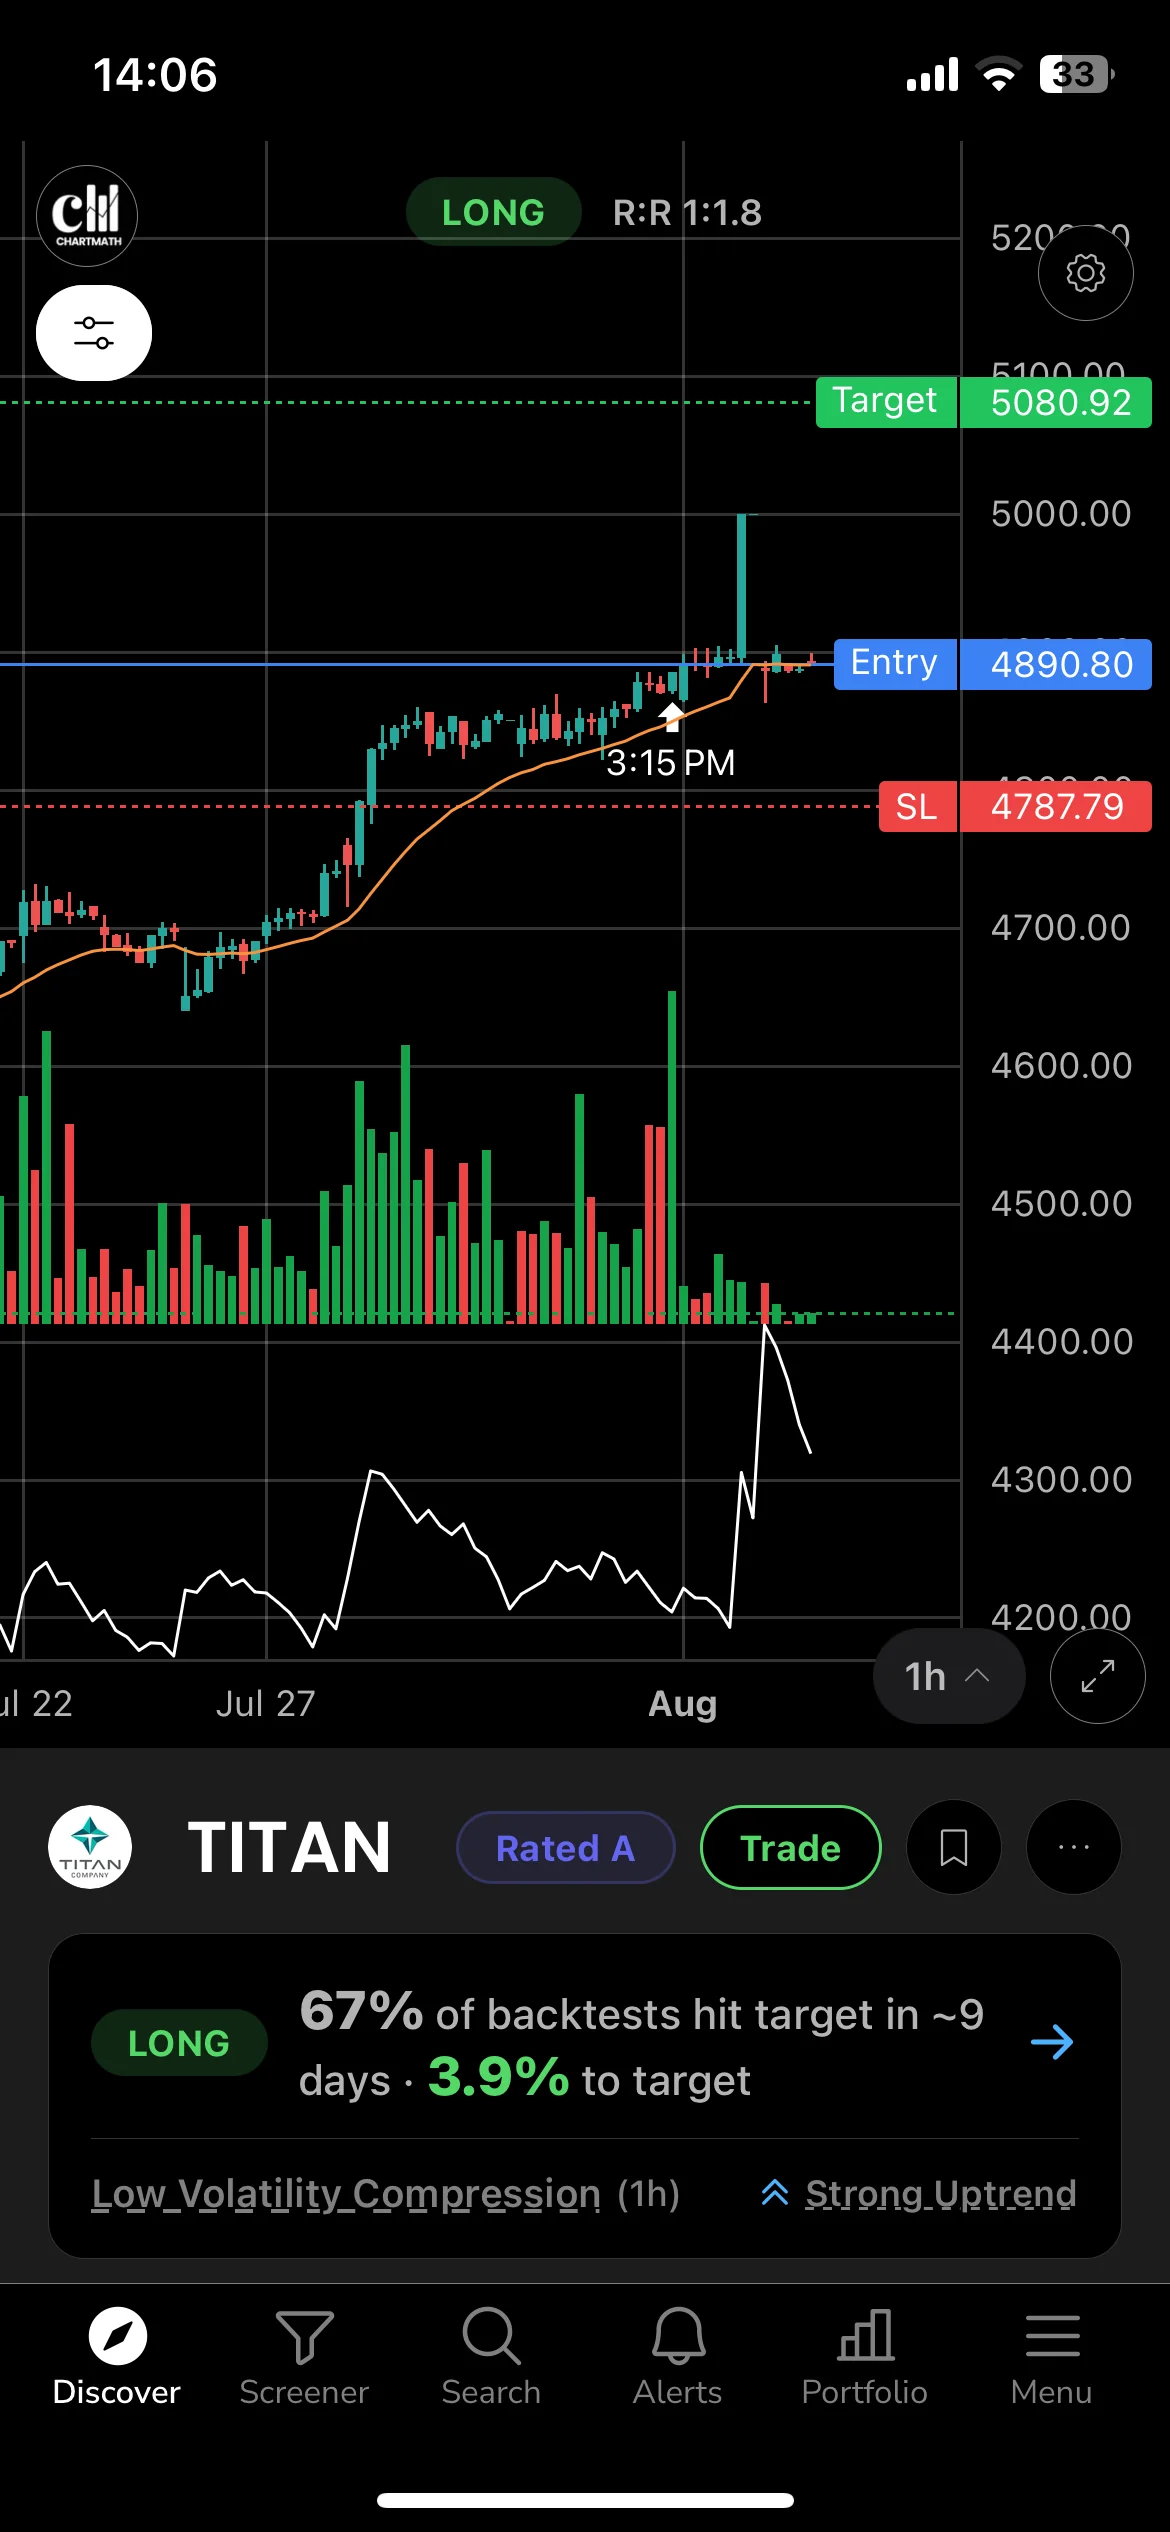
You can practice this on real, named screens right now. Look at the Golden Cross Daily screen, the RSI Oversold Bounce and Capitulation Daily screen, or the 20-Day Consolidation Breakout Daily screen. Each one shows its matched instrument count, its win rate, and its average return, so you can judge for yourself whether the setup is worth tracking before you commit to trading it repeatedly.
This is the same habit our plain-English guide to reading scanner results walks through in more detail, and it pairs well with the routine described in how to run a weekly trading review in 20 minutes.
When Chartink Is Still the Better Tool
Don't throw out Chartink. There are specific moments where it remains the sharper tool for the job.
- Writing a brand-new custom condition nobody has screened before: if your idea is genuinely novel, Chartink's scripting language lets you test it immediately without waiting for anyone to build it into a fixed catalog.
- One-off checks outside a fixed universe: Chartink's flexibility covers a much wider slice of NSE-listed names than any curated screen list will.
- Free community scan discovery: browsing what other traders have already built is a fast, no-cost way to see new ideas.
- Quick ad hoc verification: sometimes you just want to know if a single stock meets a single condition right now, and a scan answers that in seconds.
Be honest with yourself about which job you're actually doing. Discovering a brand-new idea is a different job from deciding whether to repeat a familiar setup for the fortieth time. The first favors flexibility. The second favors evidence.
Moving From a Scan to a Systematic Screen
The practical workflow isn't "replace Chartink." It's "add a verification step." Keep using Chartink for discovery and for genuinely custom, one-off conditions. But before you repeat any setup for the third or fourth time, check whether a backtested version of that same rule exists, and look at its win rate, average return, and sample size before you treat it as part of your regular routine.
Once a screen's history looks worth tracking, set an alert so you're notified the moment a new match appears, instead of running the scan manually every morning. That's the shift our guide to setting up screener alerts on mobile covers step by step, and it's the same distinction explored in real-time vs end-of-day scanner software.
The core idea to carry forward: a scan tells you what's happening right now. A backtested screen tells you what usually happened next, the last several dozen times this exact rule showed up. One is a snapshot. The other is a track record. You need both, but only one of them tells you whether the setup is worth trading again.
FAQ
Is ChartMath registered with SEBI?
No. ChartMath is not a broker/dealer or investment adviser and is not registered with SEBI. Everything on this platform is educational use only. Nothing here is investment advice, a recommendation, or a call to buy or sell any named stock. Past performance does not indicate future results.
Does ChartMath cover F&O, MCX, or index derivatives?
No. Coverage is limited to actively traded NSE-listed equities. There is no F&O, no MCX, and no index derivative coverage.
Can I use Chartink and ChartMath together?
Yes, and many traders do. Use Chartink for fast custom scanning and community scan discovery, then check whether a repeated setup has a documented win rate before trading it regularly.
What NSE stocks does ChartMath actually screen?
ChartMath currently runs 200+ deterministic technical screens across actively traded NSE-listed equities, each with a backtested win rate and average return attached to its matched history.
Educational use only. Not a broker/dealer or investment adviser and not registered with SEBI. Past performance does not indicate future results.
If you've run enough Chartink scans to know the drill but never once seen a win rate attached to your setup, it's worth seeing what a screen with its history attached actually looks like. You can watch a quick demo to see the win rate and average return on a live screen, browse the full catalog of screen pages without installing anything (those pages run the US universe; NSE runs in the app), or go straight to the download page to start checking your own recurring setups against their actual matched history, free, no credit card required.

See these setups live in ChartMath
200+ curated screens with backtest data. Free. No credit card required.