52-Week High Breakout Screener: Catch Big Moves Early
A stock sits just below its 52-week high for three weeks. Volume is quiet. The base is tight. Then on a Tuesday morning, it clears that level on 2.5x normal volume — and over the next six weeks, it runs 40%.
The traders who caught it weren't glued to their screens. They had a screener watching for exactly that moment, and an alert fired to their phone the second it happened. The traders who missed it found out about it on Friday, when someone posted the chart in a Discord server.
If you're trying to figure out how to trade stocks with a day job, the 52-week high breakout is one of the most powerful setups in your arsenal — precisely because it doesn't require intraday babysitting. The entry is clear, the stop is logical, and the move, when it's real, tends to last. The challenge is finding these setups before they've already run. That's what this guide covers.
Why 52-Week Highs Are the Most Reliable Breakout Signal in Technical Trading
There's a reason institutional traders pay close attention when a stock clears its 52-week high. It's not superstition — it's supply and demand mechanics.
Every trader who bought this stock in the past year and is sitting at a loss becomes a potential seller the moment price recovers to their entry. That overhead supply acts like a ceiling. When price finally clears the 52-week high, it means all of that supply has been absorbed. Every seller who wanted out has already sold. What's left is a market where buyers are in control and there's no natural resistance above.
This is why 52-week high breakouts frequently mark the beginning of major multi-week or multi-month trending moves, not the end. The common mistake is assuming that a stock at a 52-week high is "too extended" to buy. In reality, a stock making new highs on strong volume is often just getting started.
Academic research backs this up. The momentum anomaly, the tendency for stocks that have performed well over the past 6 to 12 months to continue outperforming, is one of the most replicated findings in financial research, documented extensively by researchers at the National Bureau of Economic Research. Stocks breaking to 52-week highs sit squarely in this momentum category.
The problem isn't the setup. The problem is that most traders only discover these breakouts after the fact. They're scanning end-of-day, or they're relying on social media, or they're manually refreshing a screener that updates once a day. By the time they see it, the stock has already moved 8% off the breakout level and the entry is gone.
The solution is a real-time screener with push alerts, one that watches the entire market for you and fires the moment a stock clears this level with volume confirmation. We'll get to exactly how to set that up. But first, let's talk about how to separate the real breakouts from the traps.
Genuine Strength vs. Exhaustion: How to Tell the Difference
Not every 52-week high breakout deserves a trade. Some are the beginning of a major move. Others are a stock that's been grinding higher for months, finally ticking to a new high on thin volume before reversing hard. Knowing the difference is what separates a high-probability setup from a costly mistake.
The Base Is Everything
The best 52-week high breakouts come after a period of tight consolidation near the highs, what traders call a "base." The stock has been coiling for two, three, or four weeks in a narrow range just below the 52-week high. Sellers have been absorbed. Buyers are accumulating. When the breakout finally comes, it has energy behind it.
Compare that to a stock that's been in a straight-line parabolic move for six weeks and is now ticking to a new high on the seventh. That's not a base breakout, that's exhaustion. The risk/reward is poor and the stop placement is difficult.
Volume Is the Confirmation Signal
A legitimate 52-week high breakout should come with above-average volume. Specifically, you want to see Relative Volume (RVOL) of at least 1.5x on the breakout day, meaning the stock is trading at least 50% more volume than its average for that time of day. This tells you that institutional money is participating, not just retail traders chasing a headline.
A breakout on below-average volume is a yellow flag. It might still work, but the odds are lower and the risk of a failed breakout is higher. Volume is the market's way of voting on whether a move is real.
For a deeper look at how to use volume as a confirmation tool, the guide on volume analysis and RVOL for day traders covers the mechanics in detail.
Sector and Market Context
A 52-week high breakout in a strong sector, during a healthy broad market, has a much higher probability of following through than the same setup in a weak sector during a choppy tape. Always check whether the sector ETF is in an uptrend and whether the S&P 500 is above its key moving averages before entering a breakout trade.
1. Define Your 52-Week High Breakout Criteria
Before you set up any screener, you need to know exactly what you're looking for. Vague criteria produce vague results. Here's a concrete set of parameters that filters for high-quality setups and cuts out the noise.
Price Condition
- Price at or above 52-week high: The stock must be trading at or above its highest price in the past 52 weeks. This is the core condition.
- Minimum price filter: Set a floor of $10 or higher to avoid penny stocks and illiquid micro-caps where breakouts are unreliable.
- Market cap filter: Focus on stocks with a market cap above $500 million for better liquidity and more reliable technical behavior.
Volume Condition
- RVOL ≥ 1.5x: The stock must be trading at least 50% above its average volume for the current time of day. This is non-negotiable for confirming institutional participation.
- Average daily volume ≥ 500,000 shares: Ensures you can enter and exit without significant slippage.
Structure Condition
- Prior consolidation: Ideally, the stock has been trading within 5% of its 52-week high for at least two weeks before the breakout. This confirms a base rather than a parabolic extension.
- Timeframe: Use the daily chart for swing trades held for days to weeks. Use the 1-hour chart for shorter holds of one to three days.
These parameters won't catch every 52-week high breakout, they're not supposed to. They're designed to surface the subset of breakouts that have the highest probability of following through. Quality over quantity is the entire point.
For context on how these filters fit into a broader daily chart workflow, the daily chart swing trade scanner workflow is worth reading alongside this guide.
2. Set Up Your Screener to Find These Setups Automatically
Here's where most traders hit a wall. They know what they're looking for. They just can't find it fast enough.
End-of-day screeners like Finviz are useful for reviewing what happened after the market closes. But for 52-week high breakouts, end-of-day data is almost useless for catching the actual entry. By the time you see the breakout in your evening scan, the stock has already moved. The entry was at 10:15 AM when it cleared the level on volume, not at 4:30 PM when you're reviewing your screener results.
This is the core problem with static, end-of-day tools for breakout trading. The setup and the entry happen in real time. Your screener needs to be watching in real time too.
How ChartMath Handles This
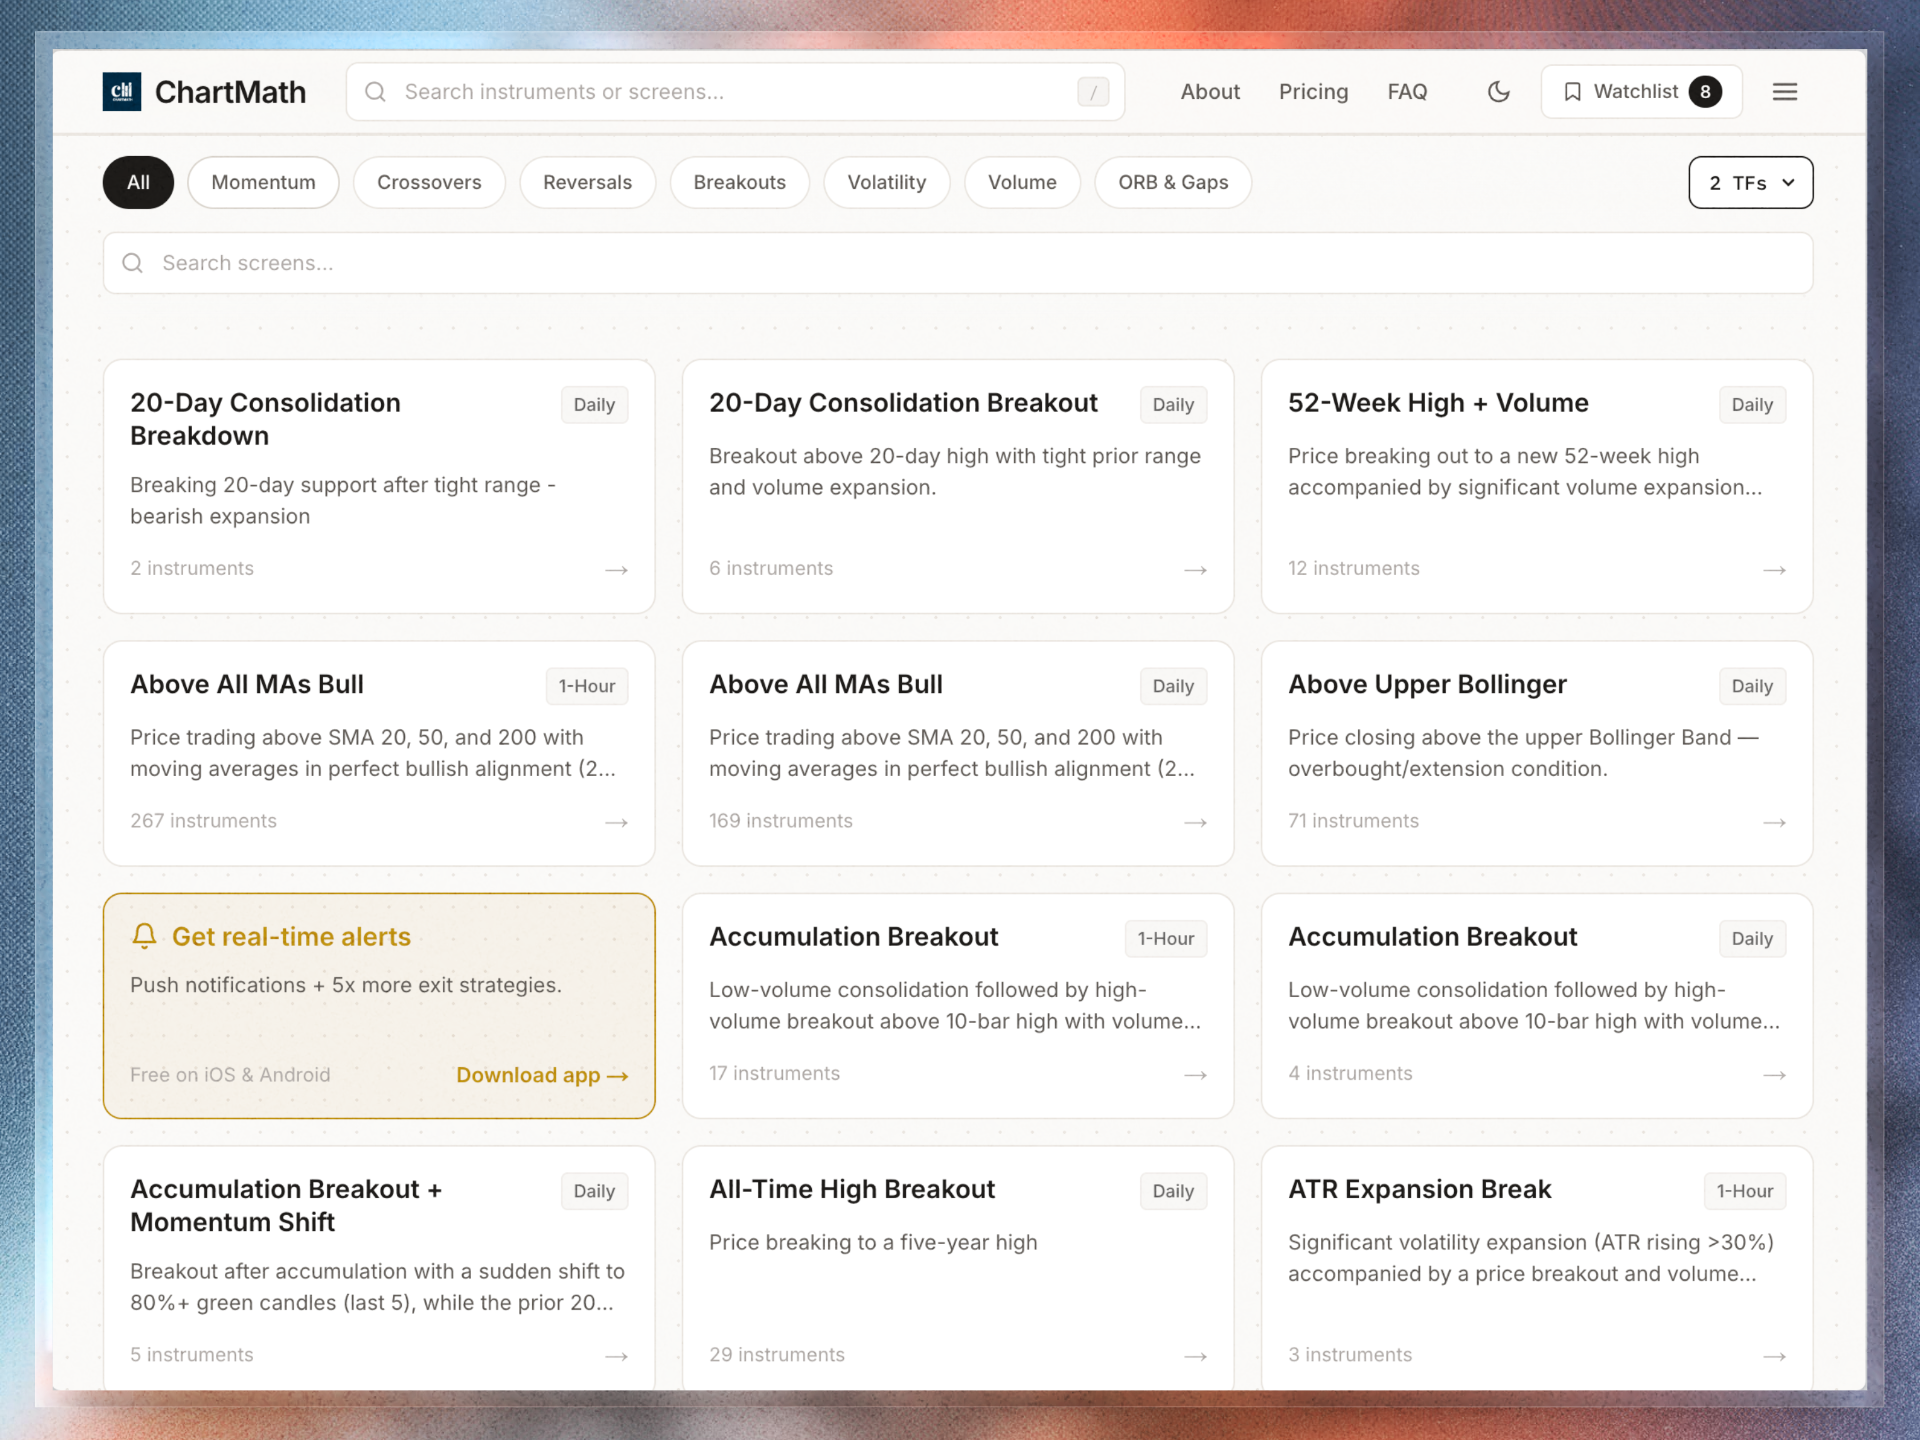
ChartMath runs continuous real-time scans across 200+ pre-built technical screens, including dedicated 52-week high breakout filters with volume confirmation built in. You don't need to write a single line of Pine Script. You don't need to configure complex filter logic. The screens are already built, already backtested, and already running.
Here's how to get the 52-week high breakout screen working for you:
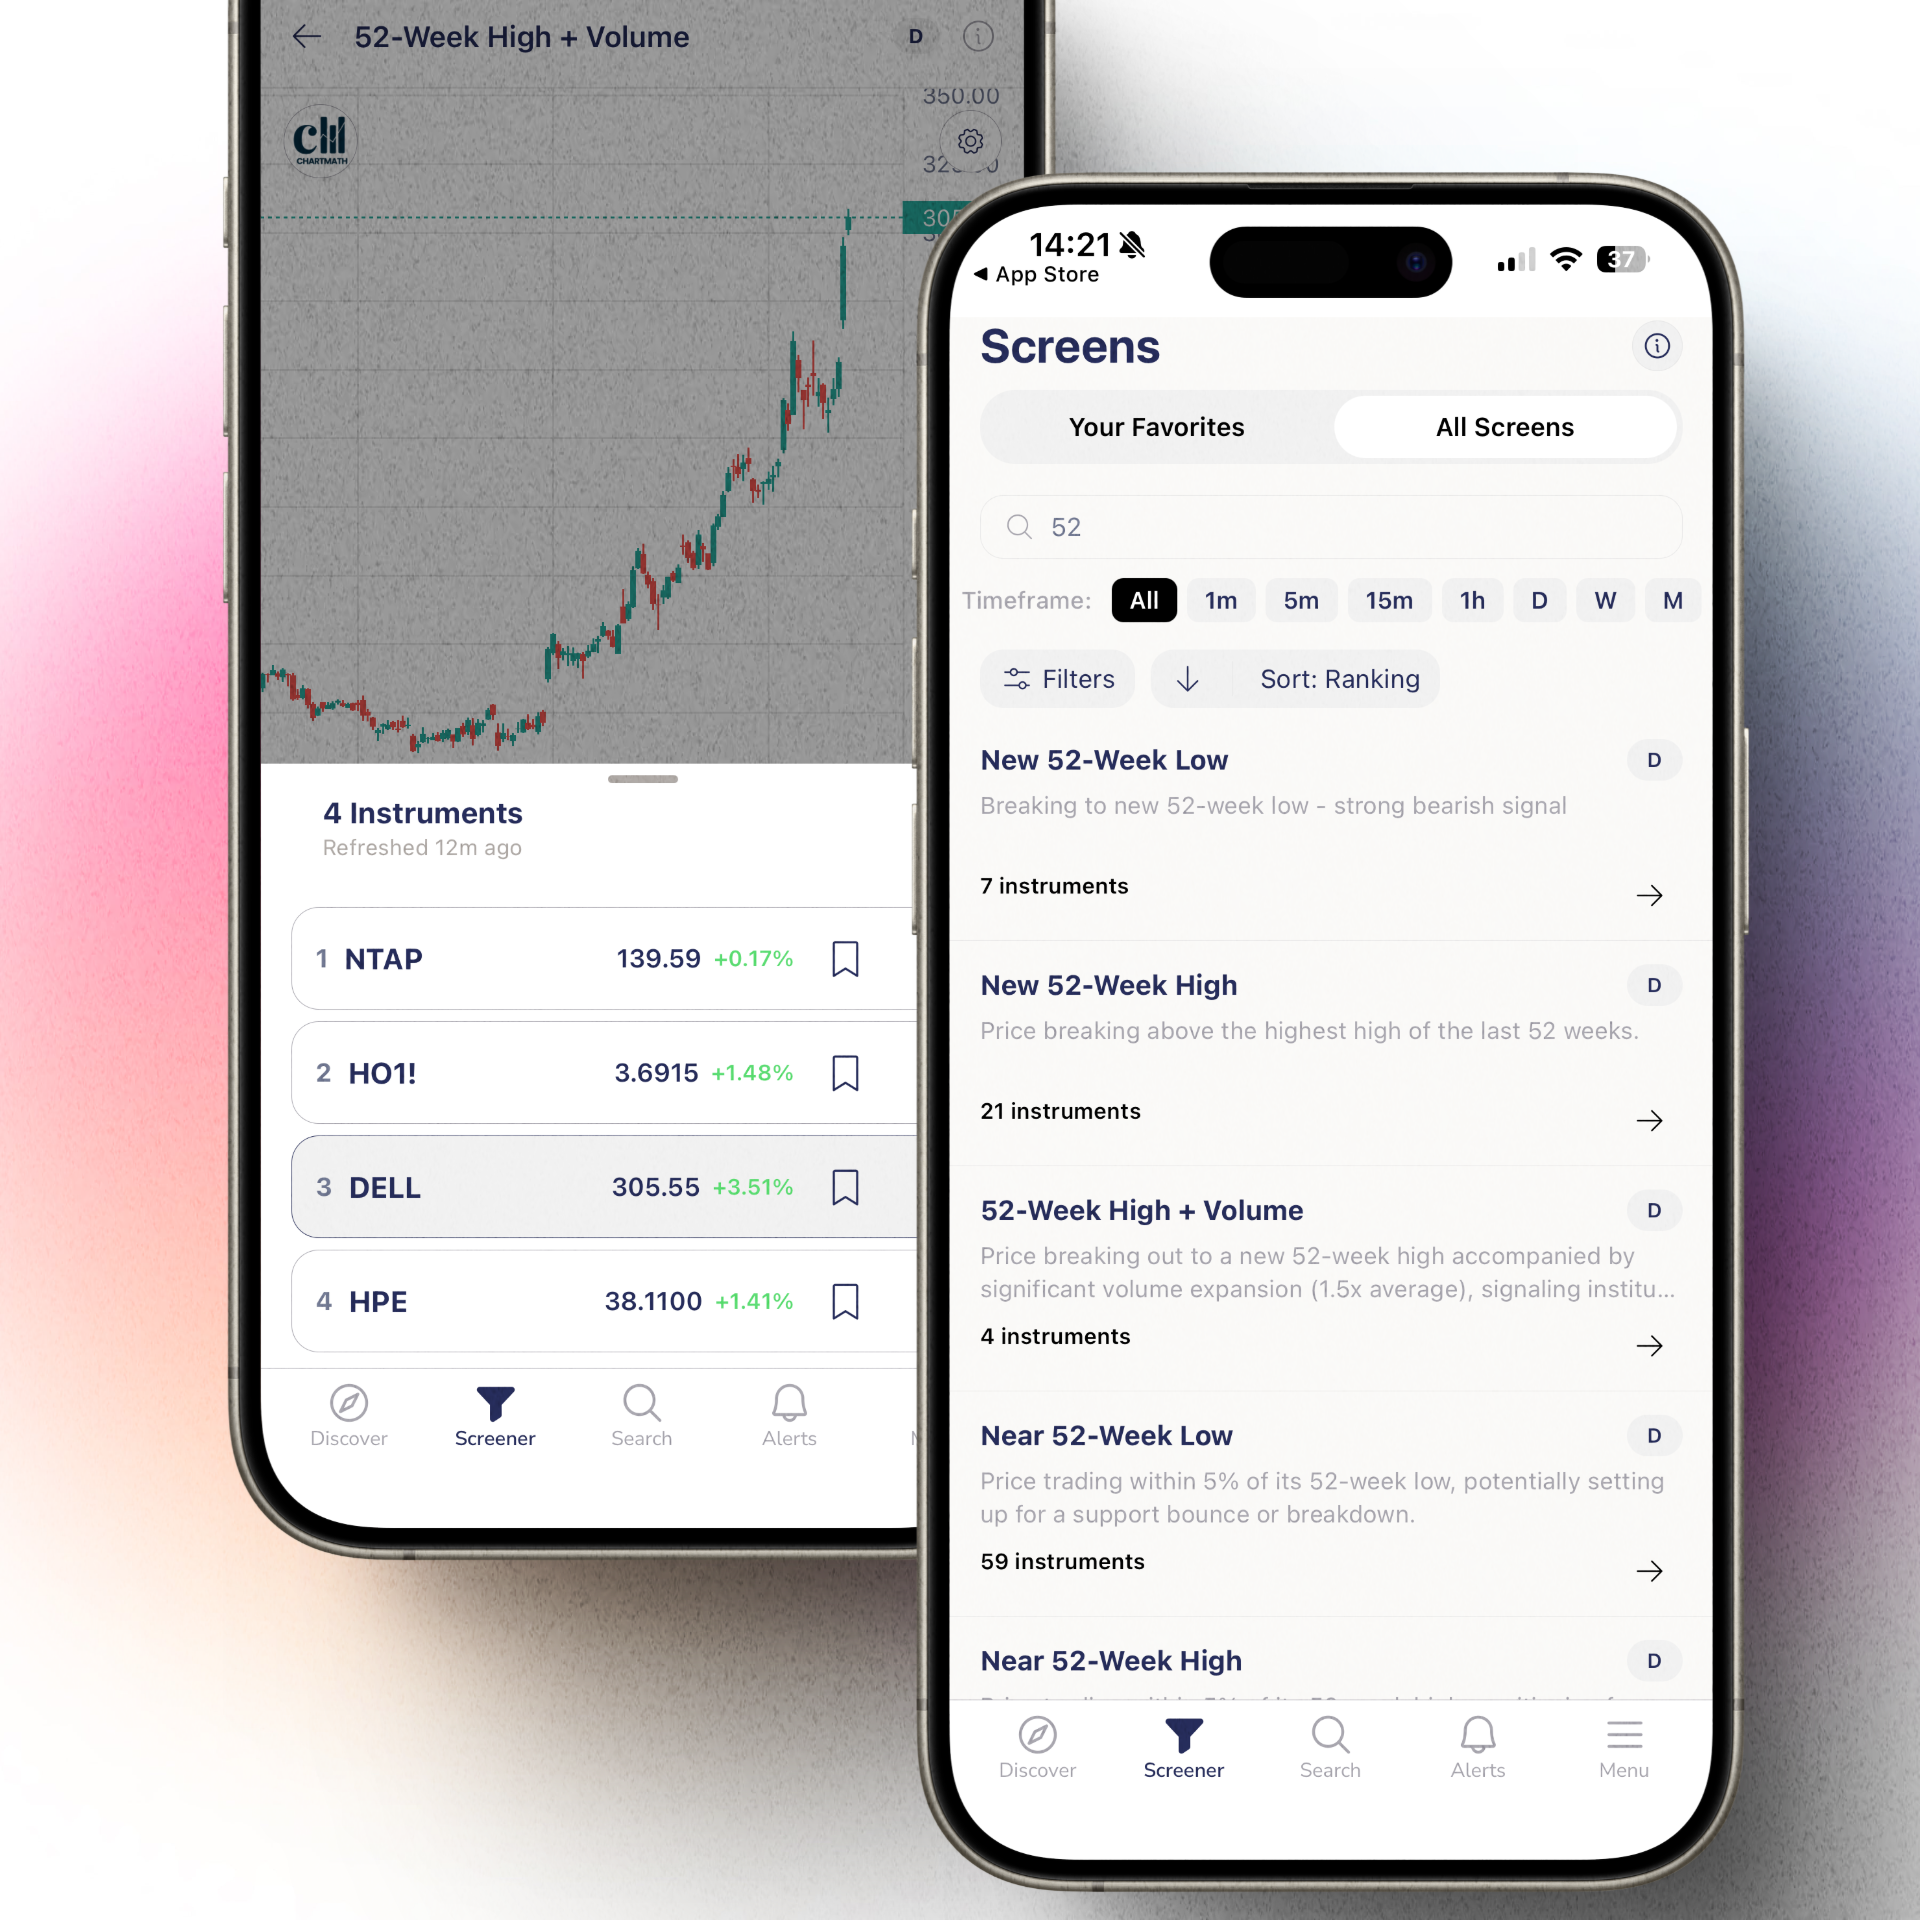
- Open the ChartMath app on your phone or access the web-based screener.
- Browse the pre-built screens and locate the 52-week high breakout screen. It's already configured with price, volume, and RVOL conditions.
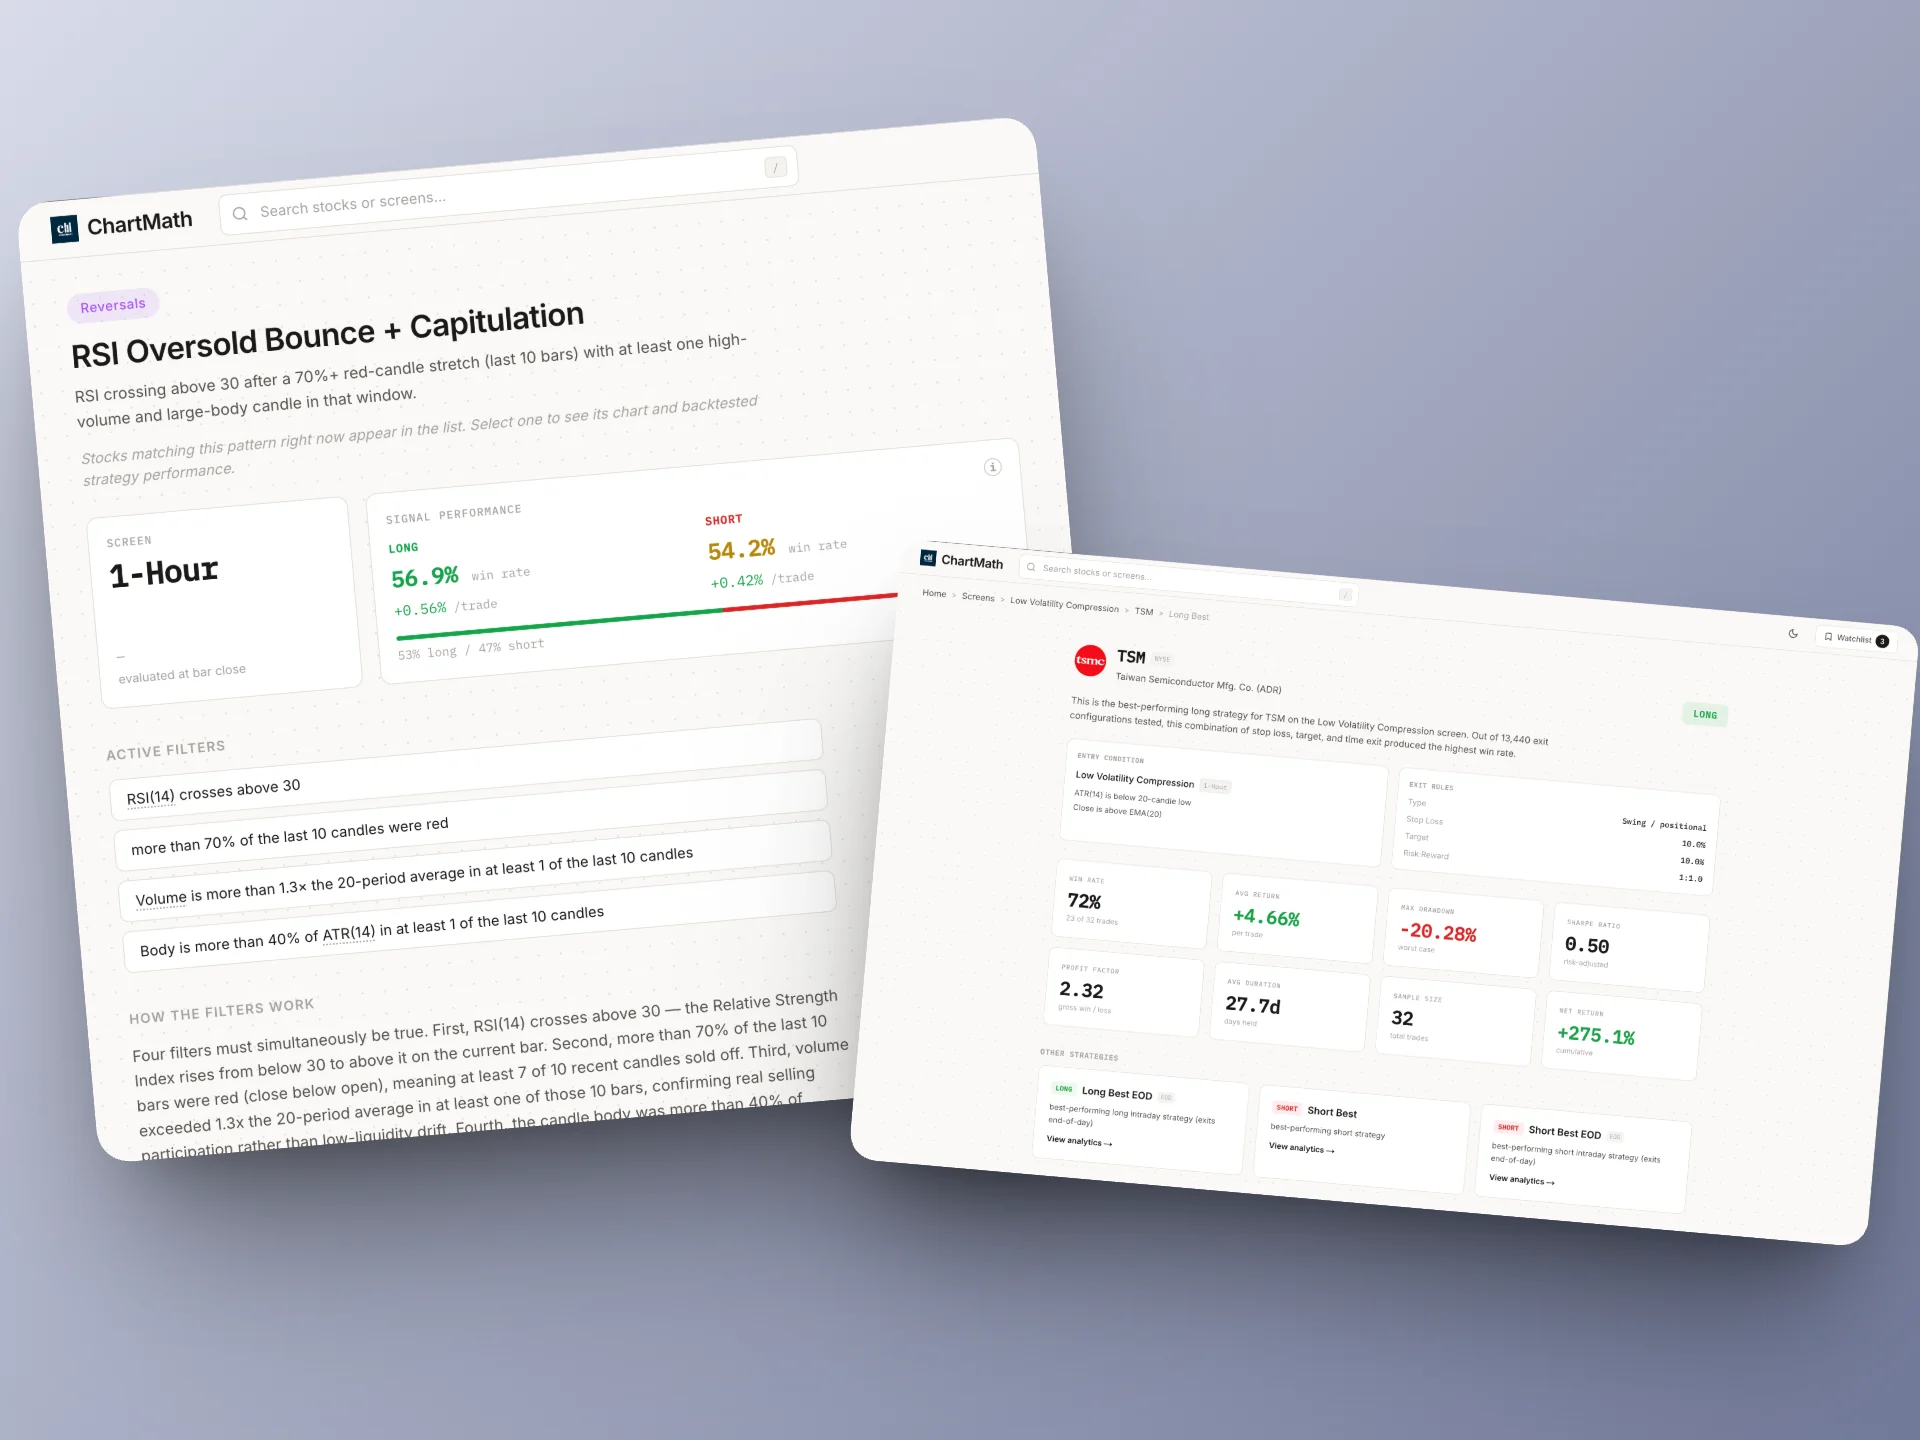
- Review the backtest data for the screen, win rate, average return, and drawdown stats are displayed for every setup so you know the historical edge before you trade it.
- Add the screen to your active alerts. ChartMath will now monitor the entire market against this screen in real time and push a notification to your phone the moment a qualifying stock triggers.
- Customize your watchlist if you want alerts only for stocks you're already tracking, or leave it broad to discover new names across the full market.
The key difference from other tools is that ChartMath is built as a discovery layer, it finds setups you weren't already watching and brings them to you, rather than only analyzing stocks you've already pulled up. That's the distinction that matters when you're at work and can't be actively scanning.
If you're currently using TradingView or TrendSpider for charting, ChartMath works alongside those platforms. It handles the scanning and alerting; you use your existing charting tool for the final analysis and execution. No need to replace anything you already use.
For traders who've been frustrated by the limitations of Finviz for intraday setups, the comparison in the best Finviz alternative for intraday traders guide lays out exactly where the gaps are.
3. Configure Real-Time Alerts That Fire at the Right Moment
Getting the screener set up is step one. Getting the alerts configured correctly is what actually makes the system work for a trader with a day job.
Real-Time vs. End-of-Day Alerts
For 52-week high breakouts, real-time alerts are the only alerts that matter. The entry window on a breakout is often 30 to 60 minutes wide. If you're getting an end-of-day summary email, you're getting a history lesson, not a trade opportunity.
ChartMath sends push notifications to your phone the moment a stock clears its 52-week high with the required volume confirmation. You get the alert while the setup is still actionable, not after the close when it's too late.
What a Good Alert Tells You
Most alert systems tell you that something happened. ChartMath tells you why it happened. Each alert includes a plain-English explanation of what triggered, the specific conditions that were met, the RVOL reading, the price level cleared, and the backtest context for that screen. You're not left guessing whether the alert is worth acting on.
This is the difference between an alert that says "AAPL triggered" and one that says "AAPL cleared its 52-week high of $198.40 on 2.1x relative volume, this screen has a 64% win rate over the past 18 months with an average gain of 8.3% over the following 15 trading days."
The second alert lets you make a decision. The first one just adds to your anxiety.
Alert Timing Strategy for Day-Job Traders
If you can check your phone briefly during the trading day, at lunch, between meetings, configure your alerts to fire in real time during market hours. Review them when you get a moment and decide whether to act.
If your schedule is completely locked during market hours, set up end-of-day alerts for 52-week high breakouts that occurred during the session. You won't catch the intraday entry, but you can evaluate whether the stock is still in a buyable position for the next morning's open or a limit order near the breakout level.
The guide on integrating trading alerts with your charting platform covers the mechanics of connecting alert systems to your existing workflow in more detail.
4. Evaluate Each Alert Before Entering the Trade
An alert is a prompt to look, not a command to buy. The screener does the scanning. You make the final call. Here's a fast evaluation process you can run in under two minutes on your phone.
The 60-Second Mobile Review
- Pull up the daily chart. Is there a clear base before the breakout, or has the stock been in a straight-line move for weeks? Base breakout = good. Parabolic extension = pass.
- Check the volume bar. Is today's volume significantly above average? If RVOL is below 1.2x, the conviction isn't there. Wait for more volume or skip the trade.
- Look at the sector. Is the sector ETF trending up? A breakout in a strong sector has much better odds than one in a sector that's been lagging.
- Review the backtest stats. ChartMath displays historical win rate and average return for every screen. If the setup has a strong track record in similar market conditions, that's a green light to proceed.
- Identify your stop level. Where would you be wrong? Typically, a close below the breakout level or below the base is your stop. If the stop is too wide relative to your position size, pass on the trade.
This process takes less time than reading a text message. The goal is to quickly confirm that the alert represents a genuine opportunity before you commit capital.
When to Pass
Even a technically valid 52-week high breakout deserves a pass in certain conditions:
- The broad market is in a confirmed downtrend or showing distribution
- The stock is reporting earnings within the next five trading days (earnings risk distorts the setup)
- The breakout happened on a news catalyst that's unlikely to sustain (one-day spike, not a trend change)
- The stock has already moved more than 5% from the breakout level before you see the alert
Discipline in filtering alerts is what keeps your win rate high. The screener casts a wide net; your judgment narrows it to the trades worth taking.
5. Manage the Position Without Watching the Screen All Day

One of the biggest advantages of the 52-week high breakout for traders with day jobs is that it's a position trade, not a scalp. You're not trying to capture a 30-cent move in 10 minutes. You're positioning for a multi-week trend. That means you don't need to watch the screen all day, you need to set your parameters and let the trade develop.
Setting Your Stop Loss
Place your initial stop loss just below the breakout level, typically 1% to 3% below the 52-week high that was cleared. If the stock closes back below that level, the breakout has failed and you exit. This is a clean, objective stop that doesn't require any intraday monitoring.
For stocks with a well-defined base, you can also use the bottom of the base as your stop. This gives the trade more room to breathe but requires a smaller position size to keep risk consistent.
Using Trailing Stops for Multi-Week Moves
Once a 52-week high breakout is working in your favor, the goal is to let it run. Use a trailing stop based on the 10-day or 20-day moving average, if the stock closes below that level, you exit. This keeps you in the trade through normal pullbacks while protecting your gains if the trend reverses.
Set an alert in ChartMath to notify you if the stock drops to your trailing stop level. You'll get a push notification and can review the situation before deciding whether to exit. No need to watch the chart all day.
The Postmarket Review Workflow
For most day-job traders, the primary review window is after the market closes. Spend 20 to 30 minutes each evening reviewing your open positions on the daily chart. Are they still above the breakout level? Is volume confirming the trend? Are there any warning signs like a high-volume reversal candle?
This postmarket routine is where you make your adjustments, tightening stops, sizing up on strength, or deciding to exit ahead of a catalyst. The 30-minute daily guide for swing traders covers this routine in detail if you want a structured framework.
The combination of real-time alerts during the day and a focused postmarket review in the evening gives you full coverage of your positions without requiring you to watch a screen for eight hours.
Frequently Asked Questions
What is a 52-week high breakout screener?
A 52-week high breakout screener is a tool that continuously monitors the stock market and identifies stocks that are trading at or above their highest price in the past 52 weeks. The best screeners add volume filters, like RVOL, to confirm that the breakout has genuine buying pressure behind it, not just a random tick to a new high on thin volume.
Is a 52-week high breakout a reliable trading signal?
When combined with volume confirmation and a prior consolidation base, yes, it's one of the more reliable breakout signals in technical trading. The setup benefits from clear supply/demand mechanics: all overhead sellers have been absorbed, and the stock is entering price discovery territory with no natural resistance above. That said, no setup works 100% of the time, which is why reviewing backtest data for the specific screen you're using is important before trading it.
Do I need to watch the market all day to trade 52-week high breakouts?
No, and this is one of the setup's key advantages for traders with day jobs. The entry is clear (breakout above the 52-week high with volume), the stop is logical (below the breakout level or base), and the trade is designed to hold for days to weeks. With real-time push alerts from a tool like ChartMath, you get notified the moment a qualifying setup triggers and can evaluate it in under two minutes on your phone. The guide on catching breakout opportunities in real time covers this workflow in more depth.
How is ChartMath different from Finviz or TradingView for this setup?
Finviz updates end-of-day and has no real-time alerts or mobile app, by the time you see a 52-week high breakout in Finviz, the entry is gone. TradingView requires you to write Pine Script to build custom alerts, and it only analyzes stocks you've already pulled up, it won't proactively discover new setups for you. ChartMath runs real-time scans across the entire market, pushes alerts to your phone the moment a setup triggers, includes backtest data for every screen, and requires zero coding. It's built specifically for the trader who can't watch charts all day.
Can I use this strategy as a swing trader with a full-time job?
Absolutely, it's one of the best setups for exactly that situation. The 52-week high breakout is a position trade, not a scalp. You're holding for days to weeks, not minutes. The entry is clear, the stop is objective, and the management is straightforward. With the right alert system, you can catch the entry during a brief phone check at lunch, set your stop, and manage the position with a 20-minute postmarket review each evening. That's a realistic trading workflow for someone with a full-time job.
The bottom line: The 52-week high breakout is one of the cleanest setups in technical trading, but only if you catch it at the right time. A real-time screener with push alerts is the difference between being in the trade from the breakout and reading about it on Friday.
Start Catching 52-Week High Breakouts Before They Run
You now have a complete framework: the criteria that define a high-quality 52-week high breakout, the filters that separate genuine strength from exhaustion, and a step-by-step process for setting up real-time alerts that fire while you're at work. The setup is sound. The workflow is realistic for a trader with a day job. What's left is execution.
ChartMath does the scanning for you, continuously, across the entire market, in real time, and pushes an explainable alert to your phone the moment a qualifying 52-week high breakout triggers. No Pine Script. No end-of-day lag. No alert spam. Just the setups that meet your criteria, with the backtest data to back them up, delivered to your phone when they're still actionable.
See how the 52-week high breakout screen works in practice: watch the ChartMath demo to see a live walkthrough of the screener and alert system. Or if you're ready to start catching these setups today, download the ChartMath app and have your first real-time breakout alert running before the next trading session opens.
The next 52-week high breakout is happening right now. The question is whether your screener is watching for it.

See these setups live in ChartMath
200+ curated screens with backtest data. Free. No credit card required.