How to Build a Systematic Trading Workflow in 2026
Most traders already know what a systematic workflow is supposed to look like. They've read the books. They've watched the YouTube videos. They understand, in theory, that rules beat gut feel. The problem is not knowledge. The problem is that building the actual infrastructure — the screens, the alerts, the review loop — feels like a second job. So they keep trading the way they always have: open a chart, feel something, take a position, hope for the best.
This guide is for the trader who is done with that loop. Not because they lack discipline, but because they finally want a workflow that runs on evidence instead of instinct, one that fits around a full-time job and does not require writing a single line of code.
Here is how to build a systematic trading workflow from scratch, step by step.
Why Most Retail Traders Never Get Systematic
The gut-driven trading loop looks like this: you open a screener, scroll through results, find a chart that "looks good," take a position, and then spend the next three days second-guessing yourself. When the trade works, you feel like a genius. When it does not, you tell yourself you need more practice. Neither outcome teaches you anything repeatable.
The real problem is not discipline. It is infrastructure. Systematic trading requires three things most retail setups are missing: a defined setup universe, a way to measure historical edge before risking capital, and an alert system that fires when the rule is met, not when you happen to be watching.
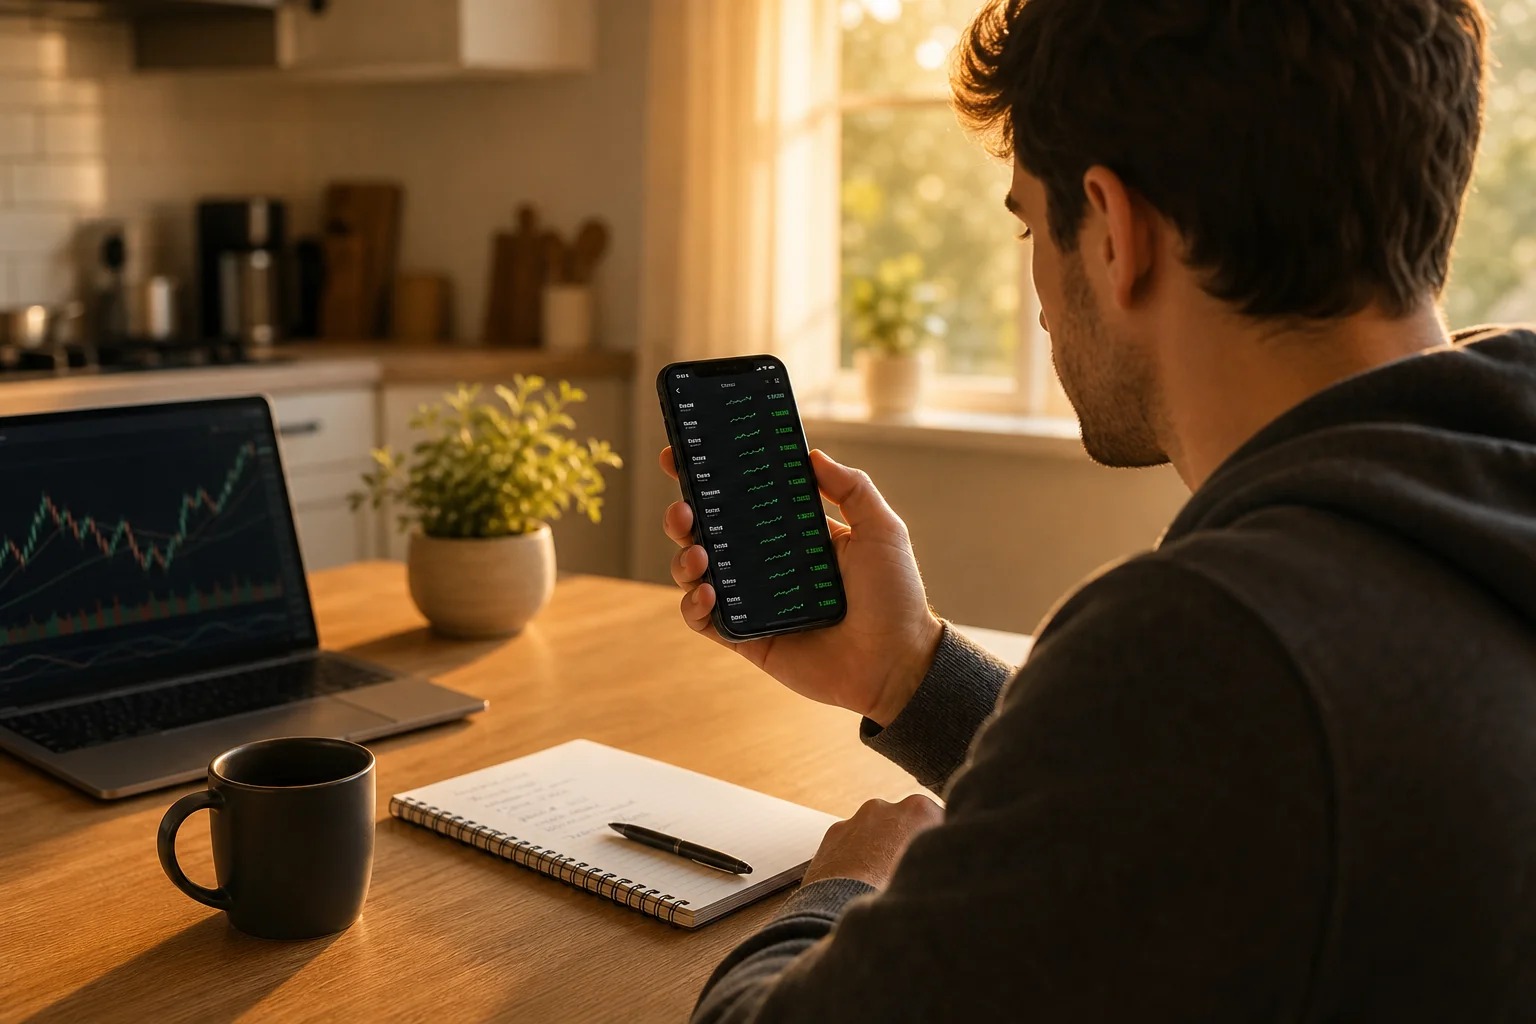
For a trader with a day job, the infrastructure gap is even wider. You cannot monitor charts from 9:30 AM to 4:00 PM. You need a workflow that does the watching for you and surfaces only the setups worth acting on.
A systematic workflow has four components:
- A curated setup universe (not "the whole market")
- Backtested screens that show historical edge before you risk a dollar
- A watchlist connected to continuous monitoring
- Push alerts that fire on the rule, plus a weekly review to close the loop
Each step below builds one of those components.
1. Define Your Setup Universe Before You Open a Single Chart
The first mistake traders make when going systematic is trying to scan everything. "The whole market" sounds thorough. It is actually paralyzing. When your screener returns 400 results, you are back to gut feel, just with more tickers to scroll through.
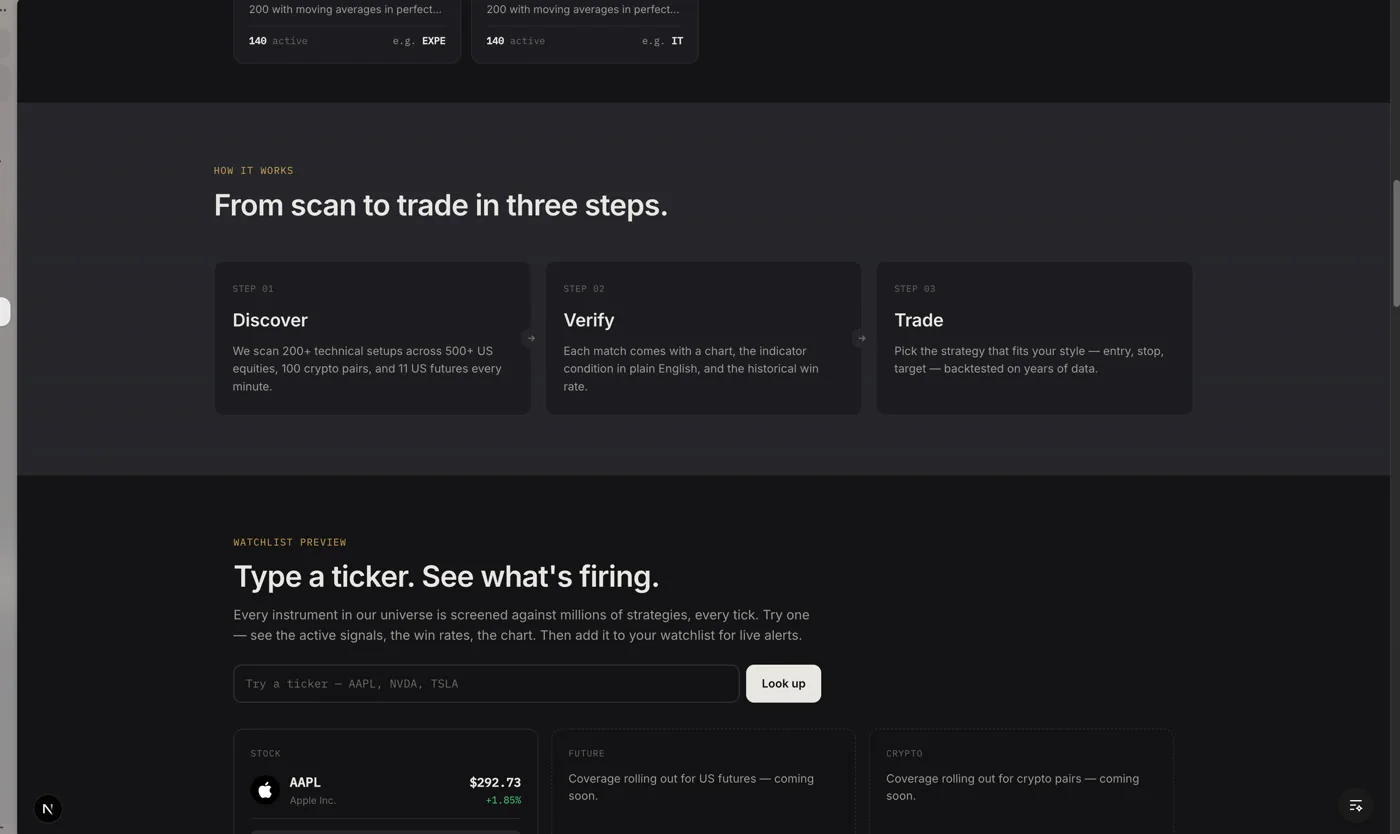
A curated universe forces you to make decisions upfront, when you are calm, rather than in the moment when a chart is moving. ChartMath's universe is a good model for this: 500+ US equities, 100 crypto pairs, and 11 US futures, across 7 timeframes from 1-minute to monthly. That is not the entire market. It is a deliberate selection of liquid, tradeable instruments where technical setups have enough historical data to be meaningful.
For a swing trader with a day job, the right starting point is the Daily and Weekly timeframes. These are the timeframes where setups develop over hours and days, not seconds. You do not need to be at your desk when the entry fires. You need to know the setup is forming and have an alert ready for when it triggers.
Choosing Your Screen Categories
Once you have a universe, you need to decide which types of setups you want to trade. Broad categories include:
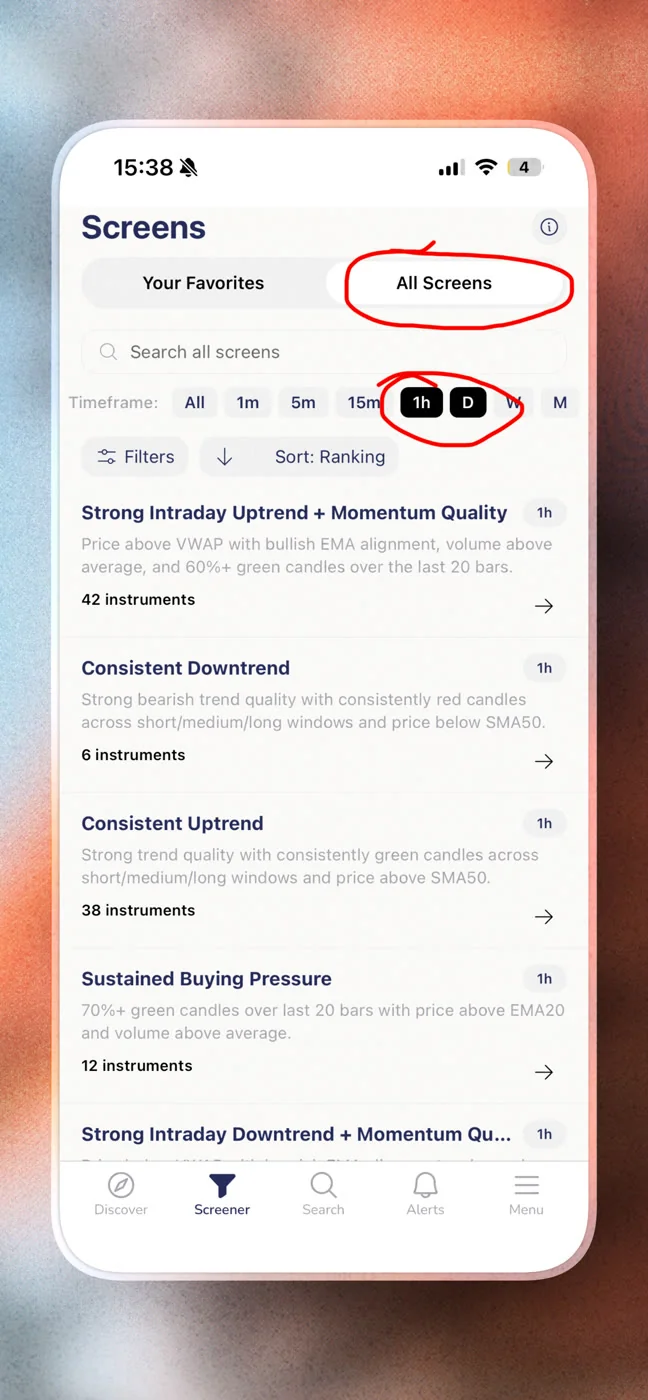
- Momentum and breakout: stocks clearing key levels on elevated volume (Opening Range Breakout, 52-week high breakout, VWAP reclaim)
- Mean reversion: oversold bounces, RSI extremes, compression setups before expansion
- Trend continuation: pullbacks to moving averages, consistent uptrend screens, accumulation patterns
You do not need to trade all three. Pick one or two categories that match your risk tolerance and schedule. A trader who can check their phone at lunch is well-suited to intraday momentum setups on the 1h timeframe. A trader who reviews positions once a day is better served by Daily and Weekly trend setups.
The key is that this decision happens before you open a chart, not after you see a ticker moving on Twitter.
2. Replace Gut Feel With Backtested Screens
Here is the question most screeners cannot answer: how many times has this setup historically worked?
Static screeners like Finviz give you a list of tickers that match a filter. They do not tell you whether that filter has historically produced profitable trades. You are left to decide based on how the chart looks, which is gut feel dressed up as analysis.
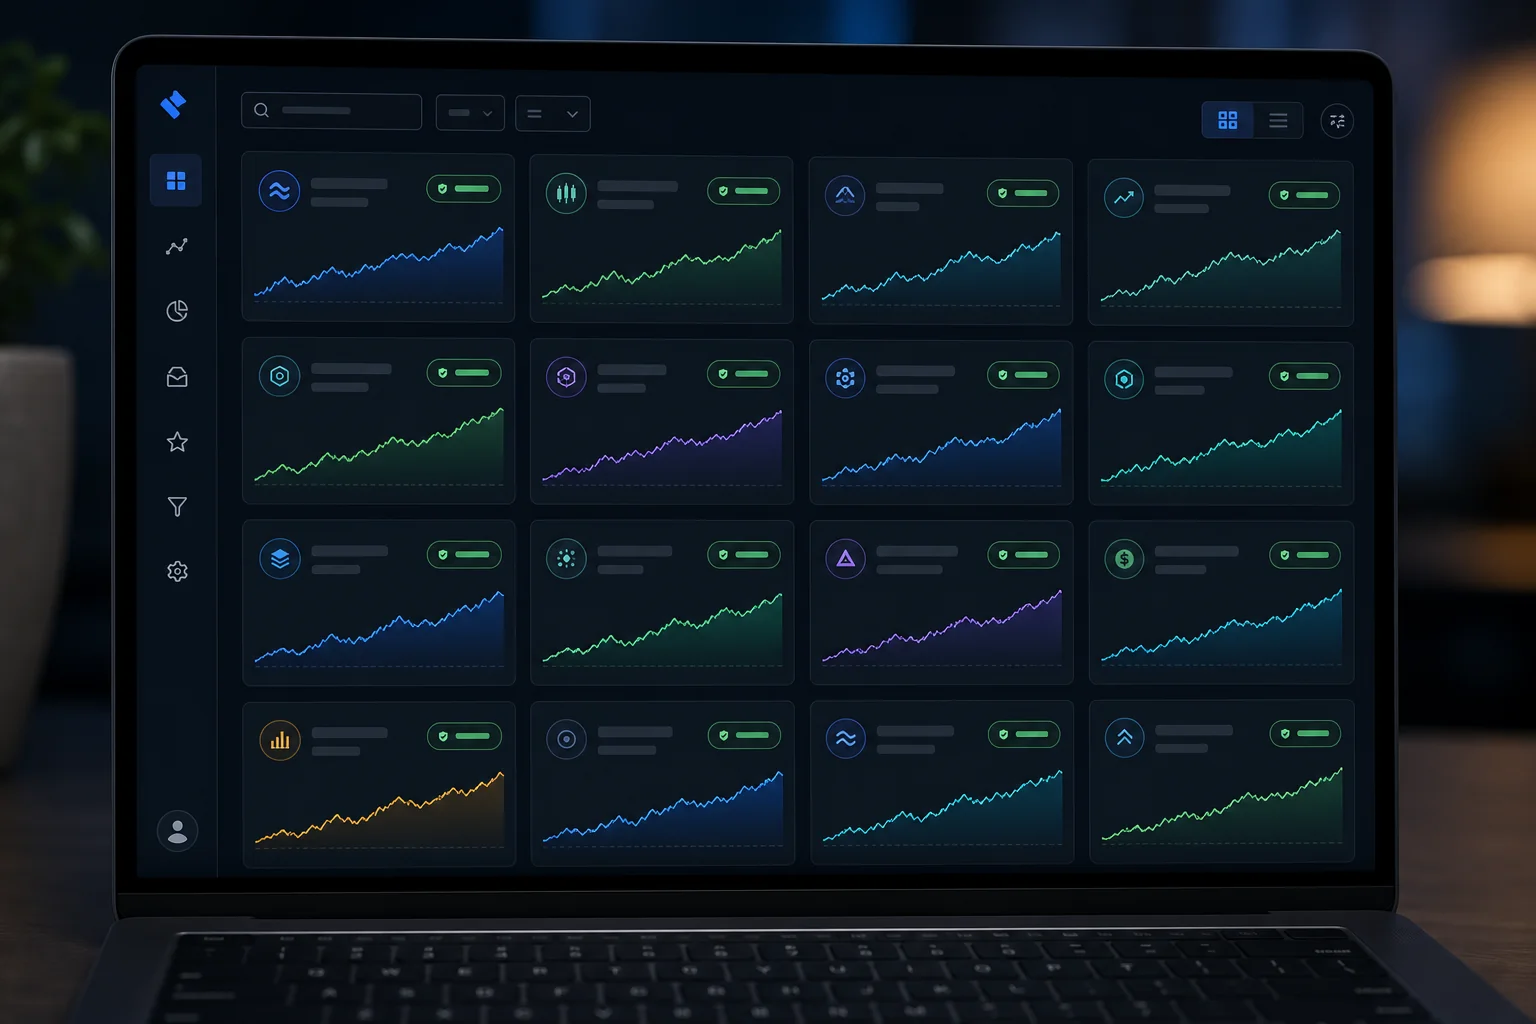
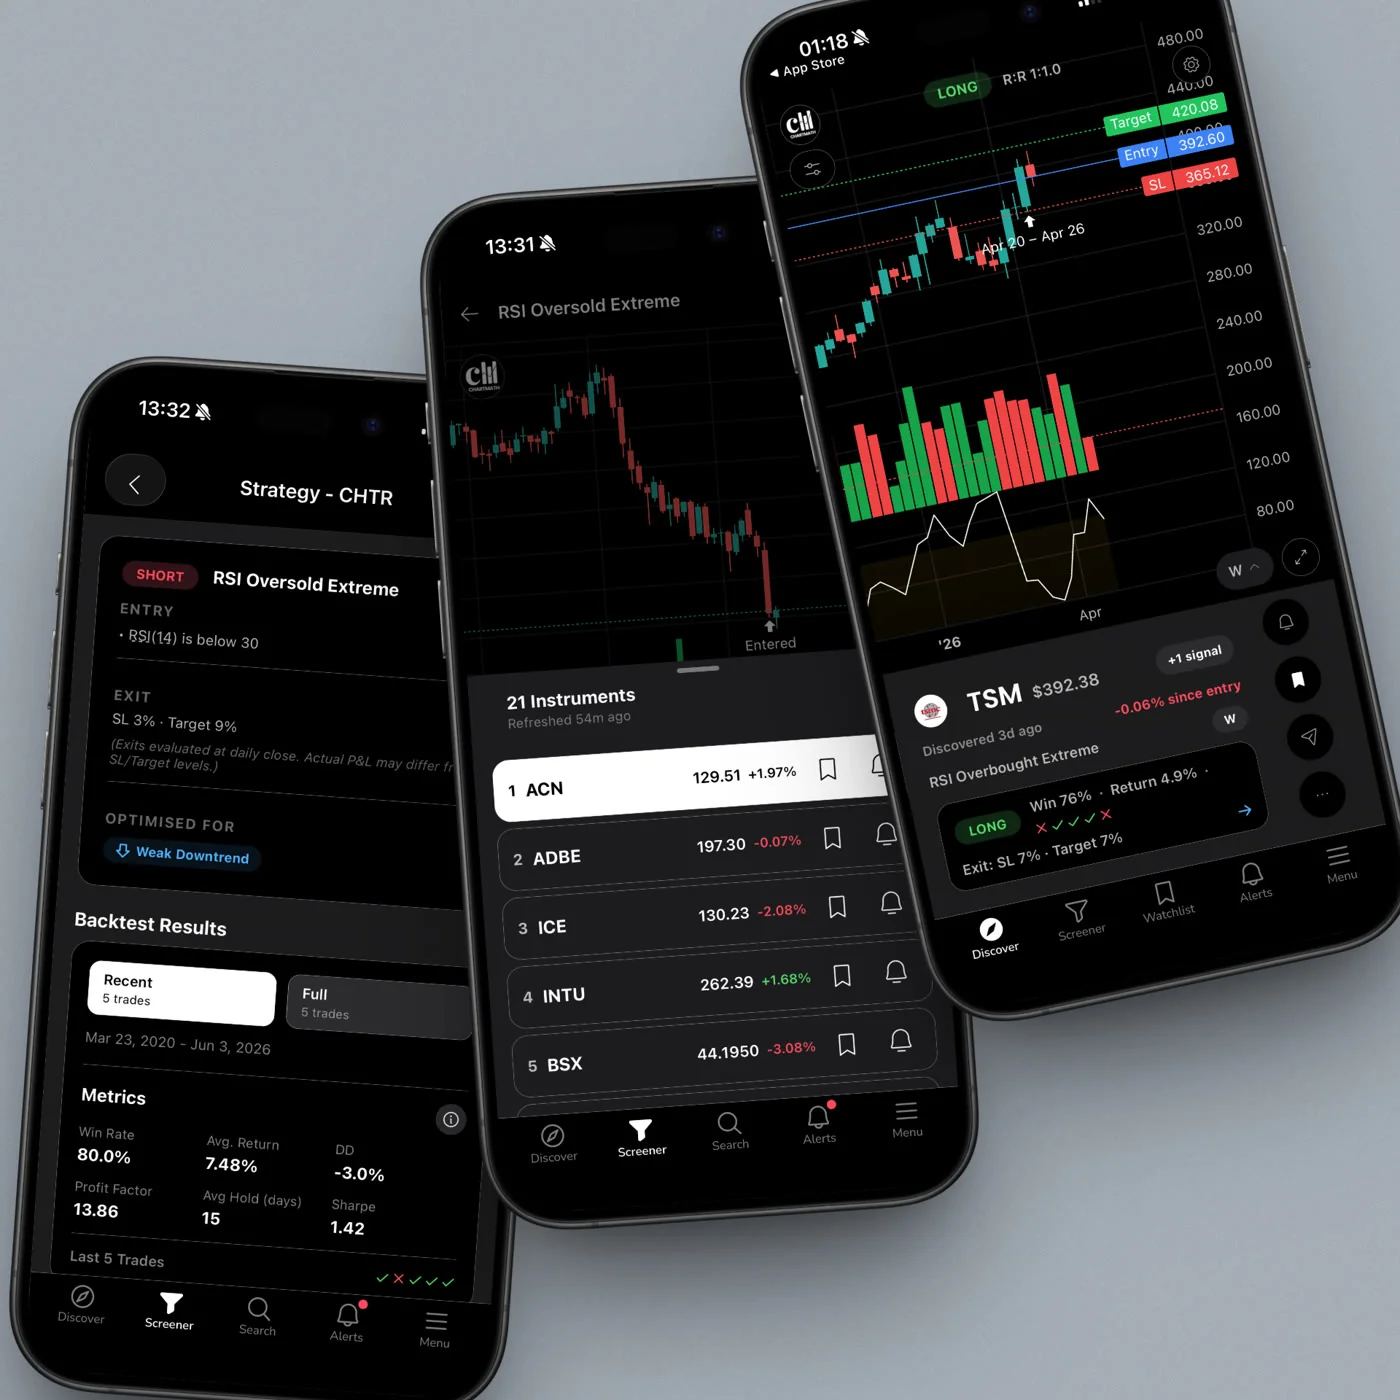
A backtested screen is different. It has a documented track record: Win Rate, Average Return, expected value (EV), and sample size. Before you risk a dollar on a setup, you can see how that exact pattern has performed historically across the instruments in the universe.
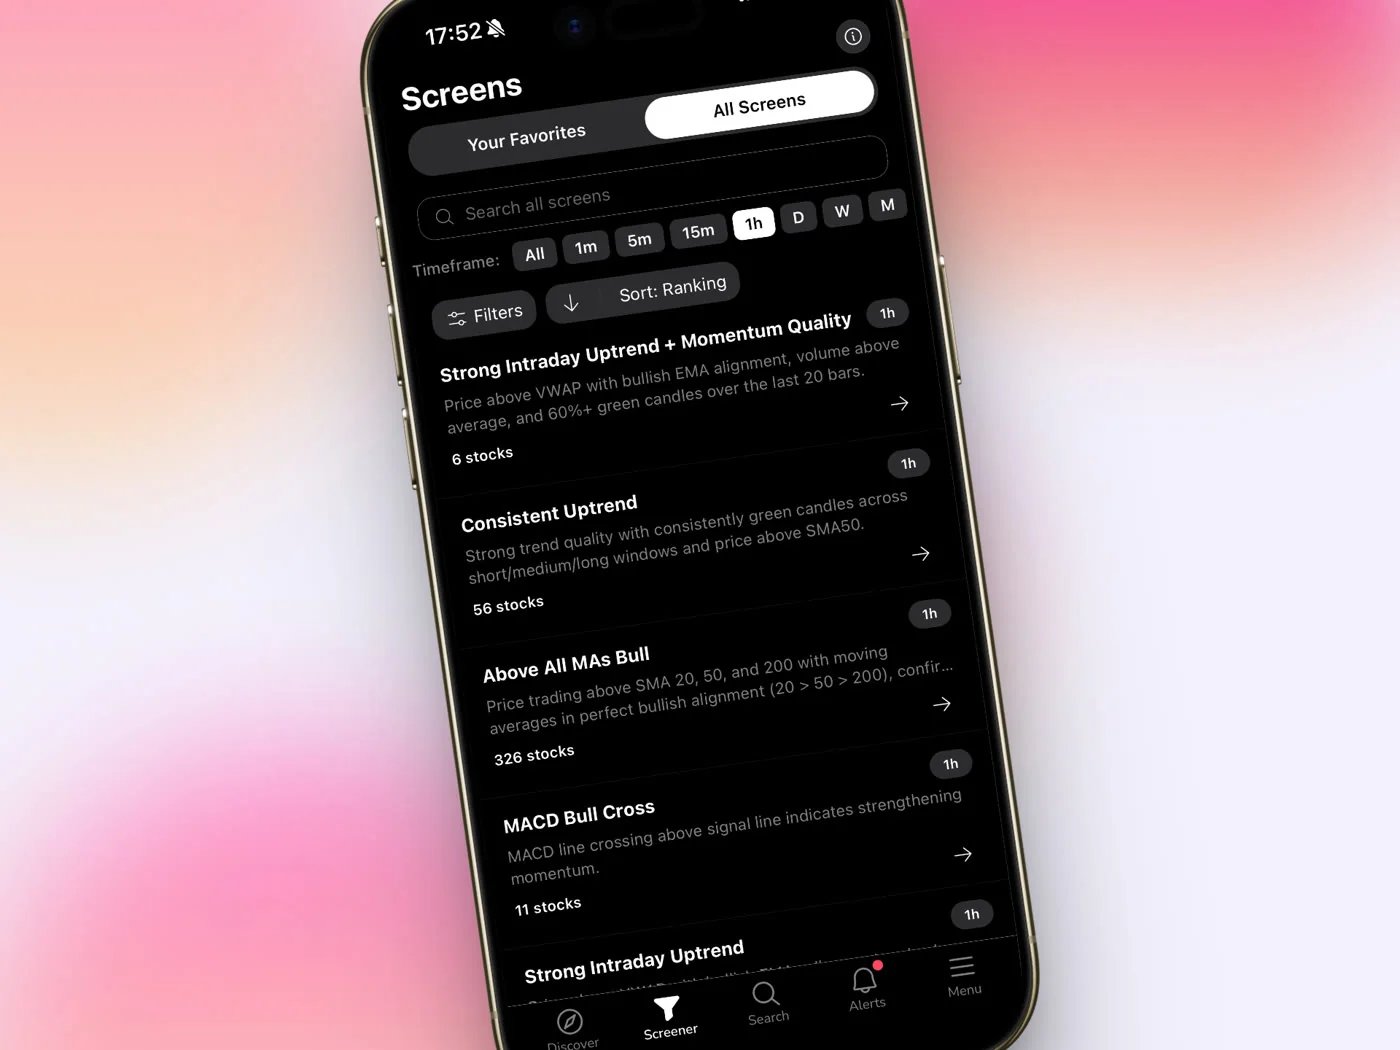
ChartMath ships with 200+ curated, read-only screens, each one backtested before it reaches the app. You do not build them. You do not write Pine Script. You browse a library of verified setups and pick the ones whose track record matches your strategy. That is the no-code advantage: the backtest infrastructure already exists. You are choosing from a menu, not building a kitchen.
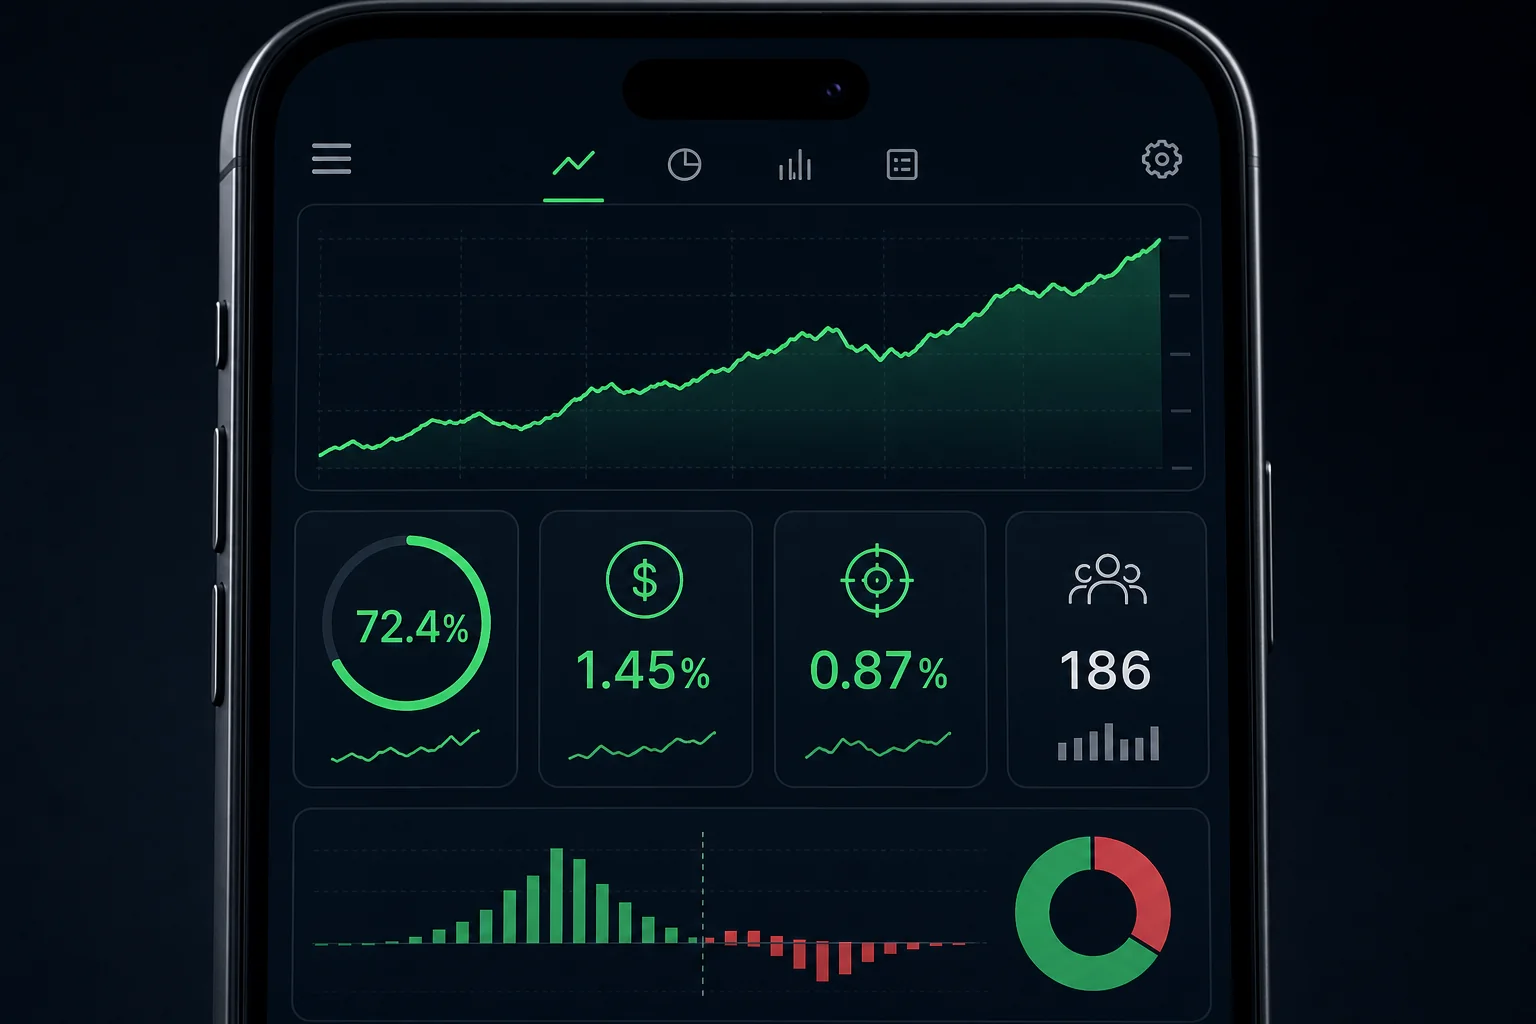
How to Read a Screen's Track Record
When you open a screen in ChartMath, you see its historical Win Rate and Average Return, plus the sample size that underlies those numbers. Here is how to use them:
- Win Rate: the percentage of historical occurrences where the setup produced a positive outcome. A higher Win Rate is not automatically better, it depends on the average return per win versus the average loss per loss.
- Average Return: the mean return across all historical occurrences. This, combined with Win Rate, gives you expected value per trade.
- Sample size: the number of historical instances the backtest is based on. A 70% Win Rate on 12 trades means almost nothing. A 65% Win Rate on 200+ trades is a meaningful signal.
One important note: backtests use bar-close entries with no look-ahead. They do not yet model commissions, slippage, or spread. The numbers are historical, not a forecast or guarantee. Use them to compare setups and filter for edge, not to predict exactly what will happen on the next trade.
For a deeper look at how to evaluate backtest data before risking capital, see How to Build Winning Backtesting Strategies: A Complete Guide.
3. Build a Watchlist That Works While You're at Work
A watchlist is not a list of stocks you find interesting. It is a list of instruments you are actively monitoring for a specific setup. That distinction matters because it determines how you populate it and how you maintain it.
The most common watchlist mistake is letting it grow indefinitely. Traders add tickers when they feel bullish and never remove them. After a few months, the watchlist has 80 names on it, most of which are stale. Monitoring 80 tickers for 200+ setups is not a workflow. It is noise.
How to Populate Your Watchlist From Screener Results
The right way to build a watchlist is to start from screener output. Run your chosen screens, look at the instruments currently matching, and add the ones where the setup is fresh and the chart context makes sense. A watchlist built this way has a reason for every name on it.
ChartMath keeps it simple: one watchlist, server-synced on mobile. When you add a ticker from a screener result, it goes into your watchlist and the app continues monitoring it across all 200+ screens. You are not manually checking each ticker. The screener is doing that for you, continuously.
Watchlist Hygiene
Once a week, remove tickers where the setup has resolved, either it triggered and you traded it, or the pattern broke down and the thesis is gone. A clean watchlist of 15-20 names is more useful than a sprawling list of 80. This is also part of your weekly review, which we will cover in step 6.
For more on building a watchlist that actually drives action, see How to Trade Stocks Without Watching Screen All Day.
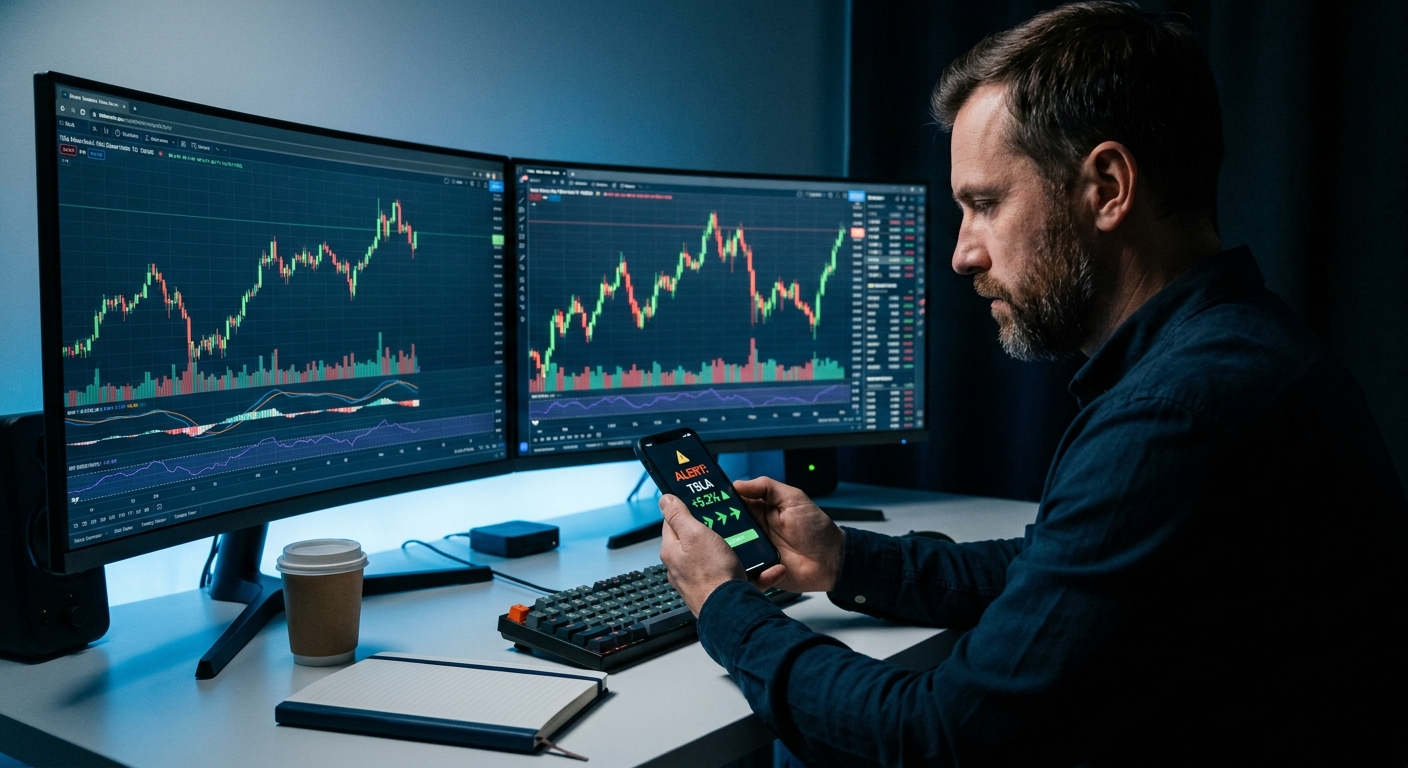
4. Set Up Push Alerts So You Act on the Rule, Not the Feeling
This is the step that makes the workflow actually work for a trader with a day job. Without alerts, you are dependent on being at your desk when the setup triggers. With alerts, the screener watches for you and taps your shoulder the moment the rule is met.
ChartMath sends alerts via push and in-app notifications only. Two types:
- Screen-enter alerts: fire when a ticker enters a screen you have favorited. If you have favorited the VWAP Reclaim screen and a stock on your watchlist enters it, you get a push notification. The alert carries the ticker, the timeframe, the screen name, the screen's filter rules in plain English, and a deep link back into the app.
- Symbol-level alerts: set directly on a ticker for a specific condition.
Alert Hygiene: Why Less Is More
Alert fatigue is real. If your phone buzzes 40 times a day with low-quality signals, you will start ignoring all of them, including the good ones. ChartMath handles this with built-in de-duplication, throttling, a per-bar cap, and timezone-aware quiet hours. You are not getting pinged every minute for the same setup. You get notified once, cleanly, when the condition is met.
The practical implication: be selective about which screens you favorite. If you favorite 50 screens across 80 watchlist tickers, you will get noise. If you favorite 5-8 screens that match your strategy and apply them to a focused watchlist of 15-20 names, you get signal.
For a detailed walkthrough of integrating alerts into your charting setup, see How to Integrate Trading Alerts with Your Charting Platform.
What the Alert Tells You
When an alert fires, you know: which ticker, which timeframe, which screen triggered, what the screen's rules are, and when it fired. What you do next is your decision. The alert is the copilot's report. You are still the pilot.
5. Execute in Your Own Broker, ChartMath Is the Copilot, Not the Pilot
ChartMath does not connect to a broker. It does not place orders. It does not adjust stops. This is intentional, and it is worth understanding why it is a feature rather than a gap.
Automated execution removes the human judgment layer that catches things a rule cannot: news that just broke, a spread that is wider than usual, a position size that does not fit your current risk exposure. The copilot model keeps you in the loop on every trade. The app surfaces the setup. You verify it on your charting platform. You execute in your own brokerage.
The Decision Moment
When an alert fires, your workflow looks like this:
- Open the deep link in ChartMath. Review the screen's rules and the backtest track record.
- Pull up the chart in TradingView or your preferred charting platform. Confirm the setup visually.
- Check your position sizing. Risk 1-2% of your account on the trade, not more.
- Execute in your broker. Set your stop and target based on the setup's exit logic.
This four-step check takes two to three minutes. It is fast enough to act on an intraday alert during a lunch break. It is also deliberate enough to prevent the impulsive entries that blow up accounts.
Position Sizing Before You Enter
No systematic workflow is complete without a position sizing rule. The standard for retail swing traders is 1-2% account risk per trade. That means if your stop is $2.50 away from your entry and you are risking 1% of a $25,000 account ($250), you buy 100 shares. The math is simple and it keeps any single trade from doing serious damage.
For a full breakdown of position sizing mechanics, see Swing Trading with a Full-Time Job: A Real System.
6. Run a Weekly Review to Close the Loop
The weekly review is the most skipped step in every trading workflow. It is also the step that separates traders who improve from traders who repeat the same mistakes for years.
A systematic workflow without a review loop is just a fancier version of gut trading. You are following rules, but you are not learning whether those rules are working for you specifically. The review closes that loop.
What to Review Each Week
Keep it to 20 minutes. Cover three things:
- Alerts fired vs trades taken: How many alerts did you receive? How many did you act on? If you received 30 alerts and took 2 trades, either your filters are too broad or your execution criteria are too strict. Both are worth examining.
- Trade outcomes by screen: Which screens produced the trades you took? How did those trades perform? Over time, you will find that certain screens work better for your style and schedule than others. Lean into those.
- Watchlist cleanup: Remove tickers where the setup has resolved. Add new names from this week's screener results. Keep the list focused.
Adjusting Your Favorited Screens
After four to six weeks of tracking, you will have enough data to make informed decisions about which screens to keep favorited and which to remove. This is the compounding effect of a systematic workflow: each week's review makes the next week's signal quality a little better.
For a structured approach to the weekly review process, see Daily Chart Swing Trade Setups: A Scanner Workflow.
Putting the Full Workflow Together
Here is what the complete workflow looks like for a trader with 30 minutes a day and a full-time job:
Daily Rhythm (10-15 minutes)
- Morning (5-10 min before work): Open ChartMath. Check the Discover feed for fresh setups on your watchlist. Review any overnight alerts. Note any setups forming on the Daily timeframe.
- During the day: Push alerts handle the monitoring. When one fires, you have two to three minutes to check the deep link and decide whether to act.
- Evening (5 min): Quick scan of the Screener for new entries on your favorited screens. Add any strong candidates to your watchlist for tomorrow.
Weekly Rhythm (20 minutes, Sunday or after close Friday)
- Review alerts fired vs trades taken
- Log outcomes by screen
- Clean up the watchlist
- Adjust favorited screens if needed
That is the full system. No Pine Script. No custom backtest infrastructure. No staring at charts all day. The screener watches the universe. The alerts surface the setups. You make the call and execute in your own broker.
Where ChartMath Fits in the Stack
ChartMath is the signal layer. It scans 500+ US equities, 100 crypto pairs, and 11 US futures across 200+ curated, backtested screens and 7 timeframes, continuously. When a ticker enters a screen you have favorited, you get a push notification. The screen's filter rules tell you exactly what condition was met. The backtest data tells you the historical Win Rate and Average Return for that setup. You bring the chart context and the execution judgment.
It works alongside whatever charting platform you already use. There is no formal integration with TradingView or Finviz, they are separate tools. ChartMath handles discovery and alerting. Your charting platform handles the visual confirmation. Your broker handles the execution. Each tool does one job well.
For traders who have been using Finviz or TradingView as their primary screener, the gap ChartMath fills is the one those tools were never designed to fill: continuous monitoring with backtested edge data and mobile push alerts. You can browse the full screen library at chartmath.com/screens before downloading anything.
The goal of a systematic workflow is not to trade more. It is to trade better, with evidence, with rules, and with less time staring at screens. ChartMath starts with a 14-day free trial, no card to start. After the trial it's $24.99/month founding pricing (locked for 12 months) or $149/year.
Getting Started
Building a systematic trading workflow from scratch does not require months of setup. The infrastructure already exists. What it requires is a decision to stop trading on feel and start trading on rules.
Start by browsing the screen library at chartmath.com/screens. Pick three to five screens that match your strategy. Download the app, build your watchlist, and favorite those screens. The alerts will handle the rest.
Start with a 14-day free trial, then $24.99/mo founding (locked 12 months) or $149/yr — no card to start. Get ChartMath on iOS or Android and run your first systematic scan today.
Frequently Asked Questions
Do I need to know how to code to use ChartMath?
No. ChartMath requires no Pine Script and no coding of any kind. The 200+ screens are pre-built and curated. You browse them, favorite the ones that match your strategy, and the app does the scanning.
What markets does ChartMath cover?
ChartMath is US-first: 500+ US equities (NYSE/Nasdaq), 100 crypto pairs, and 11 US futures, across 7 timeframes from 1-minute to monthly.
Does ChartMath place trades automatically?
No. ChartMath is a copilot, not an autopilot. It surfaces setups and sends alerts. You make the decision and execute in your own brokerage. There is no broker connection and no order placement.
How are the screens validated?
Every screen in ChartMath is backtested before it ships. The app shows the historical Win Rate, Average Return, expected value, and sample size for each screen. Backtests use bar-close entries with no look-ahead and do not yet model commissions, slippage, or spread. The numbers are historical, not a forecast.
What kind of alerts does ChartMath send?
Push and in-app notifications only. Alerts fire when a ticker enters a screen you have favorited, or when a symbol-level condition is met. Each alert carries the ticker, timeframe, screen name, the screen's filter rules, and a deep link back into the app.
Is ChartMath free?
ChartMath is a paid product with a 14-day free trial. After the trial it's $24.99/month founding pricing (locked for 12 months) or $149/year. No credit card to start.

Ankush Jindal
LinkedInSee these setups live in ChartMath
200+ curated screens with backtest data. 14-day free trial.