Gap Fill Trading Strategy: How to Trade Stock Gaps
You've seen it happen dozens of times. A stock gaps up 5% at the open on earnings news, and within two hours, it's back to yesterday's close. Or maybe you watched a gap down get completely erased by lunchtime. These aren't random. They're tradable patterns, and traders work them with a gap fill trading strategy.
Gap fills are one of the most studied technical setups in the market. When a stock opens significantly higher or lower than its previous close, it creates a price "gap" on the chart. The tendency for price to eventually return and "fill" that gap creates trading opportunities with defined risk and reward parameters.
This guide covers the whole loop: how to spot the gaps that actually fill, how to tell them apart from the ones that keep running, and how to write the entry, stop, and target down before you click buy. Scanning narrows the field to a handful of names. The trade is still your call.
What Is a Gap Fill Trading Strategy?
A gap fill trading strategy is a technical trading approach that capitalizes on the market's tendency to revisit price levels that were "skipped" during a gap. When a stock opens at a price significantly different from its previous close, it creates an empty space on the price chart—a gap. A gap is considered "filled" when the price returns to trade within that empty zone.
Gaps occur for several reasons: overnight news, earnings announcements, economic data releases, or simply imbalances between supply and demand during after-hours trading. The psychology behind gap fills is straightforward: gaps represent areas where no price discovery occurred, creating inefficiencies that the market often corrects.
Here's why gap fills work as a trading strategy:
- Market inefficiency correction: Gaps create price levels with no trading activity, and markets naturally seek to establish value at all price points
- Profit-taking behavior: Traders who bought before a gap up often take profits, pushing price back down toward the gap
- Short-covering dynamics: Gap downs attract short sellers, whose eventual covering can push price back up to fill the gap
- Technical support/resistance: The gap zone itself becomes a magnetic price level that attracts future trading activity
Widely cited gap studies put the overall fill rate somewhere near 70%, though that number moves a lot with gap type, market conditions, and the catalyst behind the gap. Some gaps fill within hours, others take days or weeks, and some never fill at all. The key to successful gap fill trading is identifying which gaps have the highest probability of filling and on what timeframe.
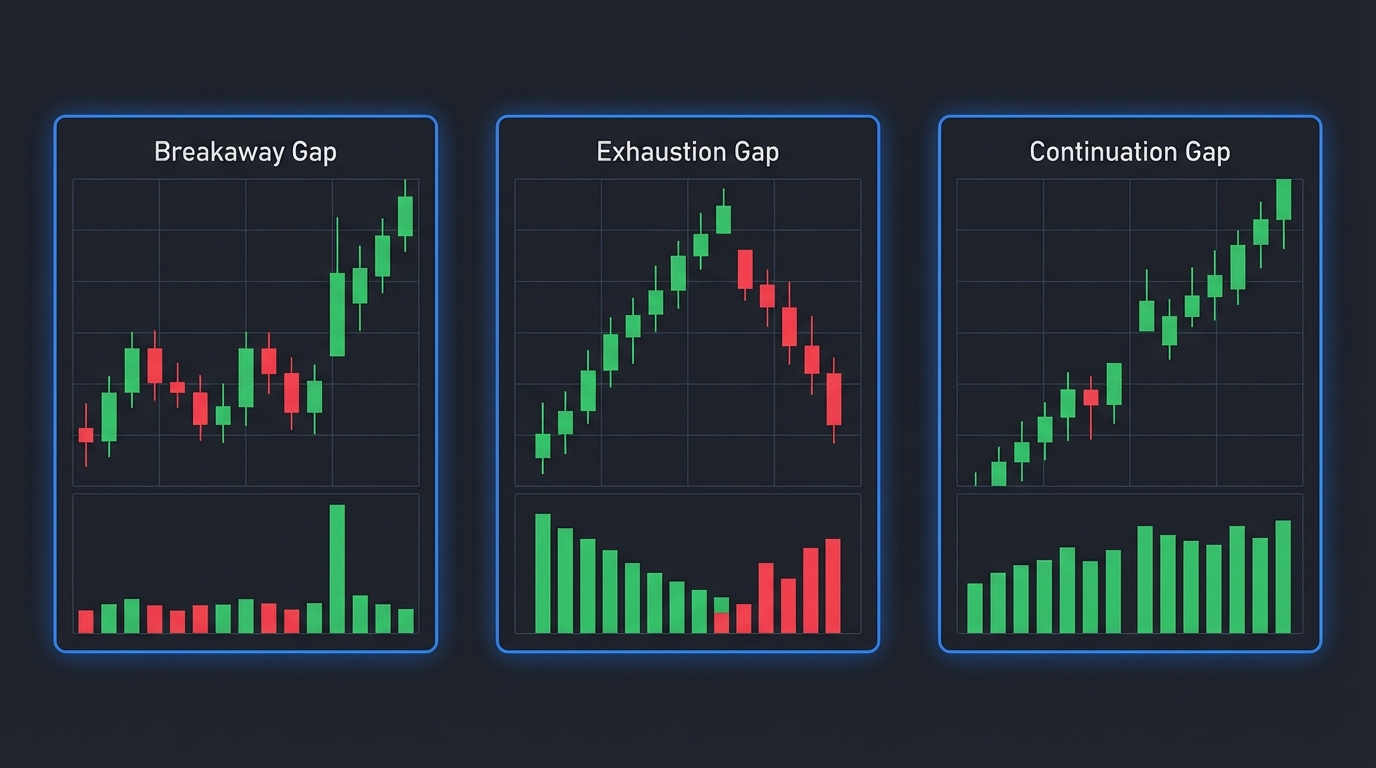
The 3 Types of Stock Gaps Every Trader Must Know
Not all gaps are created equal. Understanding the different types of gaps is crucial for implementing an effective gap fill trading strategy because each type has dramatically different fill probabilities and timeframes.
Breakaway Gaps
Breakaway gaps occur when price gaps out of a consolidation pattern or trading range, signaling the start of a new trend. These gaps typically happen on high volume and are accompanied by a clear catalyst like earnings, FDA approval, or major news.
Fill probability: Low to moderate (30-50%). Breakaway gaps often don't fill for extended periods because they represent genuine shifts in supply and demand dynamics. When they do fill, it's usually weeks or months later, not intraday.
Trading approach: Don't aggressively trade against breakaway gaps expecting quick fills. If you do trade them, use longer timeframes and wider stops. These are better suited for swing trading strategies rather than day trading.
Exhaustion Gaps
Exhaustion gaps appear near the end of a strong trend, representing a final surge of buying or selling before the trend reverses. They're characterized by climactic volume and often occur after an extended move in one direction.
Fill probability: High (70-90%). Exhaustion gaps fill quickly—often within the same day or within a few trading sessions—because they represent overextension and emotional trading rather than fundamental value shifts.
Trading approach: These are prime candidates for gap fill trades. Look for exhaustion gaps after multi-day runs, especially when accompanied by extreme RVOL (relative volume) readings. Entry on the first sign of reversal can yield quick profits as the gap fills.
Continuation Gaps (Runaway Gaps)
Continuation gaps occur in the middle of a strong trend, representing a pause and resumption of the dominant direction. They signal strong momentum and typically happen on moderate volume.
Fill probability: Low (20-40%). These gaps often don't fill until the entire trend completes, which could be weeks or months later. Trading against continuation gaps is a low-probability strategy.
Trading approach: Avoid betting on fills for continuation gaps. Instead, consider trading in the direction of the gap as part of a momentum trading strategy.
Common Gaps vs. Significant Gaps
Beyond these three types, traders distinguish between "common gaps" (small gaps under 2% with no clear catalyst) and "significant gaps" (larger gaps over 3% with news or volume confirmation). Common gaps fill at a much higher rate, often 80-90% within days, making them excellent candidates for gap fill trading strategies.
Volume context matters enormously. A 4% gap on 10x normal volume suggests a breakaway gap that may not fill soon. The same 4% gap on normal volume with no news is likely an exhaustion or common gap that will fill quickly.
1. Identify High-Probability Gap Fill Setups
The foundation of any successful gap fill trading strategy is identifying which gaps are most likely to fill and on what timeframe. Not every gap deserves your capital, so filtering for high-probability setups is essential.
Pre-Market Gap Scanning
Your gap fill hunting begins before the market opens. During pre-market hours (4:00 AM - 9:30 AM ET), scan for stocks showing significant gaps from the previous day's close. Focus on these criteria:
- Gap size: Look for gaps between 2% and 8%. Gaps under 2% often lack the momentum to create tradable moves, while gaps over 8% may indicate fundamental shifts that won't fill quickly
- Pre-market volume: Compare current pre-market volume to the stock's average. Low pre-market volume on a gap suggests weak conviction and higher fill probability
- Catalyst presence: Check for news, earnings, or announcements. Gaps without clear catalysts fill at much higher rates than catalyst-driven gaps
- Previous day's trend: Gaps that occur after extended single-day moves are more likely to be exhaustion gaps that fill quickly
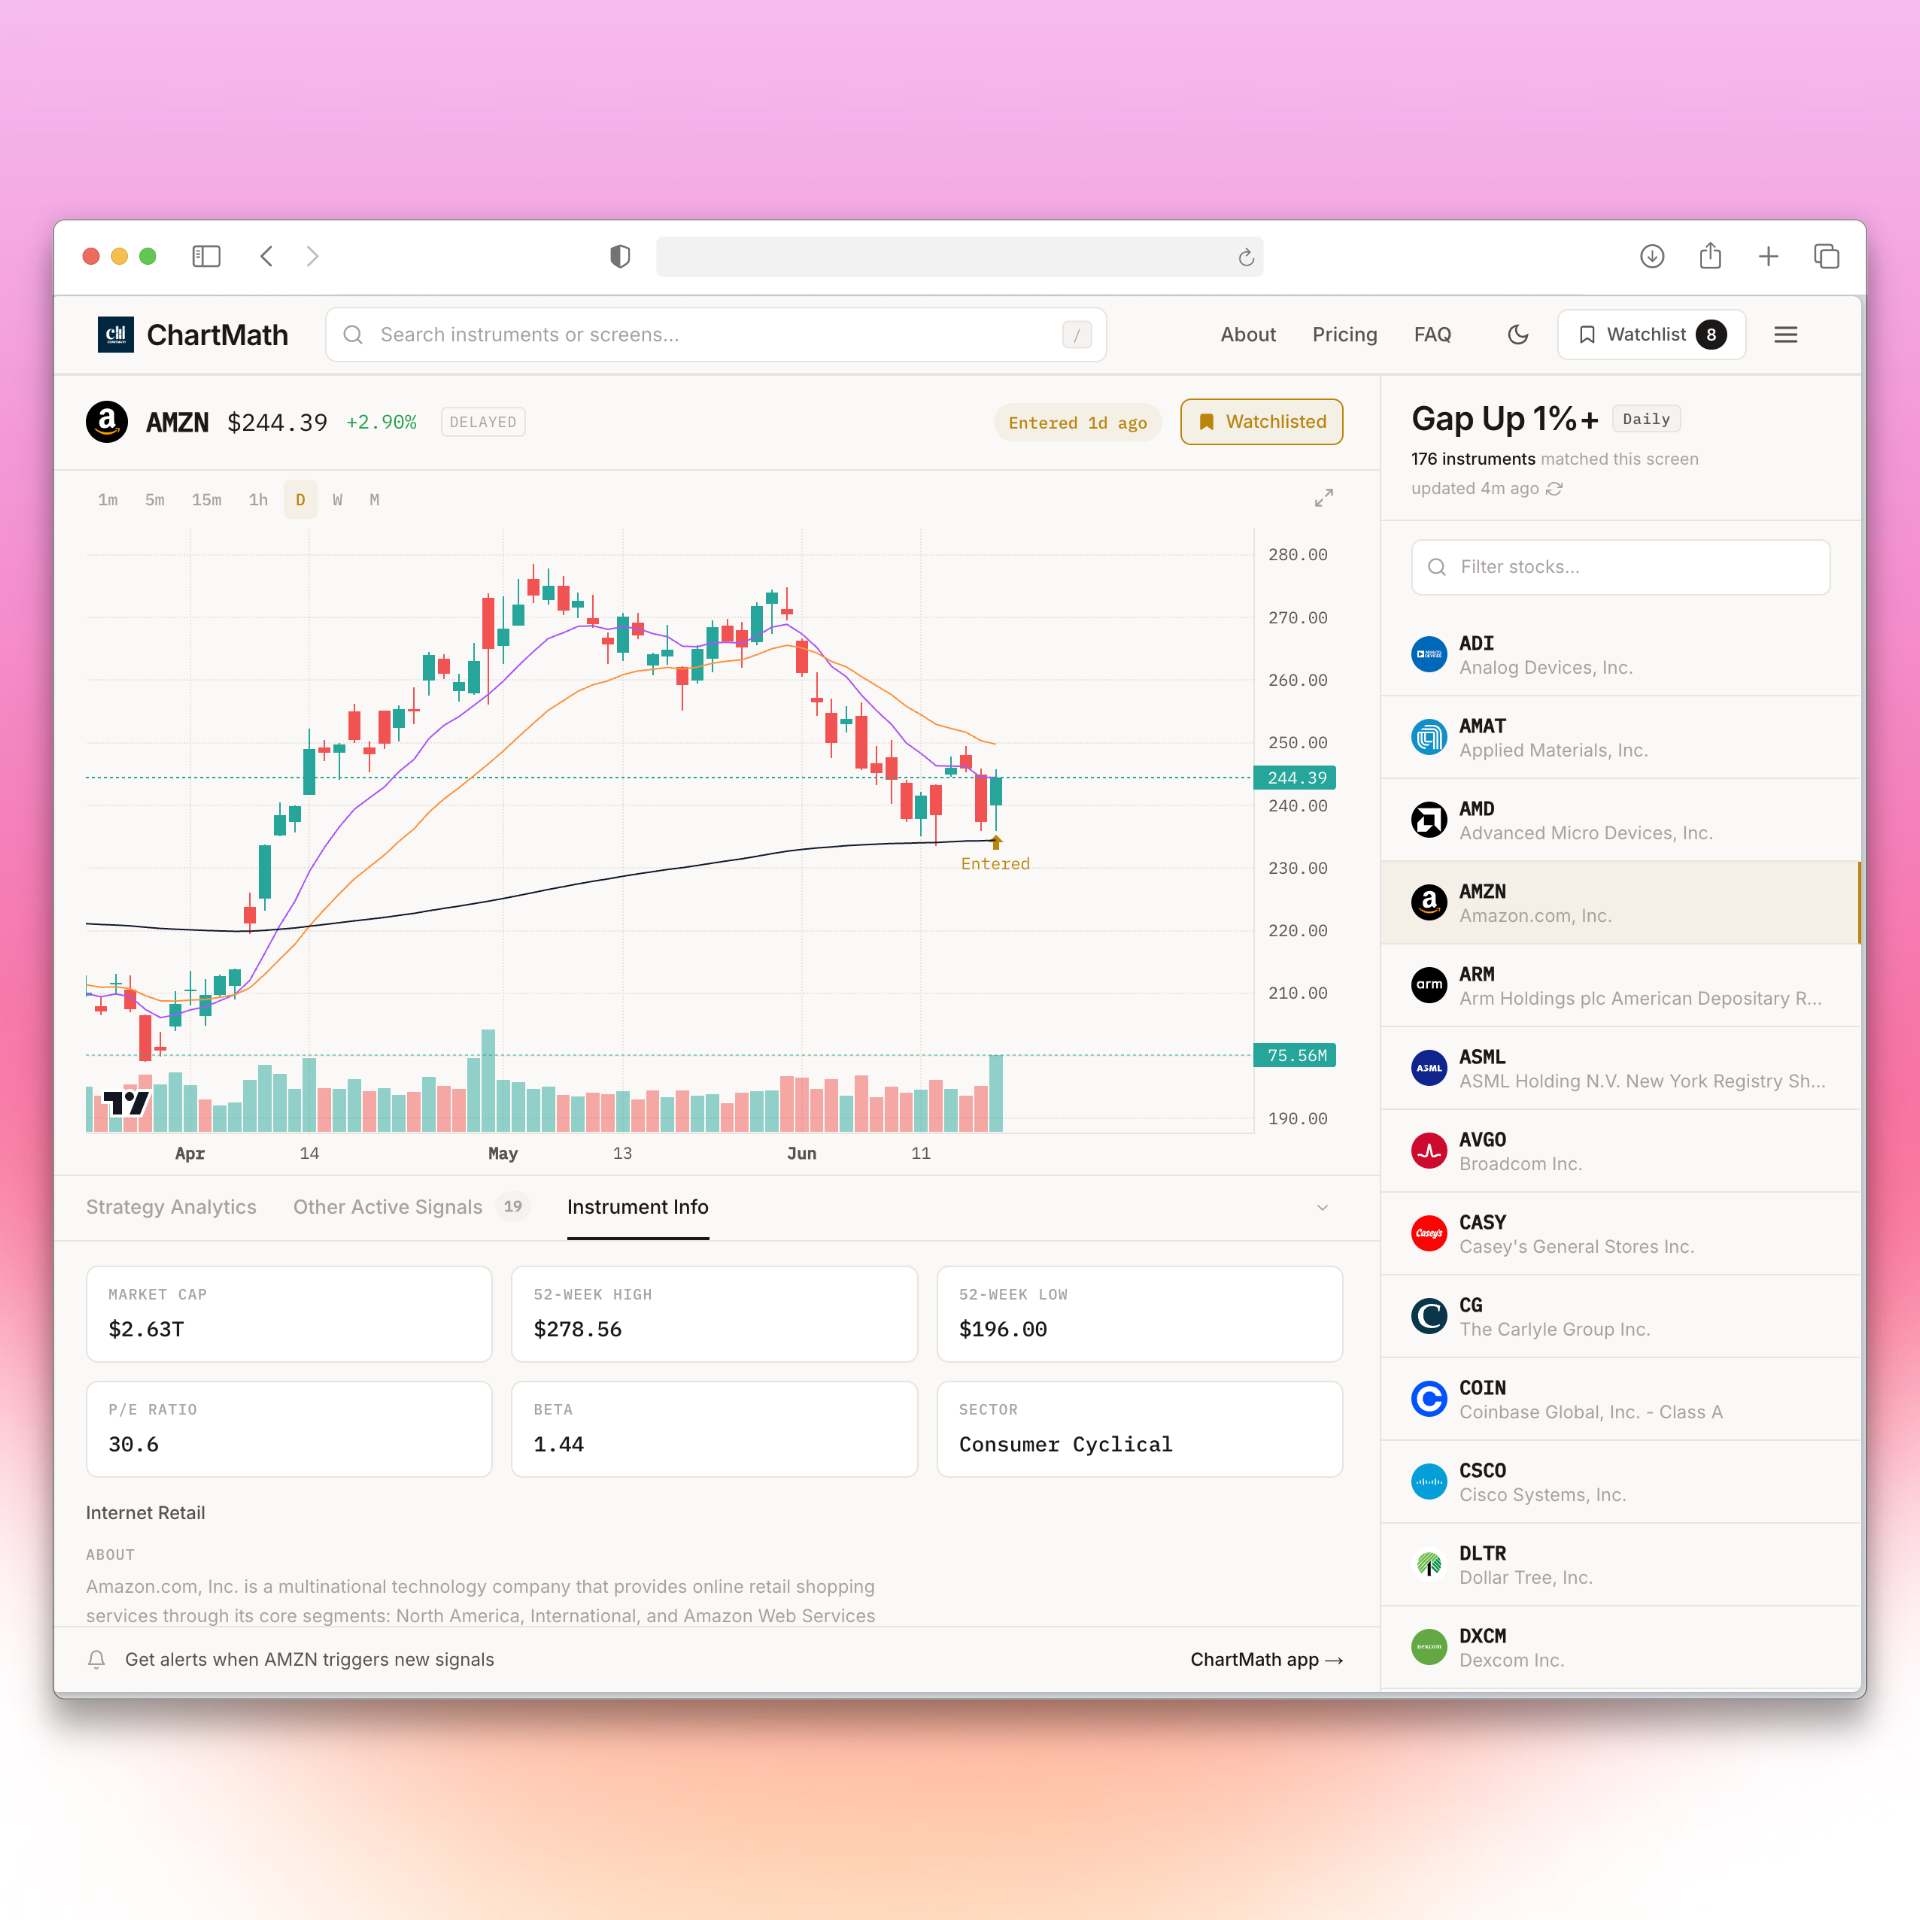
A trade discovery tool can automate this pass, narrowing a fixed universe of 500+ US equities down to the handful showing gap fill characteristics that morning. The machine narrows the field. You still decide which ones are worth your capital.
Volume Analysis: RVOL and Unusual Activity
Relative volume (RVOL) is one of the most powerful indicators for gap fill trading. RVOL compares current volume to the average volume at the same time of day, revealing whether the gap is attracting unusual attention.
High RVOL (3x or higher): Suggests strong interest and conviction. These gaps are less likely to fill immediately, especially if accompanied by a catalyst. Wait for volume to dry up before entering gap fill trades.
Normal to low RVOL (1x to 2x): Indicates the gap isn't attracting significant attention, making it more likely to fill as traders take profits or fade the move. These are your prime gap fill candidates.
ChartMath monitors RVOL across timeframes and flags gap setups whose volume profile has historically preceded fills. There are 200+ screens in the catalog, each one a deterministic rule with a backtest behind it, gap patterns included.
Gap Size Sweet Spot
Fill rates fall as gaps get bigger. The ranges below are directional, drawn from published gap research rather than from a ChartMath backtest, so treat them as a starting hypothesis and recompute them on your own universe before you trade them:
- 2-4% gaps: The sweet spot. High fill rate within a handful of sessions, and the best risk-reward for most traders
- 4-6% gaps: Fill rate drops. Still tradable, but they require more patience and wider stops
- 6-8% gaps: Closer to a coin flip. Better suited to partial position sizing or longer timeframe trades
- Over 8% gaps: Most don't fill quickly. Generally avoid unless clear exhaustion signals appear
Catalyst vs. No-Catalyst Gaps
This distinction is critical. Gaps without news or catalysts are often caused by after-hours order imbalances or algorithmic trading, and they fill at dramatically higher rates. When you identify a 3% gap with no earnings, no news, and no sector movement, you've found a high-probability gap fill setup.
Conversely, gaps driven by earnings beats, FDA approvals, or major contracts represent potential fundamental revaluations. These may not fill for weeks or months, if ever. Your gap fill trading strategy should heavily weight no-catalyst gaps for short-term trades.
2. Determine When Gaps Are Most Likely to Fill
Timing is everything in gap fill trading. Understanding when gaps typically fill helps you set realistic profit targets and avoid premature exits or extended holding periods.
Timeframe Analysis
Gap fills occur across multiple timeframes, and your trading style should dictate which you target:
Intraday fills (same day): A large share of small gaps fill within the same session. These suit traders who can watch the tape. Morning gaps that show weakness in the first 30 minutes often fill by lunch or close.
1-3 day fills: Another slice of gaps fill within three sessions. This is the swing trader's window: enter on the first day, hold through the fill, and let the alert tell you when it completes.
1-2 week fills: A smaller group takes up to two weeks. These require patience and suit longer timeframes.
Extended fills (over 2 weeks): The remaining gaps either fill after extended periods or never fill at all. These are generally not worth trading with a gap fill strategy.
For intraday trading approaches, focus on gaps showing early signs of reversal within the first hour. If a gap hasn't started filling by 11:00 AM ET, the odds of a same-day fill drop off.
Market Conditions That Favor Gap Fills
Broader market conditions dramatically impact gap fill probability:
- Low volatility environments (VIX under 20): Gaps fill at higher rates as markets mean-revert more consistently
- Choppy, range-bound markets: Excellent for gap fills as there's no strong directional bias to sustain gaps
- Strong trending markets: Gaps in the direction of the trend are less likely to fill; counter-trend gaps fill more readily
- High volatility spikes (VIX over 30): Gap fill rates decrease as fundamental uncertainty keeps prices dislocated longer
Morning Gap Fills vs. Afternoon Reversals
Time of day matters. Gaps that begin filling in the first 30 to 60 minutes of trading are far more likely to complete the fill by the close. Gaps that hold through lunch (12:00-1:00 PM ET) are much less likely to fill the same day.
The optimal entry window for same-day gap fill trades is typically between 9:45 AM and 10:30 AM ET, after the opening volatility settles but before the lunch doldrums. This is when you'll see the clearest reversal signals if a gap is going to fill.
3. Execute Gap Fill Trades with Proper Entry Rules
Identifying a high-probability gap fill setup is only half the battle. Execution, knowing exactly when to enter, separates profitable gap fill traders from those who give back their gains.
Entry Timing: Immediate vs. Confirmation-Based
There are two primary entry approaches for gap fill trading:
Immediate entry at the open: Enter as soon as the market opens, betting that the gap will fill. This approach works best for small gaps (2-3%) with no catalyst and low pre-market volume. The advantage is getting the best price; the disadvantage is no confirmation that the fill will actually occur.
Confirmation-based entry: Wait for price action to confirm the gap is starting to fill before entering. This might mean waiting for the first 5-minute candle to close back toward the gap, or for price to break below a key level. You sacrifice some profit potential but dramatically increase win rate.
Most professional traders use confirmation-based entries, accepting slightly worse prices in exchange for higher probability setups. A good rule: if the gap is under 3%, you can be more aggressive; if it's over 4%, wait for confirmation.
Using VWAP as an Entry Trigger
The Volume Weighted Average Price (VWAP) is an exceptional tool for gap fill entries. Here's how to use it:
For gap ups: Wait for price to cross back below VWAP. This signals that the average buyer from the open is now underwater, creating selling pressure that often accelerates the gap fill. Enter short (or buy puts) on the VWAP break with a stop above the high of day.
For gap downs: Wait for price to reclaim VWAP to the upside. This shows buyers stepping in with enough conviction to push price above the average, often leading to a full gap fill. Enter long on the VWAP reclaim with a stop below the low of day.
ChartMath includes VWAP-based screens that alert you in real-time when stocks cross VWAP after gapping, giving you immediate notification of potential gap fill entries without manually monitoring charts all day.
Support and Resistance Within the Gap Zone
The gap itself creates natural support and resistance levels. For a gap up, the top of the gap (previous day's close) acts as support once price fills back into the gap. For a gap down, the bottom of the gap becomes resistance.
Advanced gap fill traders use these levels for scaling in and out of positions. You might enter 50% of your position on the initial reversal signal, add another 25% when price enters the gap zone, and the final 25% when price reaches the midpoint of the gap.
Multiple Timeframe Confirmation
Before entering any gap fill trade, check at least two timeframes for confirmation. If you're trading on a 5-minute chart, verify that the 15-minute chart also shows reversal signals. If you're using a 15-minute chart, check the hourly.
This multi-timeframe approach filters out false signals and increases the probability that the reversal is genuine rather than a temporary pullback before the gap extends further.
4. Set Strategic Exit Points and Stop Losses
Knowing when to exit is just as important as knowing when to enter. The gap fill trading strategy offers natural profit targets, but you need a plan for both winning and losing scenarios.
Full Fill vs. Partial Fill Profit Targets
You have three primary profit target options:
Full gap fill (100%): Hold until price completely fills the gap, returning to the previous day's close. This maximizes profit but means you'll hold through pullbacks and may miss optimal exits. Best used when conviction is high and the gap is small (under 3%).
Partial fill (50-75%): Exit when price fills 50-75% of the gap. This approach captures the majority of the move while avoiding the risk that price stalls before completing the full fill. Recommended for larger gaps (4-6%) or when market conditions are uncertain.
Scaled exits: Exit in thirds, take 33% off at 50% fill, another 33% at 75% fill, and let the final third run to full fill or stop out. This balances profit-taking with the potential for full gap fills.
Whichever you choose, choose it before you enter. An exit rule invented mid-trade is not a rule, it's a mood.
Trailing Stops for Extended Moves
Sometimes gaps not only fill but reverse significantly beyond the fill point. Using a trailing stop allows you to capture these extended moves without giving back profits.
A simple approach: once the gap is 75% filled, move your stop to breakeven. If price continues and completes the full fill, trail your stop using the previous 5-minute low (for longs) or high (for shorts). This lets winners run while protecting capital.
Stop Loss Placement
Stop losses for gap fill trades should be placed beyond the gap extremes:
For gap up fades (shorting/buying puts): Place your stop 1-2% above the high of the day. If price extends the gap rather than filling it, you're wrong and need to exit.
For gap down reversals (going long/buying calls): Place your stop 1-2% below the low of the day. If selling pressure continues, the gap fill thesis is invalidated.
Never use mental stops for gap fill trades. The volatility around gaps can trigger emotional decision-making. Use hard stops placed in your platform to enforce discipline.
Risk-Reward Ratios
Aim for minimum 2:1 reward-to-risk ratios on gap fill trades. If you're risking $1 per share to the stop, you should be targeting at least $2 per share to the fill point. Gaps that don't offer at least 2:1 aren't worth trading, the probability doesn't justify the risk.
For high-probability setups (exhaustion gaps, no-catalyst gaps under 3%), you can accept 1.5:1 ratios because the win rate is higher. For lower-probability setups (larger gaps, catalyst-driven), demand 3:1 or better.
5. Use Real-Time Scanning Tools to Catch Gap Opportunities
Manual gap scanning is time-consuming and inefficient. By the time you've identified a gap, analyzed the chart, and decided to trade, the optimal entry may have passed. Real-time scanning tools automate the discovery process, alerting you to gap fill opportunities the moment they meet your criteria.
Pre-Market Scanner Requirements
An effective pre-market scan for gap fill trading should filter for:
- Gap size (customizable range, typically 2-8%)
- Pre-market volume vs. average
- Market cap filters (avoid illiquid small caps)
- News/catalyst detection (to identify no-catalyst gaps)
- Previous day's price action (to identify exhaustion setups)
The scan should update in real-time as pre-market trading progresses, not just provide a static list from 4:00 AM. Gap characteristics change as more information becomes available and volume builds.
Intraday Gap Monitoring
Once the market opens, your scanning needs shift to monitoring gap fill progression. You need alerts for:
- VWAP crosses after gaps (primary entry trigger)
- Price entering the gap zone (50% retracement alerts)
- Volume spikes that might accelerate or stall the fill
- Multi-timeframe confirmation signals (5m, 15m, 1h alignment)
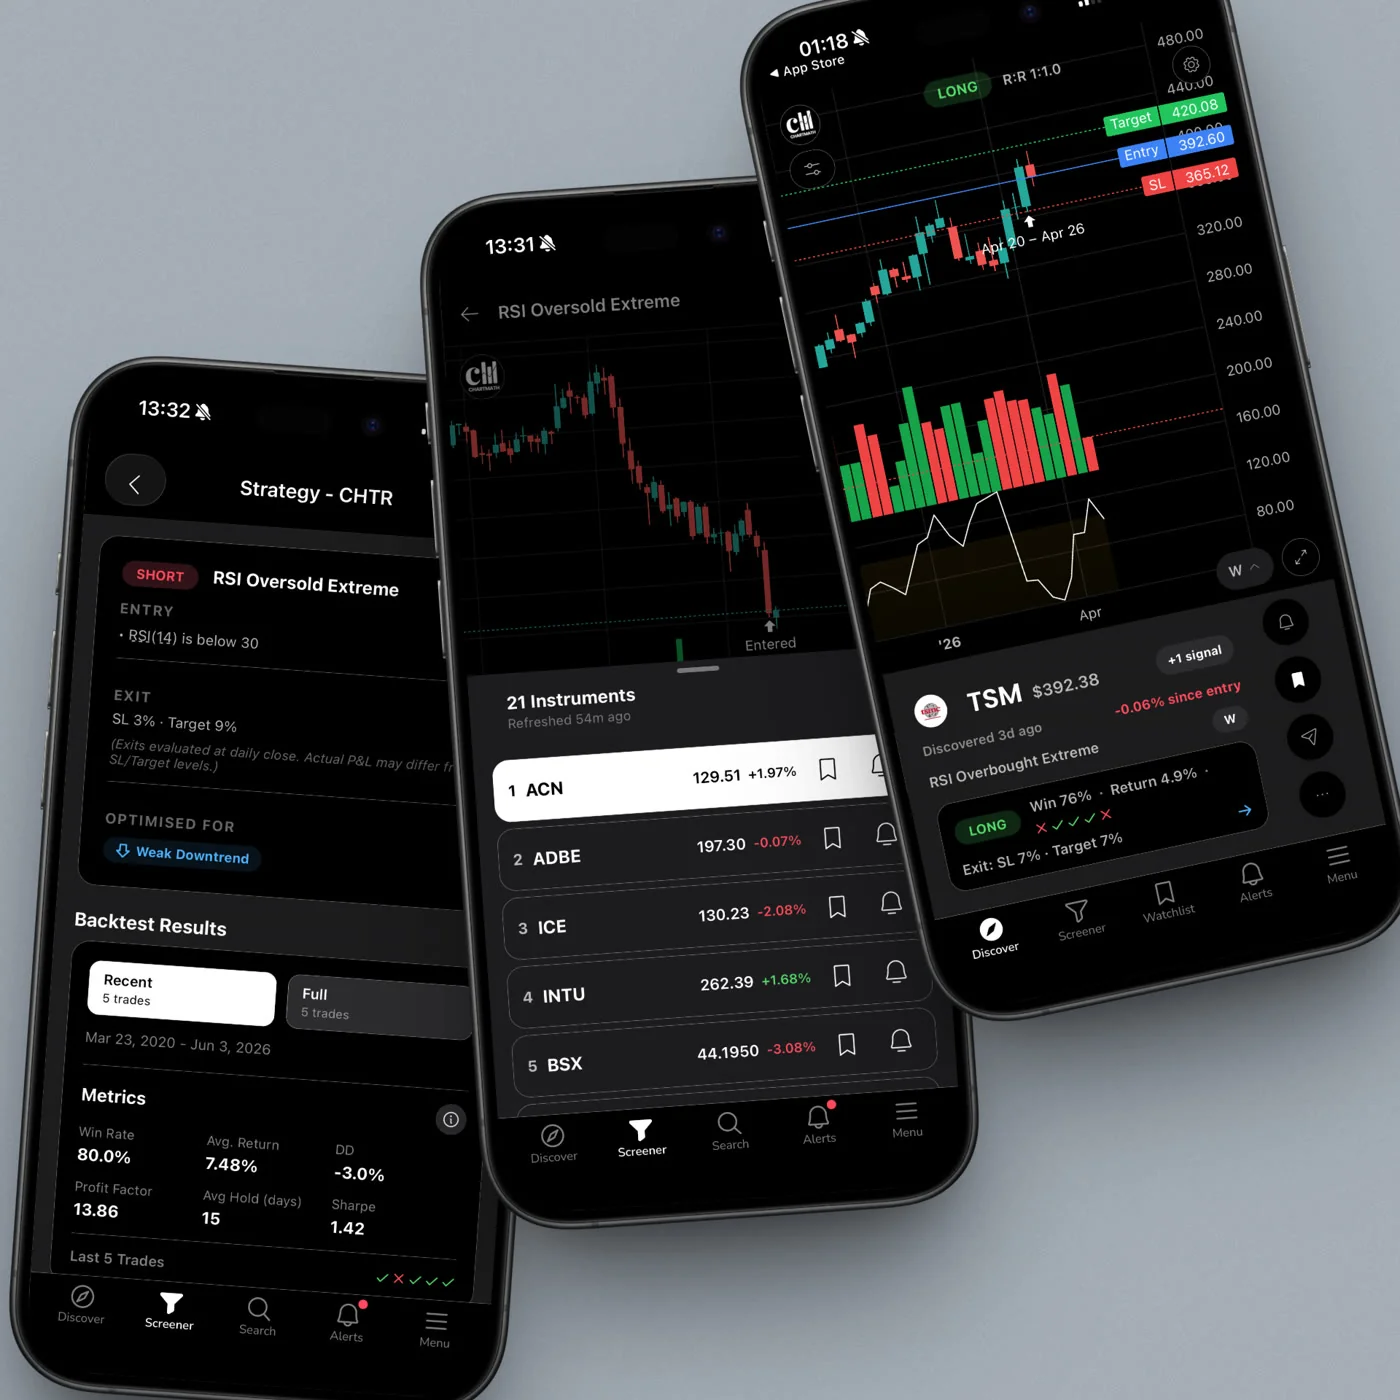
ChartMath's platform continuously scans over 200 technical setups, including gap patterns across all timeframes. When a stock gaps and then shows reversal signals, VWAP reclaim, volume confirmation, or entry into the gap zone, you receive a push alert with plain-English explanation of why the setup triggered.
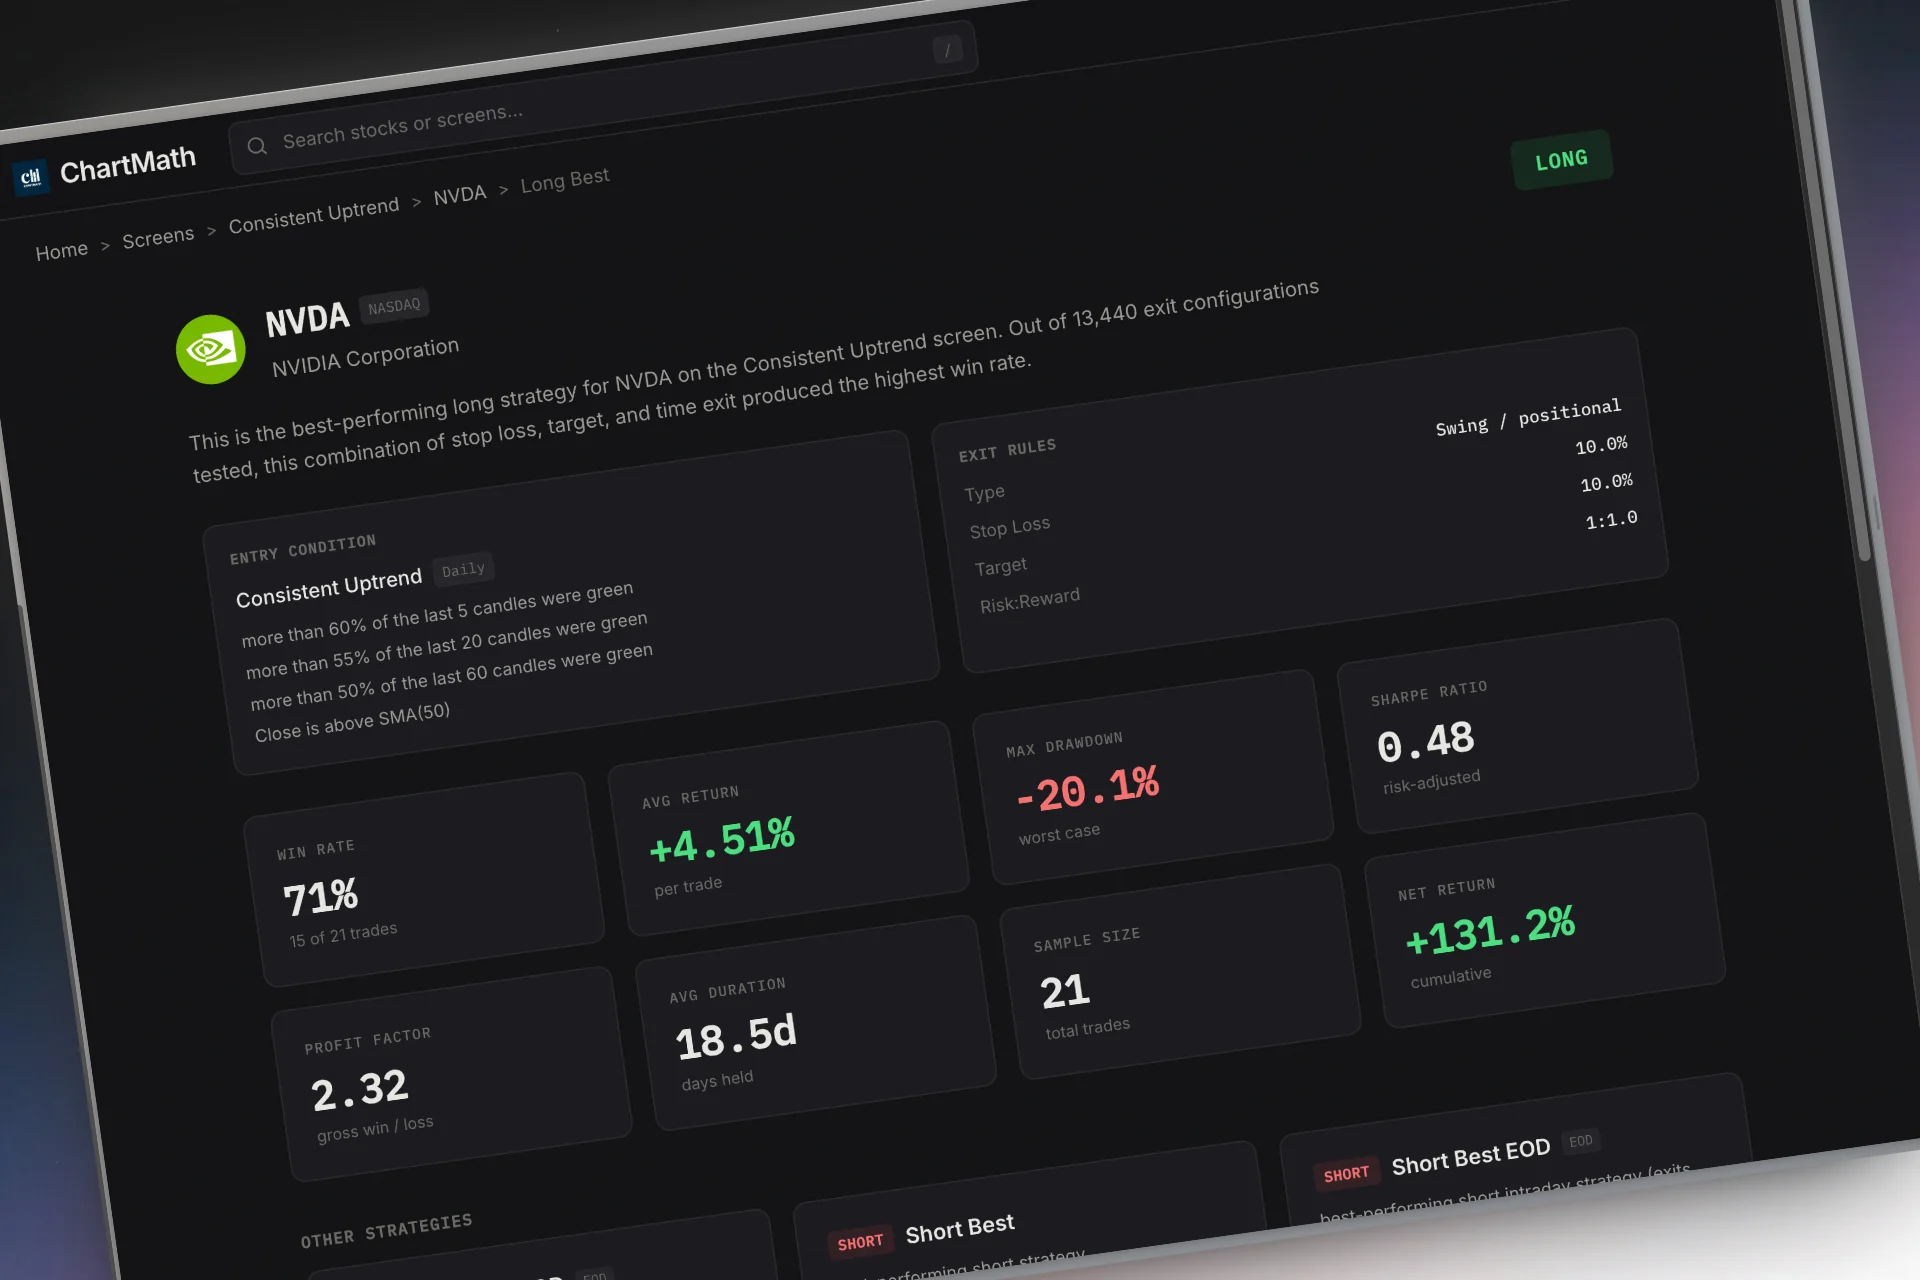
Setups arrive ranked by quality and freshness, so the strongest candidates are the ones you see first. Each alert carries the backtest for the screen that surfaced it: historical win rate and average return for that specific rule, so you can judge the setup instead of guessing at it.
Alert Systems and Push Notifications
The best gap fill traders aren't glued to their screens all day. They use alert systems to notify them when specific conditions are met. Your alert system should support:
- Custom gap size thresholds
- Technical trigger alerts (VWAP cross, support/resistance breaks)
- Time-based alerts (gaps that haven't filled by 11 AM)
- Multi-condition alerts (gap + volume + VWAP cross simultaneously)
Push notifications to your phone ensure you never miss a setup, even when you're in meetings or away from your trading desk. This is especially valuable for traders who can't monitor markets continuously but want to catch high-probability gap fill opportunities.
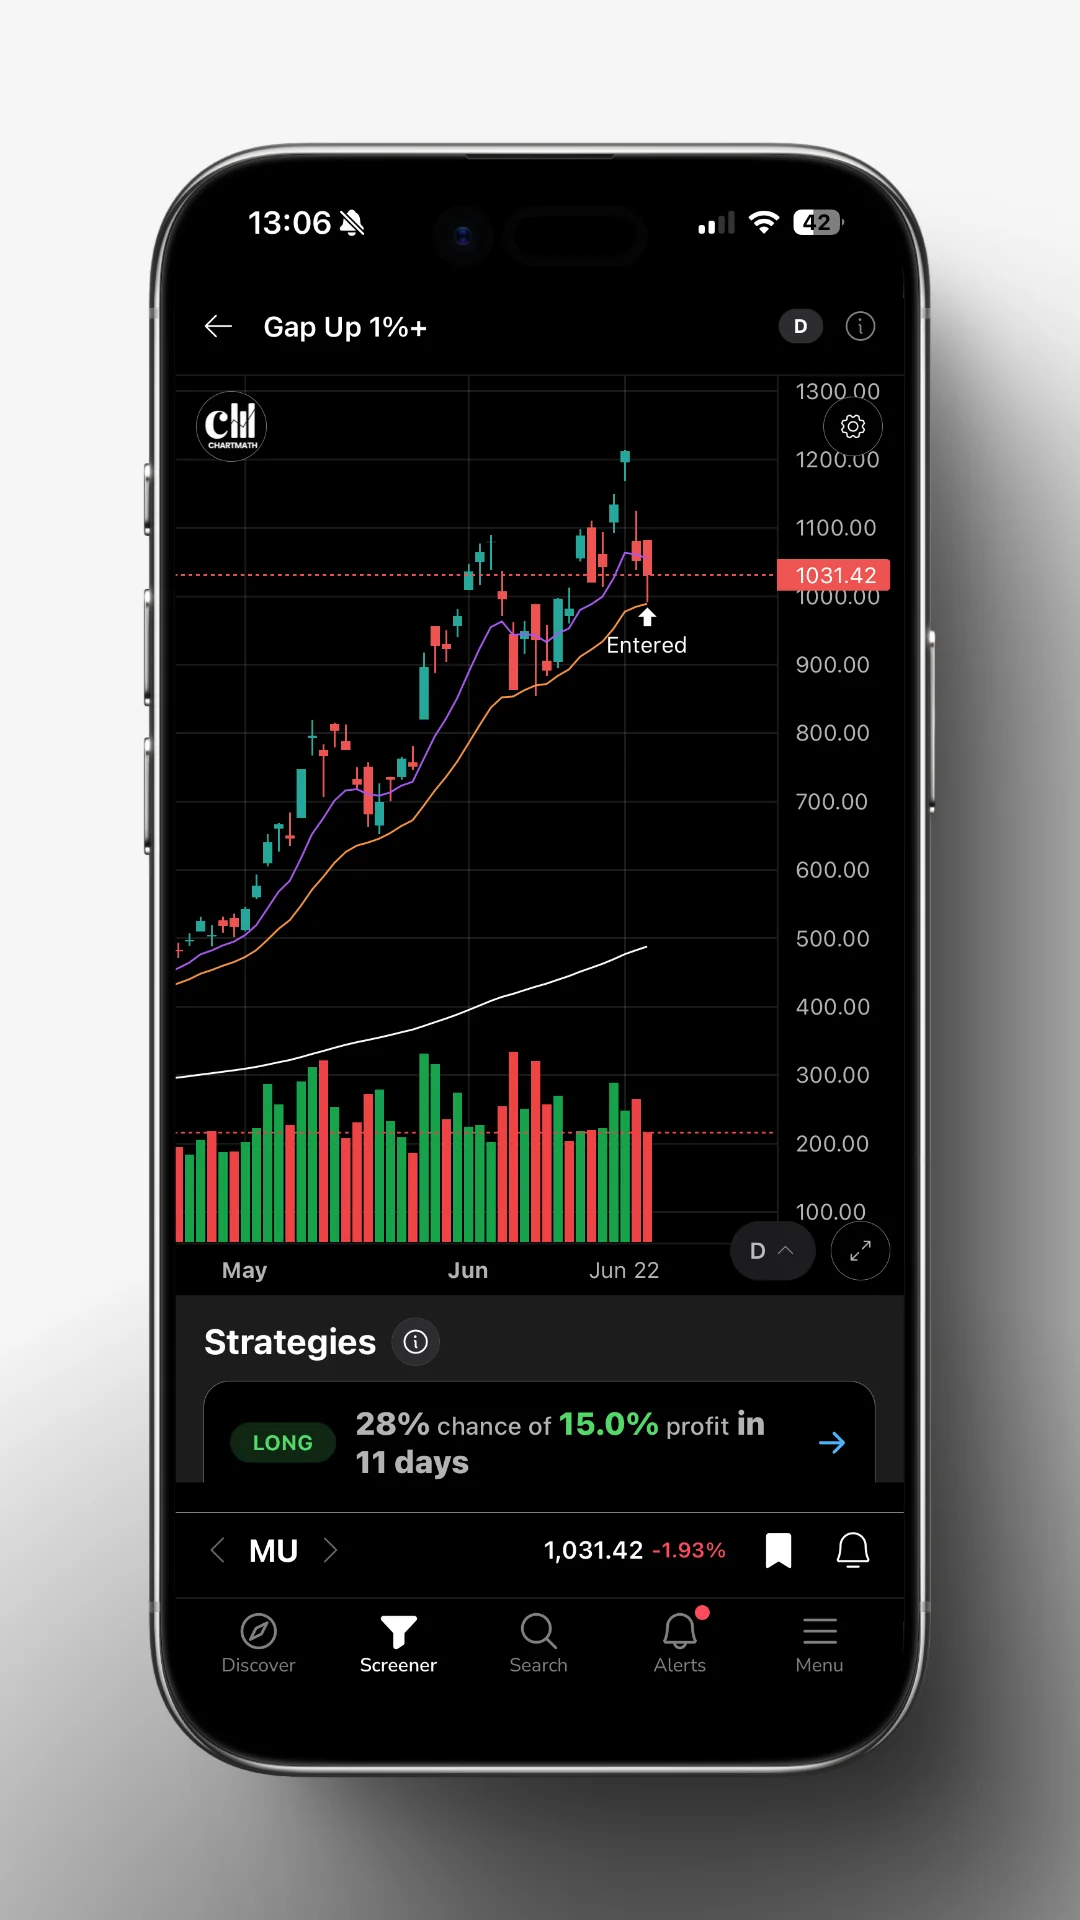
Mobile-First Gap Scanning
The reality of modern trading is that you're not always at a desktop. Whether you're commuting, at the gym, or in a meeting, gap fill opportunities don't wait. Mobile-first scanning tools let you discover and analyze gap fill setups from your phone.
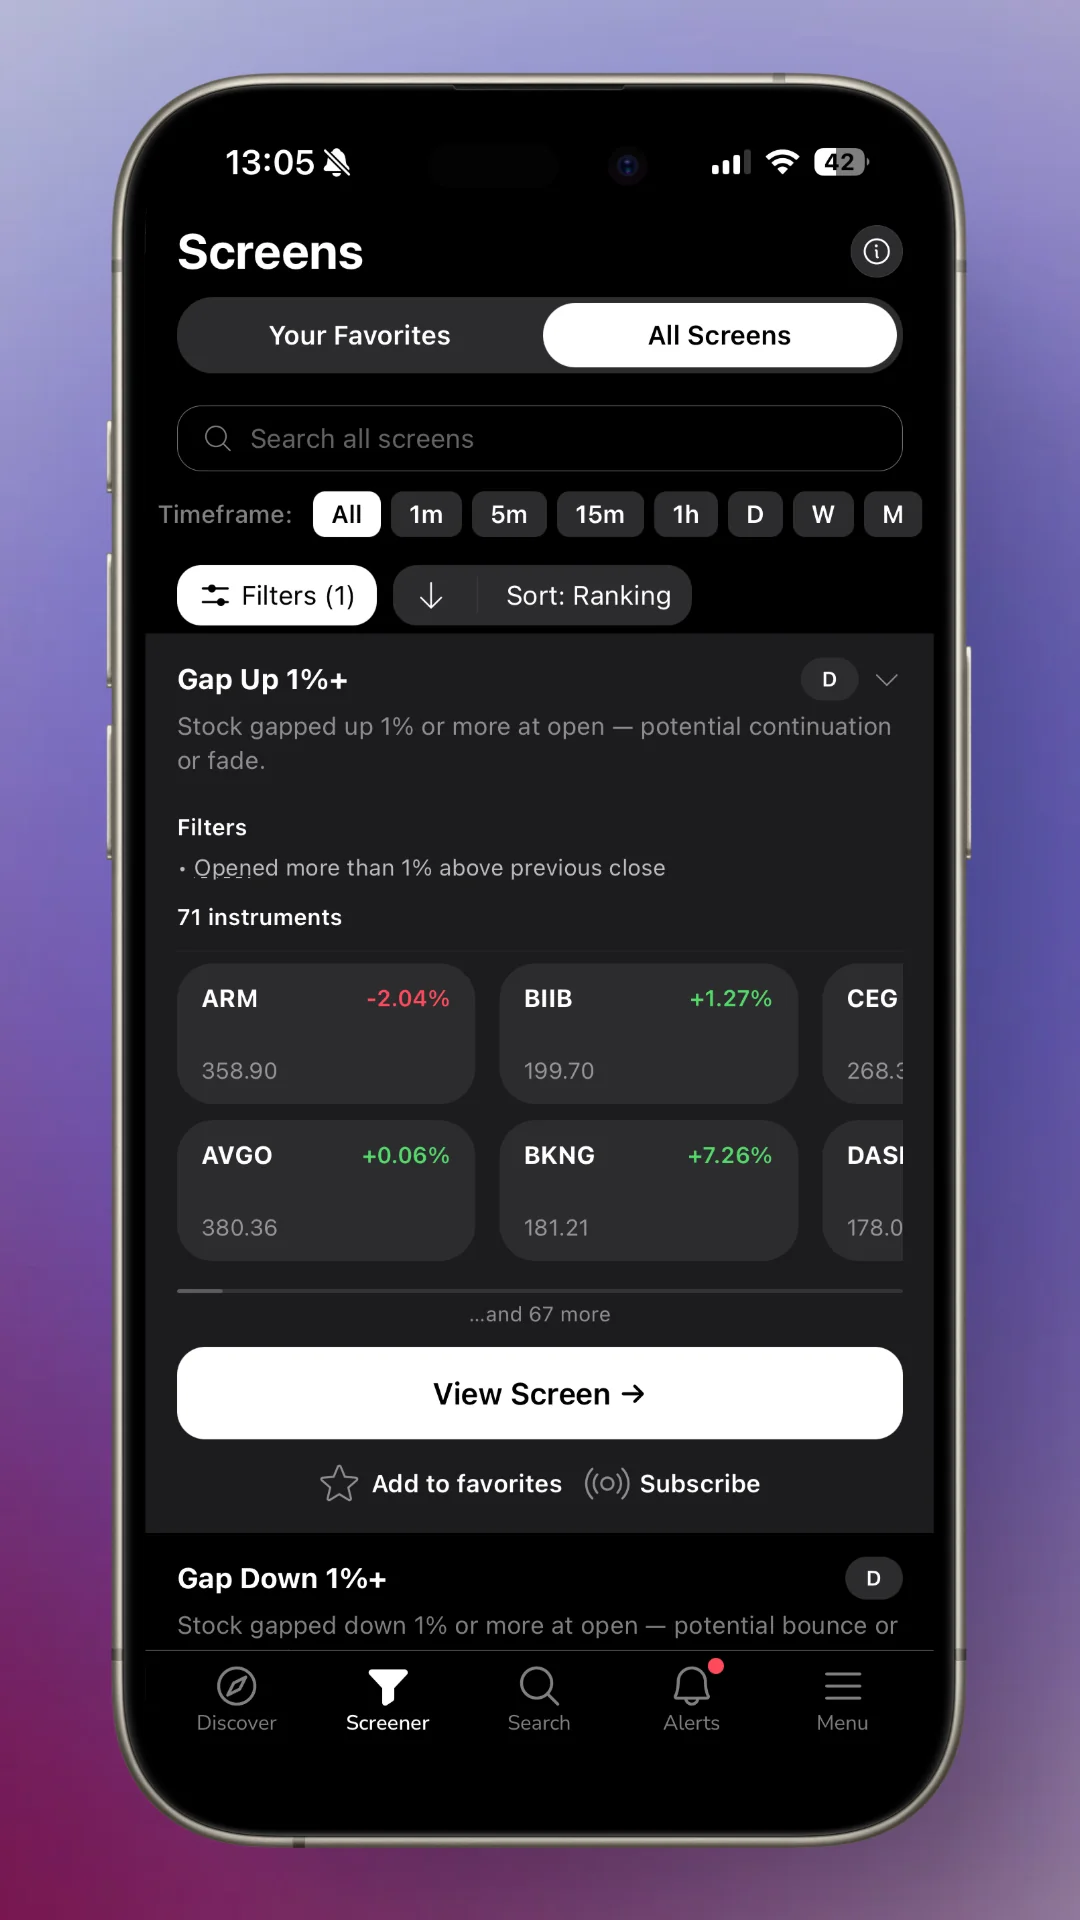
ChartMath brings gap setups to you already ranked, each one carrying the backtest of the screen that surfaced it: gap size, volume, VWAP position, win rate, average return. What you are reading is not a call. It is a rule on a fixed universe that you, or anyone else, can recompute. The research is the product. The feed is only how it reaches your phone.
The platform integrates with your existing charting tools, so when you identify a gap fill setup on your phone, you can quickly pull up the full chart on TradingView or your broker platform to execute the trade. Learn more about integrating alerts with your charting setup.
Gap Fill Trading Strategy Backtest Data and Win Rates
Theory is useful, but data drives decisions. Understanding the historical performance of gap fill strategies helps you set realistic expectations and size positions appropriately.
Historical Win Rates by Gap Type
The figures below are the ranges commonly reported in public gap research. They are not a ChartMath screen's track record. They're here to show you the shape of the edge, not to hand you a number to trust. A number you cannot recompute is worth nothing, so recompute these on a fixed universe of 500+ US equities before a dollar is at risk:
Exhaustion gaps (2-4% range, no catalyst):
- Win rate: 72-78%
- Average time to fill: 1.5 trading days
- Average return per trade: 1.8-2.4%
- Best timeframe: Intraday to 3-day holds
Common gaps (under 2%, no catalyst):
- Win rate: 80-85%
- Average time to fill: 0.8 trading days (often same day)
- Average return per trade: 0.9-1.3%
- Best timeframe: Intraday only
Catalyst-driven gaps (3-6% range, earnings/news):
- Win rate: 45-55%
- Average time to fill: 5-8 trading days (if they fill)
- Average return per trade: 2.5-4.0% (when they work)
- Best timeframe: Swing trades, 3-10 day holds
Breakaway gaps (over 6%, high volume):
- Win rate: 30-40%
- Average time to fill: 15+ trading days (many never fill)
- Average return per trade: Highly variable
- Best timeframe: Not recommended for gap fill strategy
Expected Returns and Hold Times
The most durable gap fill approach focuses on exhaustion and common gaps in the 2-4% range. These offer the best balance of win rate, return per trade, and time in position.
Work the arithmetic yourself before you trade it. A win rate means nothing without the average win, the average loss, and the number of trades behind it. Seven winners at 2.0% and three losers at 1.2% is a positive expectancy; the same seven winners against three losers at 4% is not. The expectancy is the figure that warrants attention, never the headline win rate, and expectancy is exactly what a backtest on a fixed universe of 500+ US equities gives you. A rule you can independently recompute is an auditable track record. Everything else is a hunch with a number stapled to it.
Drawdown Analysis and Risk Metrics
Even the best gap fill strategies experience losing streaks. Plan for them:
- Four or five consecutive losses will happen, and it does not mean the rule is broken
- Drawdowns are normal, not evidence of failure; size so you survive them
- Recovery takes time, which is precisely why position sizing exists
Position sizing is critical. Never risk more than 1-2% of your account on a single gap fill trade. This ensures that even a string of losses won't significantly damage your capital.
Performance Across Market Caps
Gap fill behavior varies by market capitalization:
Large caps ($10B+): Lower fill rate, but more reliable fills when they occur, and better liquidity for larger position sizes.
Mid caps ($2B-$10B): Often the sweet spot for gap fill trading, with good liquidity and reasonable volatility.
Small caps (under $2B): Gaps fill often, but slippage and overnight gap risk go up. Use smaller position sizes and verify volume before trading.
Most gap fill traders focus on mid-cap stocks with average daily volume over 1 million shares to ensure adequate liquidity for entries and exits.
Validating Strategies with Your Own Backtesting
While aggregate data is useful, your specific trading style, timeframes, and risk tolerance may produce different results. Running your own backtests helps you understand what works for your approach.
Key metrics to track in your backtesting:
- Win rate by gap size range
- Average return per trade by gap type
- Time to fill by market condition (trending vs. range-bound)
- Performance by time of entry (open vs. 10 AM vs. afternoon)
- Impact of VWAP confirmation on win rate
ChartMath shows the backtest for every screen: win rate, expected value, timeframe, and how many instruments matched. You can filter by timeframe, market cap, and date range to see how a rule behaved in conditions like today's. Run it on your own ticker, on your own timeframe, before you take the signal.
Common Gap Fill Trading Mistakes to Avoid
Even with a solid understanding of gap fill mechanics, traders make predictable mistakes that erode profitability. Avoid these common pitfalls:
Chasing Every Gap Without Context
The biggest mistake is treating all gaps equally. A 3% gap on earnings is fundamentally different from a 3% gap with no news. A gap after a 5-day winning streak is different from a gap after a consolidation.
Solution: Develop strict criteria for which gaps you'll trade. Focus on no-catalyst gaps in the 2-4% range with normal to low RVOL. Pass on everything else, even when FOMO tempts you.
Ignoring Volume Confirmation
Entering a gap fill trade without checking volume is like driving blindfolded. Volume tells you whether the gap has conviction or is likely to reverse.
Solution: Never enter a gap fill trade without confirming that volume supports your thesis. For gap ups you're fading, you want to see declining volume as price rises. For gap downs you're buying, you want to see volume increasing as price recovers.
Poor Position Sizing on Volatile Gaps
Larger gaps are more volatile, yet many traders use the same position size regardless of gap magnitude. A 7% gap requires a wider stop than a 2% gap, which means smaller position size to maintain the same dollar risk.
Solution: Scale your position size inversely to gap size and volatility. If you normally trade 100 shares on a 2% gap, trade only 50-60 shares on a 5% gap to account for the wider stop required.
Holding Through Gap Extensions
When a gap extends rather than fills, price continues in the gap direction, many traders hold hoping for an eventual reversal. This turns a small loss into a large one.
Solution: Honor your stops. If price extends the gap beyond your stop level, you're wrong about the fill. Exit immediately and look for the next setup. The market doesn't care about your entry price or your hope that it will reverse.
Not Adapting to Different Gap Types
Using the same entry and exit rules for exhaustion gaps and breakaway gaps is a recipe for inconsistent results. Each gap type requires different treatment.
Solution: Develop separate playbooks for different gap types. Exhaustion gaps get aggressive entries with tight stops. Catalyst-driven gaps get confirmation-based entries with wider stops. Breakaway gaps get avoided entirely for gap fill trades.
Gap Fill Trading Strategy: Your Next Steps
You now have a complete playbook for implementing a gap fill trading strategy, from identifying high-probability setups to executing trades with proper risk management. The difference between knowing these concepts and profiting from them comes down to consistent application and the right tools.
Building Your Gap Fill Routine
Start by establishing a daily routine:
- Pre-market (8:00-9:30 AM): Scan for gaps in the 2-4% range with no clear catalyst. Note RVOL and previous day's price action. Create a watchlist of 3-5 high-probability candidates.
- Market open (9:30-10:00 AM): Watch how your gap candidates behave in the first 30 minutes. Look for VWAP crosses and volume confirmation.
- Mid-morning (10:00-11:00 AM): Execute entries on setups showing clear reversal signals. This is your primary entry window.
- Midday (11:00 AM-2:00 PM): Monitor positions and adjust stops to breakeven once gaps are 50% filled.
- Afternoon (2:00-4:00 PM): Take profits on full or partial fills. Review what worked and what didn't.
That is two to three hours of screen time, most of it spent waiting rather than trading. If you hold a day job, you do not have those hours, and you shouldn't pretend you do. The alternative is to let the alerts do the waiting: set the criteria before the open, put the phone down, and look only when something actually triggers. The silence is the point.
Integrating Gap Fills Into Your Trading Workflow
Gap fill trading works best as part of a diversified approach, not as your only strategy. Combine it with other technical setups like breakouts, VWAP reclaims, and momentum plays.
On days when no high-probability gap setups appear, focus on your other strategies. Don't force gap fill trades just because you've decided to trade gaps today. The market doesn't care about your plans, it only offers what it offers.
Building an efficient trading workflow means having multiple strategies ready to deploy based on what the market is giving you each day.
Tracking and Journaling Gap Fill Trades
Keep a detailed journal of every gap fill trade:
- Gap size and type (exhaustion, breakaway, common)
- Catalyst present or absent
- Entry price and time
- Exit price and time
- Percentage of gap filled before exit
- What worked and what you'd do differently
After 20-30 trades, patterns will emerge. You'll discover which gap types you trade best, which timeframes suit your style, and which entry triggers produce the highest win rates for you specifically. This self-knowledge is invaluable for refining your approach.
Automate Gap Detection with ChartMath
Manual gap scanning works, but it's time-intensive and prone to human error. You might miss a setup because you were checking another stock, or enter too late because you didn't notice the VWAP cross.
ChartMath runs the gap discovery for you. The screens continuously scan a fixed universe of 500+ US equities for gap patterns across timeframes, filtering on the criteria that matter: gap size, volume characteristics, catalyst presence, and technical confirmation.
When a stock meets your gap fill criteria, say, a 3% gap with no news that just crossed back below VWAP, you get a push alert with the context attached: why it triggered, what the screen's backtest shows, and what the historical win rate and average return have been.
You still make the call. The scan narrows 500+ names down to a handful; the judgment about which one deserves your risk stays with you. That's the whole arrangement, and it's why you can run this from a phone without living inside a chart.
If you want the gap scan done before you wake up, watch the demo and see how the screens surface gap setups with their backtests attached. Or download the app and run the gap fill trading strategy on your own tickers. The web app runs the same 200+ screens, each one showing its record. No email needed to look.
The gap fill trading strategy is one of the better-documented mean-reversion patterns in US equities, but only if you can tell the fillable gaps from the ones that keep running. Stop refreshing lists by hand. Let the scan hand you the short list, and spend your judgment where it actually pays: deciding which ones you take.

See these setups live in ChartMath
200+ curated screens with backtest data. Free. No credit card required.