How to Scan for Stocks Before Market Open
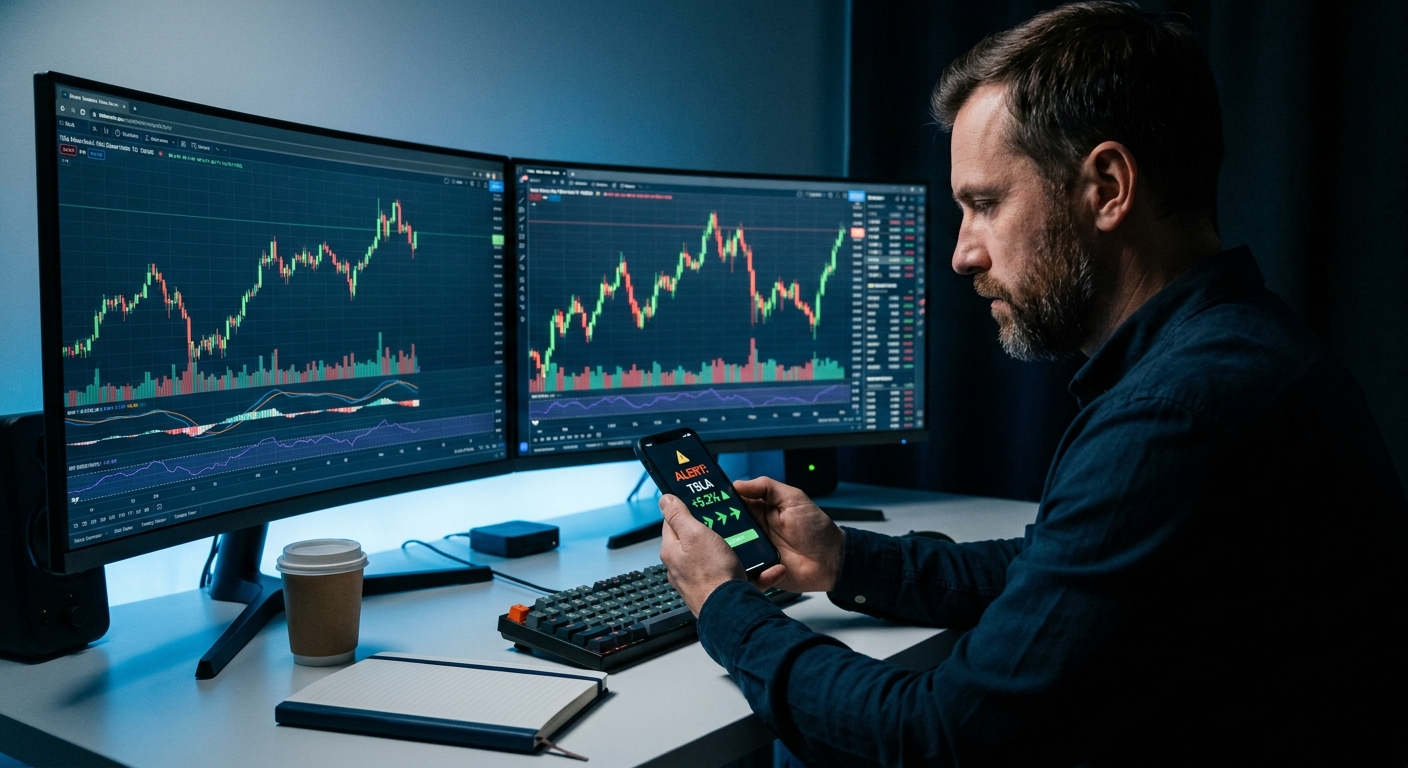
The opening bell rings at 9:30 AM Eastern. You have exactly zero names on your shortlist. So you do what most traders do: open Finviz, run a quick gap scan, scroll through 40 tickers, open 12 charts, and try to make a decision in the next 90 seconds. That is not a process. That is panic with a brokerage account.
A pre-market scanning routine fixes this. Done right, you wake up with 3 to 5 high-probability candidates already identified, each one backed by a backtested track record, so the opening bell is a moment of execution rather than a scramble for ideas. This guide walks through exactly how to build that routine, step by step.
Why Most Traders Start the Day Blind
Ask a retail trader how they find stocks to trade and the honest answer is usually some version of: Twitter, a Discord server, whatever gapped up on the news, or a screener they ran the night before and forgot to check again. None of those is a system. They are all reactive, and reactive trading is expensive.
The core problem is not effort. Most traders put in real time. The problem is that the tools they use do not connect the dots between "this stock looks interesting" and "this setup has historically worked." A static screener like Finviz will show you which stocks match a filter right now. It will not tell you whether that filter has produced profitable trades over the last 200 occurrences. That gap is where most pre-market routines fall apart.
The goal of a pre-market scan is not to find every interesting stock. It is to build a short, high-conviction list of names where a specific technical setup has a documented historical edge, so you are not making it up as you go. Three names with a clear setup beats twenty names with a vague feeling.
For a deeper look at how to structure the full trading day around a system like this, the guide on trading stocks without watching the screen all day covers the broader workflow.
1. Understand What a Pre-Market Scan Actually Does
A pre-market scan filters a universe of stocks against a set of technical criteria before 9:30 AM ET. The output is a list of tickers that currently match a defined setup, whether that is a gap above a prior resistance level, a relative volume spike, or a pattern like an opening range breakout forming on the 5-minute chart.
The critical distinction is between a snapshot and a backtested screen. A snapshot tells you what is happening right now. A backtested screen tells you what has historically happened after this condition appeared, expressed as a Win Rate and an Average Return across a meaningful sample of past occurrences. Those two numbers are what separate a setup from a guess.
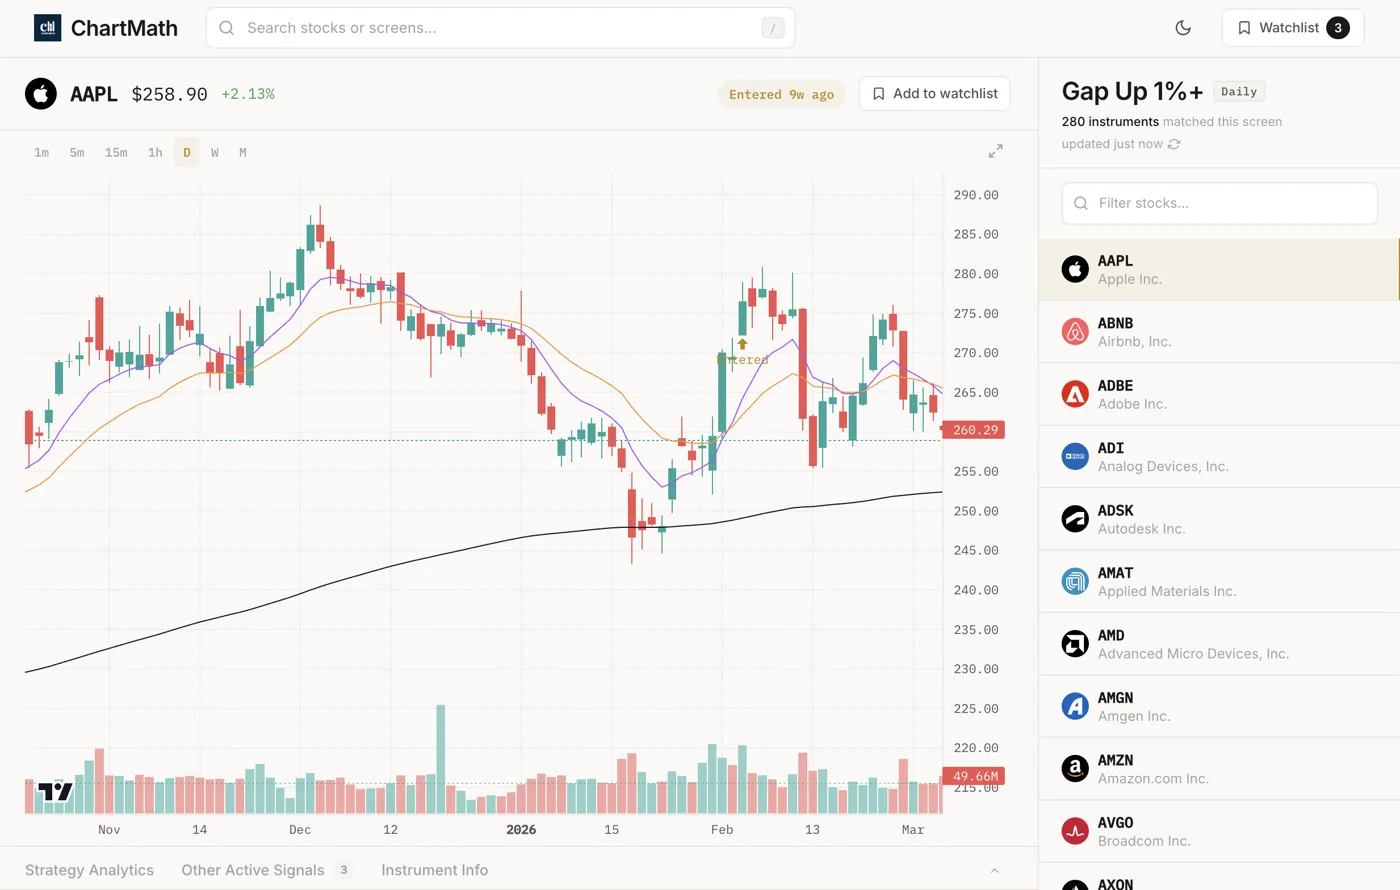
ChartMath is built around this distinction. It scans 500+ US equities, 100 crypto pairs, and 11 US futures across 200+ curated, read-only technical screens, across 7 timeframes from 1-minute to monthly. Every screen in the library has been backtested before it ships. The screen's filter rules are written in plain English so you can read exactly what condition triggered, and the backtested Win Rate and Average Return are shown on every card. No Pine Script. No coding. No screen builder required.
That matters for a pre-market routine because you are not building screens at 7 AM. You are consuming results from screens that have already been validated, and deciding which ones belong on your shortlist for the day.
2. Pick the Right Screens for Pre-Market Conditions
Not every screen in a 200+ library is relevant before the open. Pre-market conditions favor a specific set of setups: gap plays, momentum signals, breakout candidates, and VWAP-related setups that tend to resolve in the first hour of trading. Here is how to think about each category.
Gap Screens
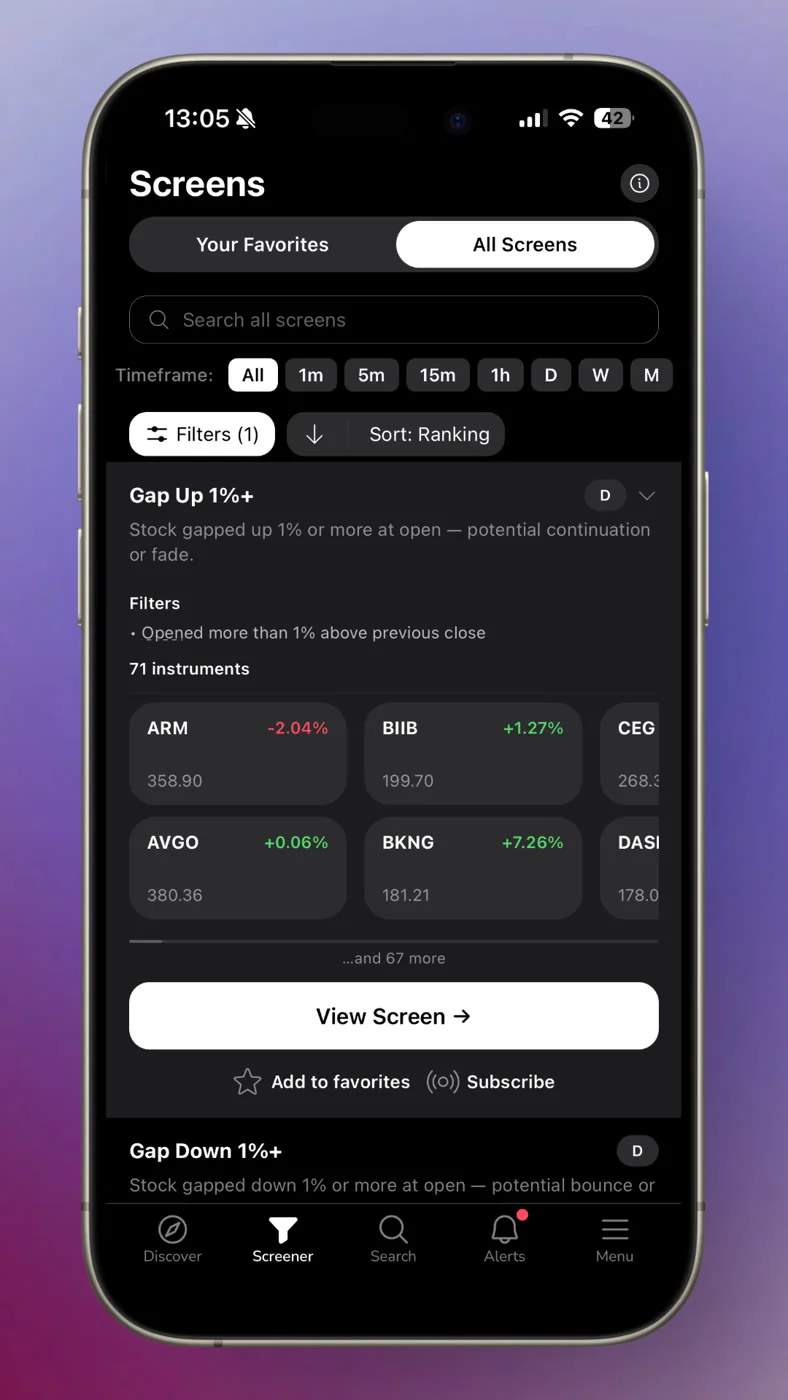
A gap screen identifies stocks that have opened significantly above or below their prior close, usually with volume confirmation. Pre-market gaps are meaningful when they occur at a technically significant level, such as a prior resistance zone or a 52-week high. A gap without volume is noise. A gap with elevated relative volume at a key level is a setup worth watching.
The relevant internal read on gap setups and how scanners surface them is covered in the post on premarket trading strategies for high-probability setups.
Relative Volume (RVOL) Screens
Relative volume compares a stock's current trading volume to its average volume over a defined lookback period. An RVOL of 2.0 means the stock is trading at twice its normal pace. Elevated RVOL before the open signals that institutional or informed money is moving, which tends to produce cleaner, more sustained moves. How to use RVOL and volume spikes goes deeper on interpreting these signals.
Breakout Screens
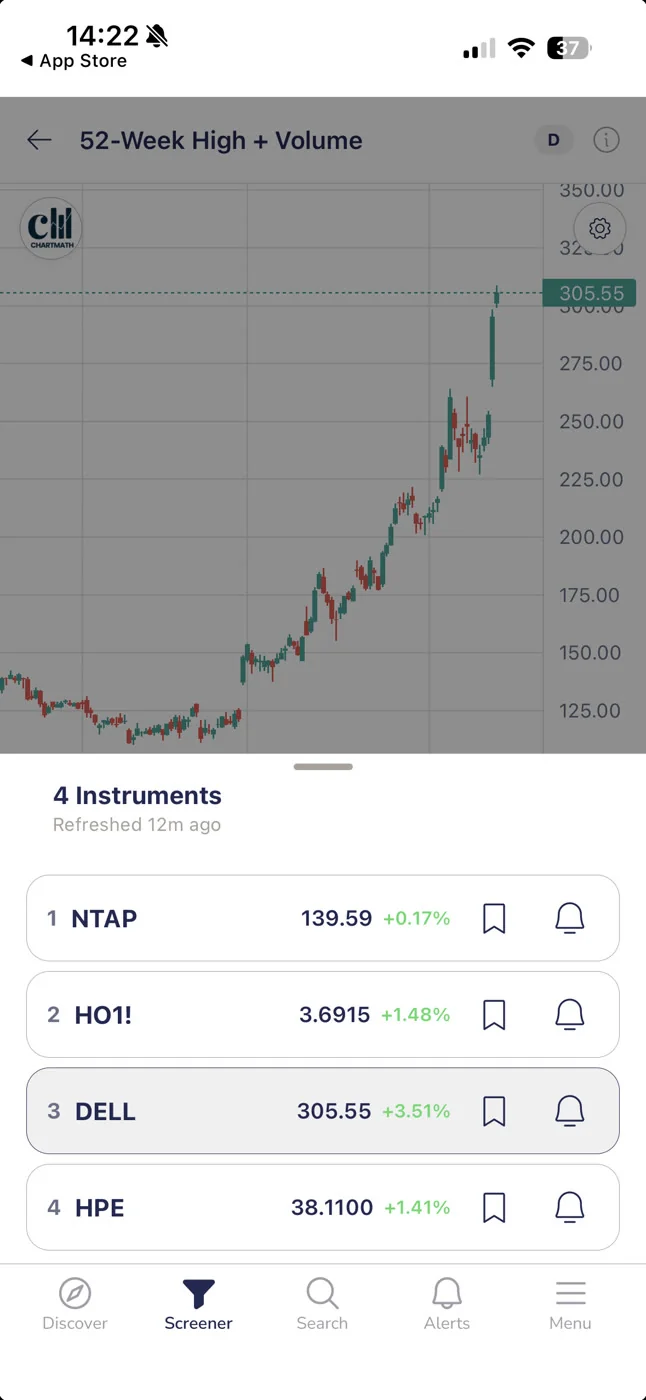
Breakout screens flag stocks approaching or clearing a significant technical level: a 52-week high, a multi-week consolidation range, or a prior pivot. The pre-market version of this scan identifies candidates that are setting up for a breakout at the open, not ones that have already moved 8% and are extended. Timing matters. A breakout screen run at 7 AM gives you time to verify the setup and set your entry parameters before the bell.
VWAP Reclaim Screens
VWAP (Volume Weighted Average Price) is one of the most widely watched intraday levels. A stock that gaps down below VWAP and then reclaims it during the first 30 minutes of trading is a classic high-probability setup for intraday traders. Running a VWAP reclaim screen pre-market helps you identify which stocks are positioned for this pattern based on where they are trading relative to the prior session's VWAP. The full breakdown of this setup is in the guide on VWAP trading and how to use volume weighted average price.
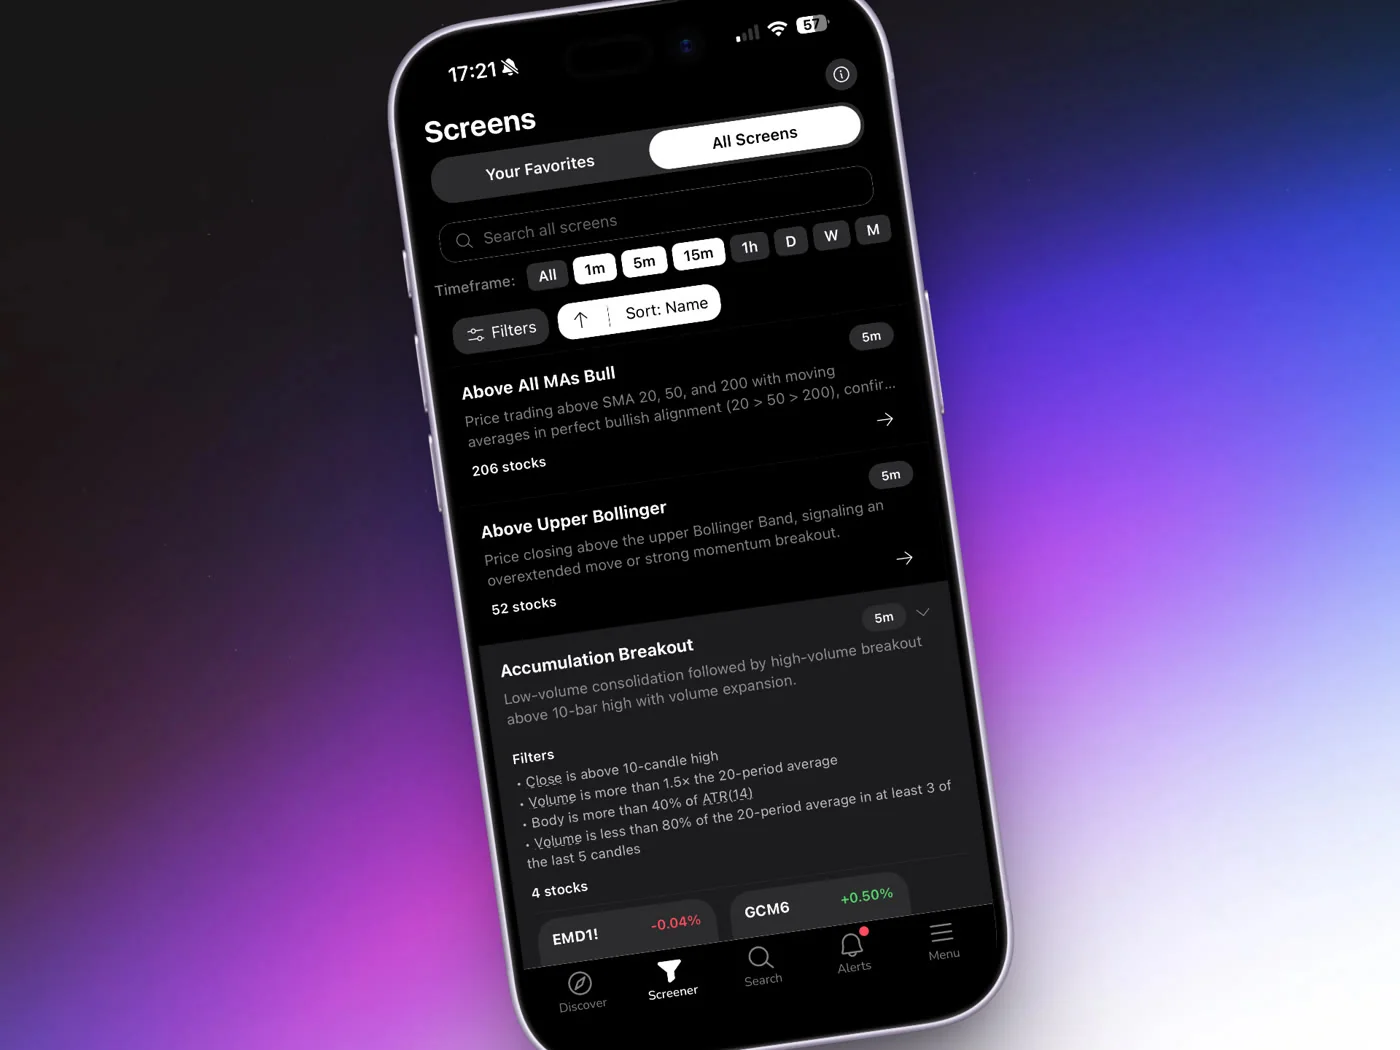
How to Browse ChartMath's Screen Library
In ChartMath, the Screener tab gives you the full 200+ screen catalog. Each screen shows its name, a plain-English description of the filter rules, and the backtested Win Rate and Average Return for that setup across the covered universe. You can open any screen to see which tickers currently match it. For pre-market prep, focus on screens in the gap, momentum, breakout, and VWAP categories. Favorite the ones most relevant to your style so they surface first in your Discover feed.
3. Set Up Alerts So the Scan Runs Without You
The most underused part of any pre-market routine is the alert layer. Most traders check their screener manually, which means they only see setups when they are actively looking. An alert-driven routine means the scan runs continuously, and you get notified the moment a ticker enters a screen you care about, whether that is at 4 AM, 7 AM, or 10:43 AM when you are in a meeting.
In ChartMath, screen-enter alerts work like this: you favorite a screen, and from that point on, any time a ticker in the covered universe enters that screen, you get a push notification. The alert payload includes the ticker symbol, the timeframe, the screen name, and a timestamp. You do not need to be watching the app. The scan runs in the background and surfaces the result to your phone.
Alert Hygiene Matters
One of the fastest ways to destroy a pre-market routine is alert fatigue. If your phone buzzes 40 times before 9 AM, you will start ignoring all of it, including the signals that matter. ChartMath handles this with built-in de-duplication, throttling, a per-bar cap, and timezone-aware quiet hours. You get notified about meaningful new entries, not the same ticker firing on the same screen every five minutes.
Alerts are delivered via push notification and in-app only. There is no SMS. This keeps the signal clean and the delivery reliable on mobile.
For a full walkthrough of how to configure alerts without creating noise, the post on integrating trading alerts with your charting platform covers the setup in detail.
4. Build Your Pre-Market Shortlist in Under 10 Minutes
The Discover feed in ChartMath is the fastest way to build a pre-market shortlist. It surfaces a swipe-based feed of setup cards, each showing a ticker, the screen it matched, the timeframe, and the backtested Win Rate and Average Return for that screen. The feed is ranked by backtested reliability and recency, so the freshest, highest-quality setups appear first.
Here is a practical 10-minute pre-market workflow using ChartMath:
- Open the Discover feed and filter by the timeframes relevant to your style. For swing setups, use Daily or Weekly. For intraday plays, use 5m, 15m, or 1h.
- Swipe through the top cards and look for tickers where the screen's Win Rate and Average Return meet your minimum threshold. You are not looking for perfection. You are looking for documented edge.
- Check the screen's filter rules for each candidate. The plain-English description tells you exactly what condition triggered. If the condition makes sense given current market context, it stays on the list. If it does not, skip it.
- Add your top 3 to 5 names to your watchlist using the Search tab. ChartMath gives you one watchlist, synced across your iOS and Android devices, so your shortlist is available wherever you are during the session.
- Stop at 5 names. More than that and you are not building a shortlist, you are building a distraction list.
The goal of this step is not to make a trading decision. It is to identify which names deserve a closer look before the open. The decision comes in the next step.
5. Verify the Setup Before the Bell Rings
ChartMath is a copilot, not autopilot. It surfaces the setup and shows you the historical track record. You make the call. That means before you commit to watching a name at the open, you should spend two to three minutes verifying the setup on your charting platform.
Here is what to check during verification:
- Chart structure: Does the chart look clean? Is the setup forming at a logical level, or is it in the middle of a messy range?
- Timeframe confluence: Does the daily chart and the 1-hour chart agree? A setup that looks strong on the 5-minute but is fighting a daily downtrend is a lower-conviction trade.
- Relative volume: Is pre-market volume elevated relative to the 20-day average? A breakout on low volume is a warning sign.
- Key levels: Where is the nearest support and resistance? Can you define a clean entry, stop, and target before the open?
If you cannot answer all four of those questions in two minutes, the setup is not ready. Move to the next name on your shortlist. The point of pre-market prep is to arrive at 9:30 AM with a plan, not a list of things to figure out under pressure.
For a structured approach to multi-timeframe confirmation, the guide on daily chart swing trade setups and scanner workflow is worth reading alongside this one.
6. Execute the Routine: A Sample Pre-Market Checklist
Routines only work when they are specific. Here is a time-blocked pre-market checklist built around ChartMath's alert and discovery workflow. Adjust the times to fit your schedule, but keep the structure.
Before 7:00 AM ET: Review Overnight Alerts
Check your push notifications from ChartMath. Any screen-enter alerts that fired overnight or in pre-market hours are your first candidates. These are tickers that entered a backtested screen while you were asleep. You did not have to scan for them. The app did it for you.
7:00 to 8:30 AM ET: Build the Shortlist
Open the Discover feed. Filter by your preferred timeframes. Swipe through the top cards, check Win Rate and Average Return, read the screen's filter rules, and add your top 3 to 5 names to your watchlist. This should take 10 minutes or less if you have your screens favorited and your timeframe filters set.
8:30 to 9:15 AM ET: Verify on Your Charting Platform
Pull up each shortlist name on TradingView or whichever charting tool you use. Check chart structure, timeframe confluence, and relative volume. For each name, define your entry trigger, stop level, and target. Write them down or set conditional alerts in your brokerage. Do not leave this step to memory.
9:15 to 9:30 AM ET: Final Prep
Confirm your position sizing for each trade. Review your shortlist one more time. Set any additional alerts for entry triggers. Close the tabs you do not need. You should be watching no more than 3 to 5 names at the open, each with a defined plan.
9:30 AM ET: Market Opens
You already know what you are watching and why. You have a backtested reason for each name on your list. You have defined entries, stops, and targets. The opening bell is not a starting gun for research. It is the moment you execute a plan you already built.
Common Pre-Market Scanning Mistakes to Avoid
Even with the right tools, a few recurring mistakes can undermine a pre-market routine. Here are the ones that show up most often.
Scanning Too Many Names
A shortlist of 20 stocks is not a shortlist. It is a full-time job. The cognitive load of tracking 20 names during a live session leads to missed entries, late exits, and decision paralysis. Force yourself to a maximum of 5 names. If you cannot narrow it down, use the backtested Win Rate and Average Return to rank them and cut the bottom half.
Ignoring the Backtested Track Record
A setup that looks clean on the chart is not the same as a setup with a documented edge. Visual pattern recognition is subjective and prone to recency bias. A screen with a verified Win Rate and Average Return across a meaningful sample size gives you an objective baseline. Use it. The post on how to build winning backtesting strategies explains why this matters in more depth.
Chasing Gap-Up Stocks Without Volume Confirmation
A stock that gaps up 5% on news is exciting. It is also often already extended by the time you see it. The pre-market scan is not about finding the biggest movers. It is about finding stocks where a specific technical condition has formed at a level where the historical data supports a trade. Gap plus volume plus a defined setup is a candidate. Gap alone is not.
Using Unvalidated Signal Groups
Discord and Telegram signal groups post tickers with entry prices and targets. What they do not post is the full track record: every call, every loss, every setup that did not work. A screen with a documented Win Rate and Average Return is not the same as a call from someone with a highlight reel. The difference matters when you are risking real capital.
Not Setting Alerts
If your pre-market routine depends on you manually checking a screener at 7 AM every day, it will break the first time you have an early meeting. Alerts are the infrastructure that makes a routine durable. Favorite your screens in ChartMath, let the push notifications do the scanning, and use your morning time for verification and decision-making rather than discovery.
The Pre-Market Routine in Practice
The traders who consistently show up to the open with a plan are not spending more time on research. They are spending their time better. A pre-market routine built around backtested screens and push alerts compresses two hours of manual scanning into 10 minutes of focused review, because the discovery layer runs continuously in the background.
ChartMath starts with a 14-day free trial, no card to start, then $24.99/mo founding pricing (locked for 12 months) or $149/yr. The full screen library is browsable at chartmath.com/screens without signing in, so you can see exactly which screens are available before you download anything. When you are ready to set up alerts and build your pre-market shortlist on mobile, the app is available at chartmath.com/app for iOS and Android.
The opening bell does not have to be a scramble. Build the shortlist the night before, let the alerts run overnight, and spend your morning verifying rather than discovering. That is the difference between a trader with a process and one who is still refreshing Finviz at 9:28 AM.

Ankush Jindal
LinkedInSee these setups live in ChartMath
200+ curated screens with backtest data. 14-day free trial.