Two NVDA screens, one decision: how to read a backtest before you size it
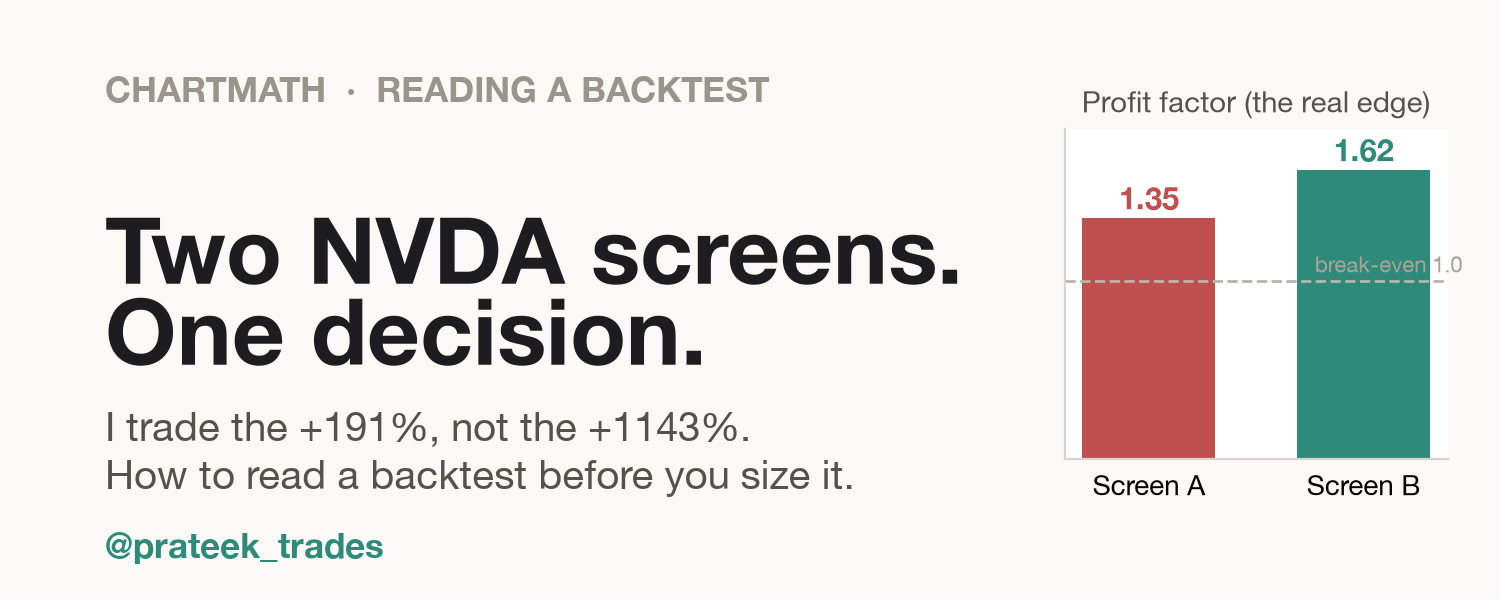
Two of my screens are long NVDA on the 1-hour chart right now, each with three years of backtest behind it. One shows +1143%. The other shows +191%. I am taking the +191%. A few years ago I would have grabbed the other one, and a number like that +1143% once walked me into a 47% drawdown before I closed it red. So here is the read I run before I size anything.
Same ticker, same timeframe, same direction, one three-year window. Here is what each rule actually checks:
- Screen A, Strong Intraday Uptrend (1H, long): price above VWAP, the 9 EMA over the 20 EMA, volume above its 20-bar average. Momentum with volume behind it. +1143% net, n=238.
- Screen B, Above All MAs Bull (1H, long): price above the 20, 50, and 200 SMAs, stacked 20 over 50 over 200. A confirmed uptrend. +191% net, n=501.
Pick which one you would take, then watch me get to the other answer.
| Screen A Strong Intraday Uptrend, 1H long | Screen B Above All MAs Bull, 1H long | |
|---|---|---|
| Net return | +1143% ✓ | +191% |
| Win rate | 59.7% ✓ | 56.5% |
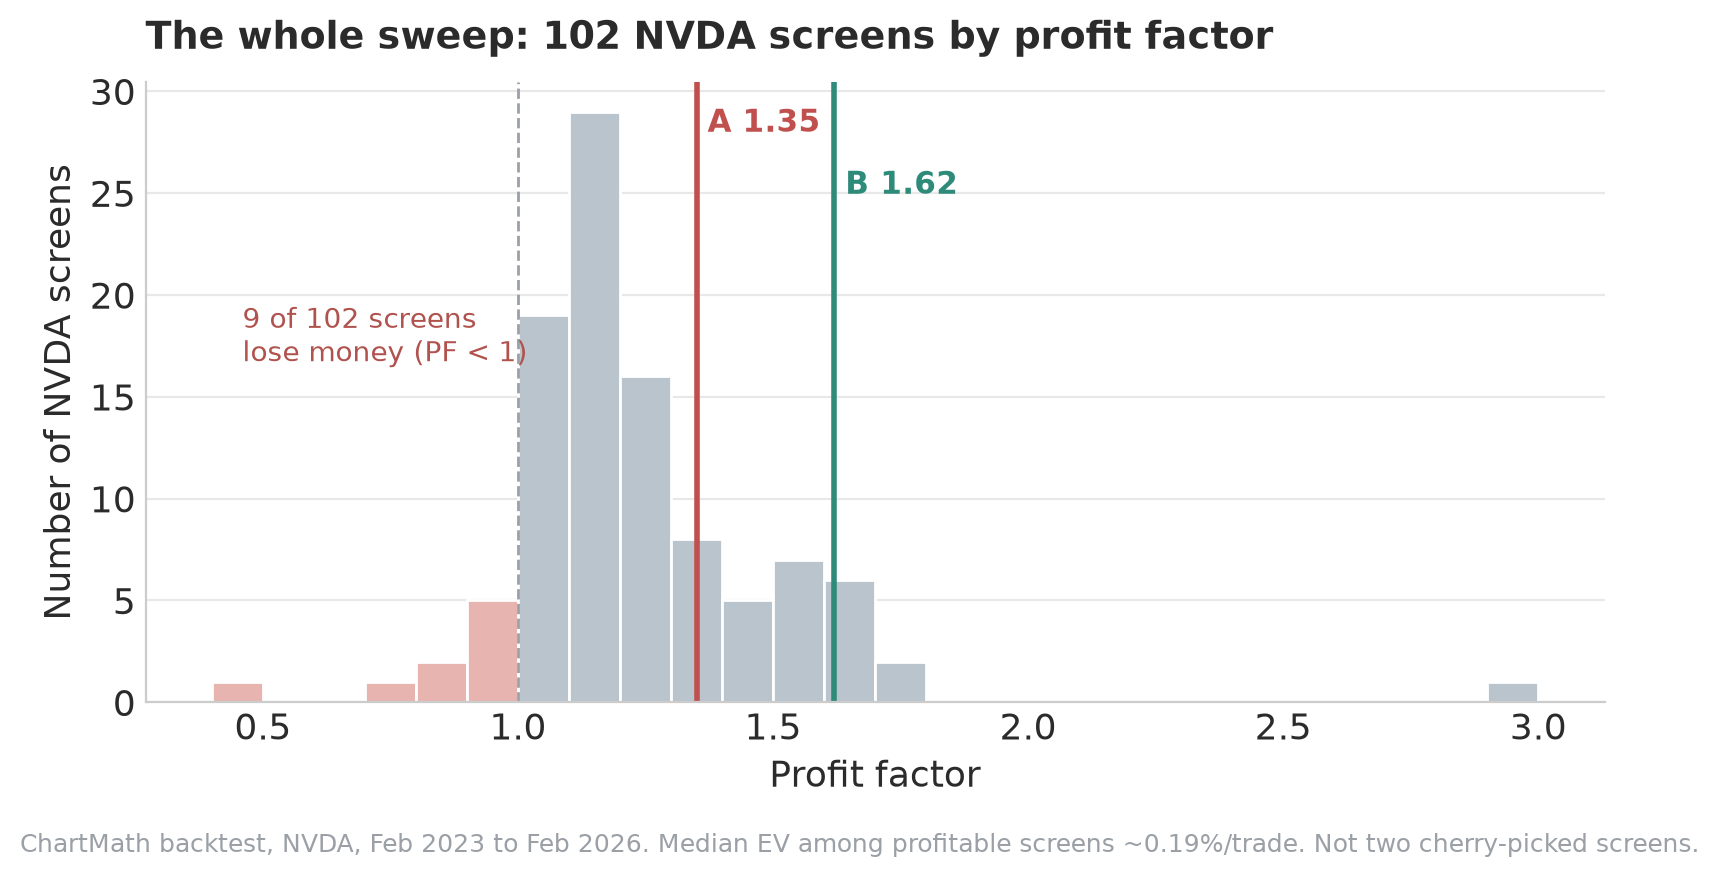
| Profit factor (the edge) | 1.35 | 1.62 ✓ |
| Sample size (n) | 238 | 501 ✓ |
| EV per trade | 1.224% ✓ | 0.221% |
| Avg hold per trade | 141h | 16h |
| Return per day held | 0.21% | 0.33% ✓ |
| Max drawdown | -47.3% | -11.2% ✓ |
| Risk per trade | 5% | 2% ✓ |
One thing the names hide: a screen is only the entry. The numbers above also bake in an exit. Screen A takes a one-to-one, a 5% stop and a 5% target. Screen B risks 2% and lets winners run, a target five times the stop, with a trailing stop. Part of why B reads better below is that exit, not just the entry.
A number that lies more often than it should
A third NVDA screen, Prior Day High Breakout, daily, long, wins 52.1% of the time on n=71. Right more than half the time. It also carries a profit factor of 0.85 and a net return of negative 9.4%. It wins most of its trades and still loses money, because the losers are bigger. Win rate tells you how often you are right. It says nothing about how much you make when right, or give back when wrong.
The gut answer is the net-return answer
The 6x gap pulls almost every eye to A. Here is the trap. Net return is a cumulative, compounded outcome. It grows with how often a screen fires and how big each bet is. Screen A actually fired fewer times than B, 238 against 501, yet it bets more than twice as hard, 5% per trade against 2%. A's headline is the size of the bet, not a better edge. It is the one number you must never use to rank two screens against each other. Set it aside and find the stat that isolates the edge.
Profit factor is the edge
Profit factor is gross profit divided by gross loss. Above 1 makes money, below 1 bleeds, around 1 is a coin flip. Dollars won per dollar lost, stripped of how often you traded or how much you bet. Screen B sits at 1.62. Screen A sits at 1.35. The screen with the smaller net return has the bigger edge per dollar risked. Across all 102 backtested NVDA screens, 9 actually lose money with a profit factor under 1, so a reading above 1 is earned, not assumed. Compare profit factor, never net return.
Is the edge real, or a lucky streak?
Sample size settles that. Screen A fired 238 times. Screen B fired 501. A fat profit factor on a thin sample is noisier than a steady one on a deep sample. B wins this axis too.
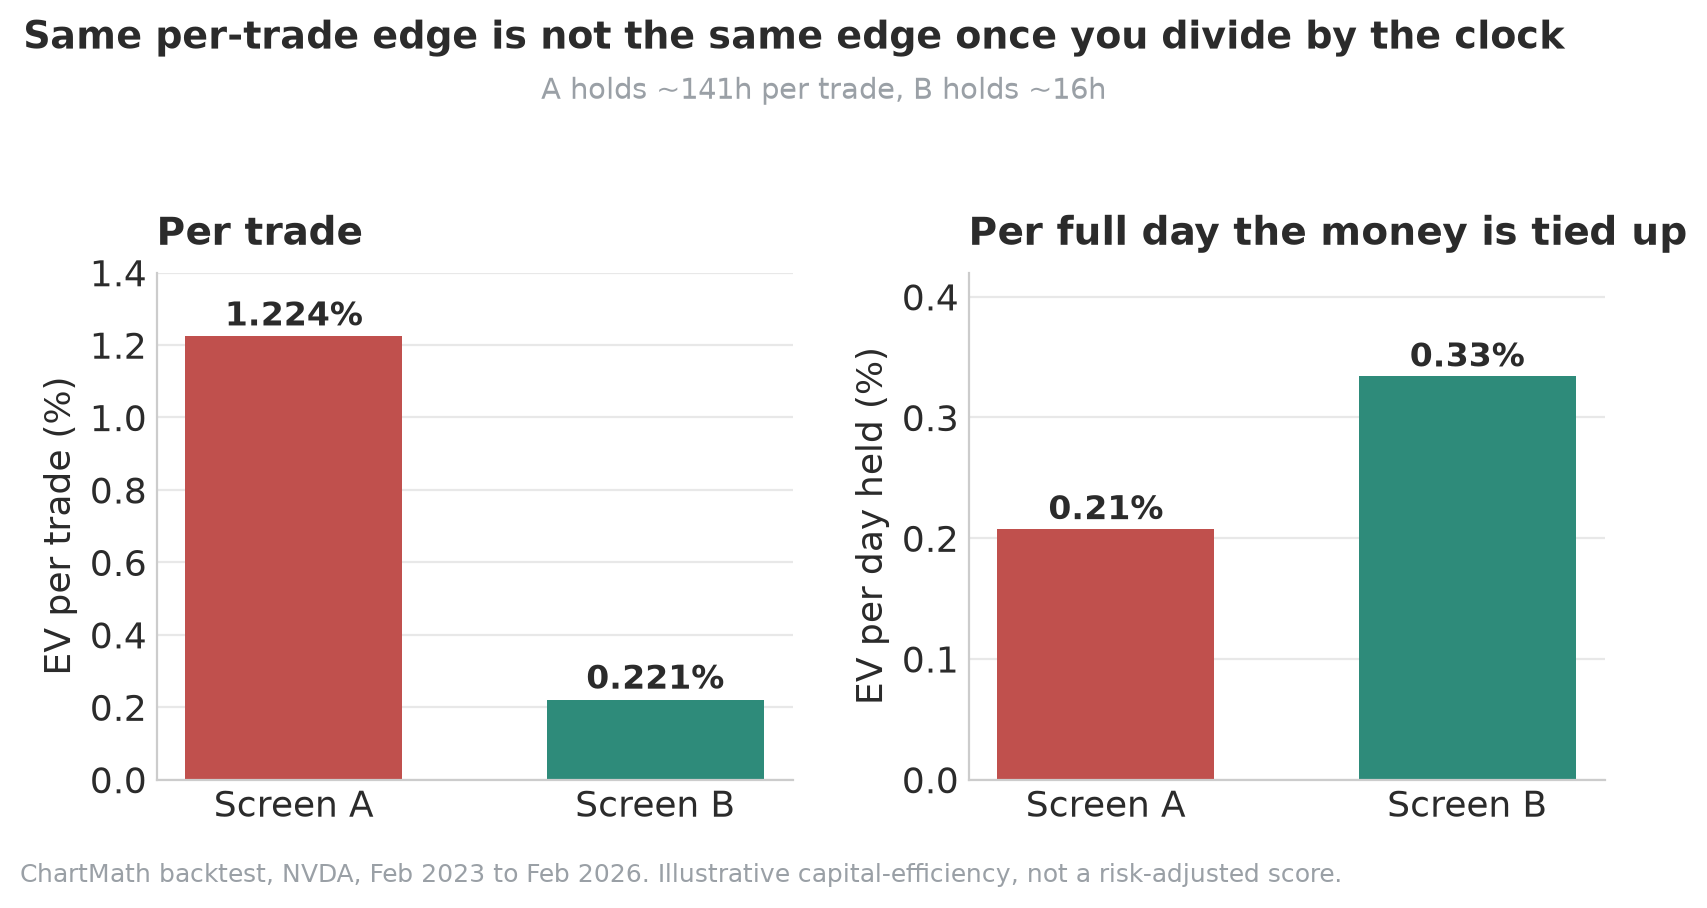
The stat that only means something next to the clock
Expected value per trade is where A finally looks alive. A earns 1.224% per trade. B earns 0.221%. A looks roughly 5x better, and you would expect it to win something here. Then you divide by the clock. EV per trade hides how long your money was tied up earning it. Screen A holds about 141 hours per trade on average (median 117). Screen B holds about 16 hours (median 3). Normalize to return earned per full day your capital is locked in, and A makes roughly 0.21% per day held while B makes roughly 0.33%. The quiet screen is the more efficient use of capital. This is an illustrative read, not a risk-adjusted score, but the direction flips.
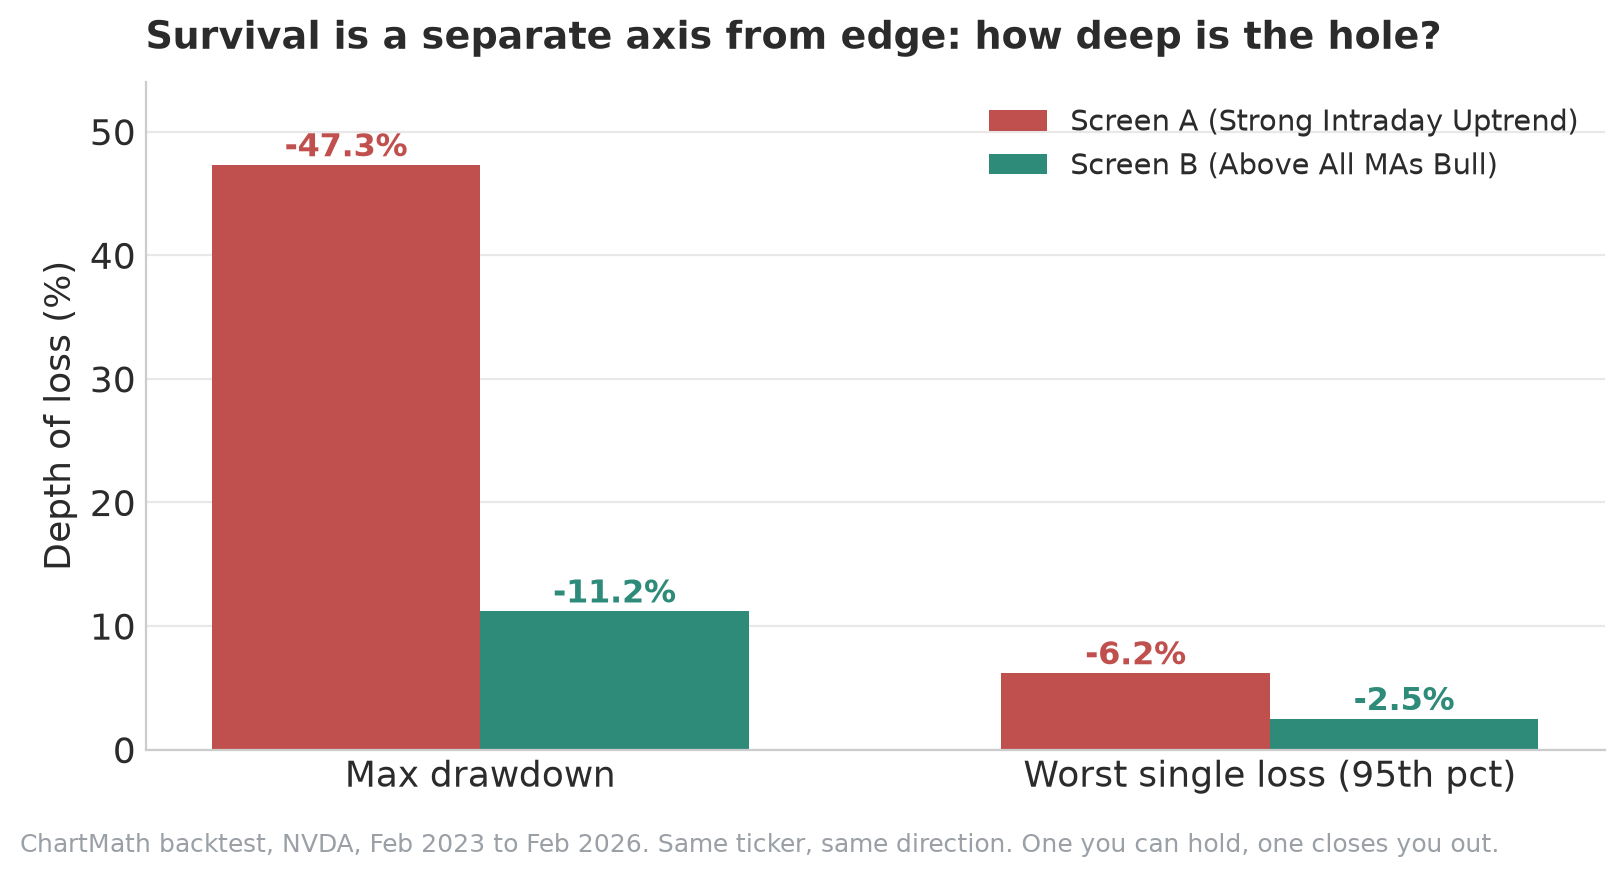
Survival is a separate axis from edge
Screen A's worst peak-to-trough was negative 47.3%. Screen B's was negative 11.2%. Worst single loss at the 95th percentile, 6.2% for A versus 2.5% for B. This axis is independent of the edge. A screen can have a fine profit factor and still hand you a drawdown you panic-close at the bottom. A backtest you cannot psychologically hold is a backtest you will not actually trade.
So which one
Screen B, Above All MAs Bull, 1H long. Bigger edge (1.62 versus 1.35), deeper sample (501 versus 238), more efficient per day held (0.33 versus 0.21), a quarter of the drawdown (negative 11.2 versus negative 47.3). Its per-trade EV is small, 0.221%; it earns by firing often and staying calm, not by any heroic trade. Screen A is not a bad screen. It is a leveraged one, and that +1143% is a story about 5%-per-trade sizing, not about being smarter.
That is the kind of entry a screener is supposed to surface, the rare one with a reason to fire, and then leave you alone. Depth over volume, not another alert.
The read, in order: win rate is checked by profit factor, profit factor by sample size, EV per trade by hold time, net return by risk and frequency, and all of them by max drawdown. Every number here came from one fixed rule on one fixed universe, recomputed, 102 screens swept, 9 of them losers. That is the whole difference between a screen and a screenshot a guru posts.
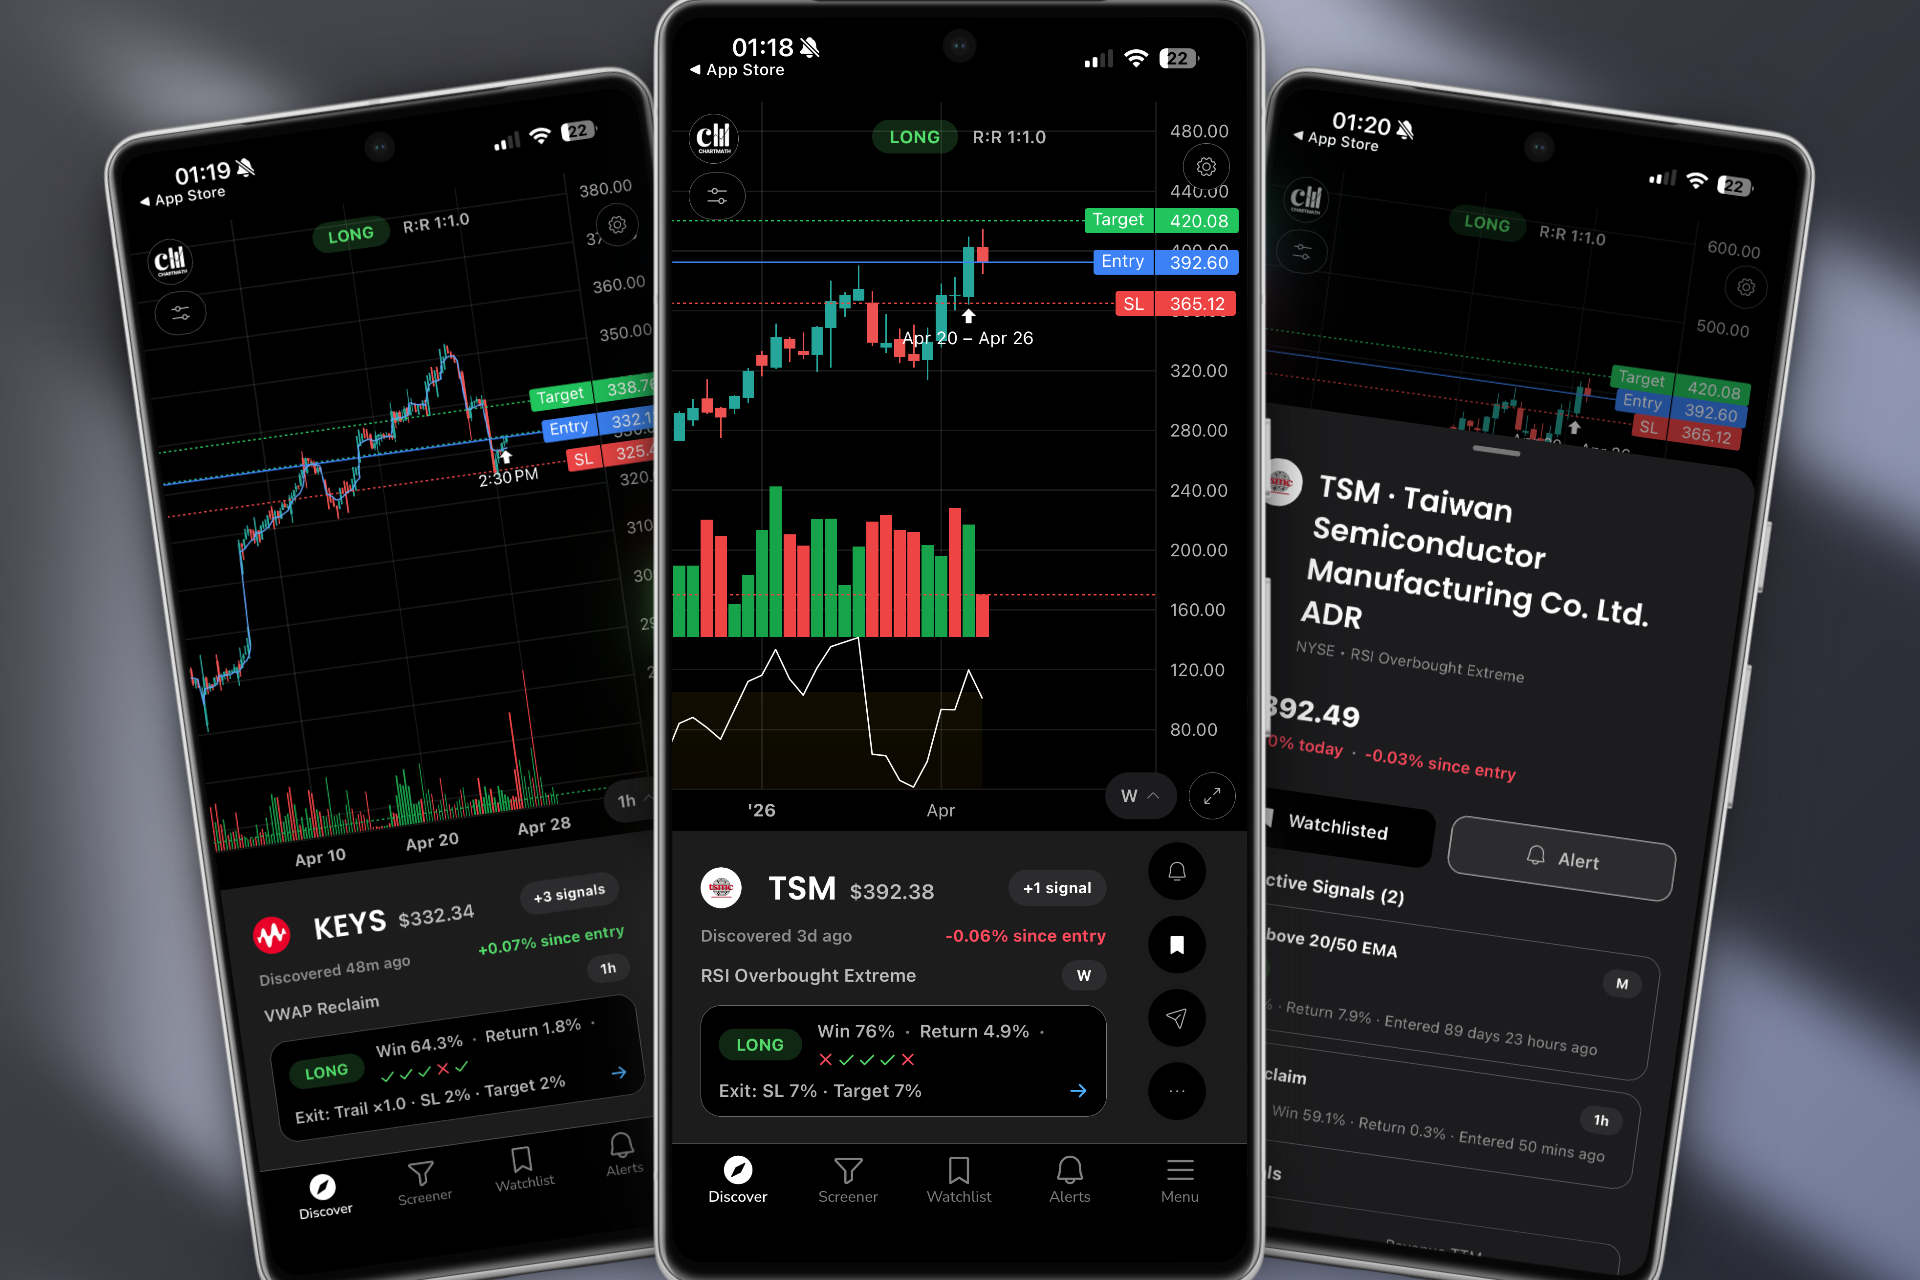
I am a US swing trader with a day job, and I am building ChartMath, a research company that backtests screens so the track record is verifiable instead of cherry-picked. We give away the method on purpose. Follow for the series where we read these one screen at a time.

See these setups live in ChartMath
200+ curated screens with backtest data. 14-day free trial.