Multi-Timeframe Swing Trade Setup Confirmation Guide
It's 4:07pm. You're looking at the trade you closed an hour ago, a clean pullback to the 20-day moving average with textbook volume, and it still lost money. The setup wasn't fake. You just never checked the weekly chart, where the stock had been grinding lower for six weeks straight. Multi-timeframe confirmation of a swing trade setup exists for exactly this reason: one chart never tells the whole story, and stacking three timeframes, weekly for trend, daily for setup, and 1-hour for entry timing, catches the conflicts a single chart hides.
Key Takeaways
- Three timeframes, three jobs: the higher timeframe (weekly or daily) sets the trend, the trading timeframe (daily or 4h) confirms the setup, and the lower timeframe (15m or 1h) times the entry. Mixing up these jobs is how setups fail.
- Alignment beats prediction: a trade where all three timeframes agree has a defined structure you can test and repeat. A trade where only one timeframe looks good is a guess dressed up as a setup.
- Conflict means stand down: when the weekly trend and the daily setup disagree, the correct action is no action. Standing down is a decision, not a missed opportunity.
- Confirmation takes under 5 minutes per alert: a fixed checklist, three charts, three questions, is enough to validate or reject a scanner alert without opening ten tabs.
- A scanner can pre-align the timeframes for you: tools that screen the same ticker across multiple timeframes at once cut the manual chart-flipping that eats up a lunch break.
Multi-Timeframe Confirmation at a Glance
| Timeframe | Job | What you're checking | Time needed |
|---|---|---|---|
| Weekly | Trend context | Higher highs/higher lows, position vs 20/50-week MA | ~1 minute |
| Daily | Setup confirmation | Pullback, base, or reclaim matching a defined rule | ~2 minutes |
| 4-hour | Setup confirmation (alt.) | Same as daily, used for shorter swing holds | ~1 minute |
| 1-hour | Entry timing | Volume confirmation, candle close through a trigger level | ~1 minute |
| 15-minute | Entry timing (fine) | Tighter trigger for traders who want precision, not a scalp | ~1 minute |
| All three combined | Go / no-go decision | Do all timeframes agree, or does one contradict the others | Under 5 minutes total |
Why One Chart Never Tells the Whole Story
Say you're holding positions for days to weeks, not minutes. You can't watch a 5-minute chart all afternoon, and you shouldn't want to. But a single daily chart, checked in isolation, has a blind spot: it can't tell you if the move you're seeing is a genuine trend continuation or a bounce inside a bigger downtrend. That distinction is the entire game.
A stock can print a beautiful bull flag on the daily chart while the weekly chart shows the same stock rolling over under its 50-week moving average. Traders who only look at the daily chart take the flag breakout and get run over a week later when the larger downtrend reasserts itself. Traders who only look at the weekly chart miss the precision needed to time an entry without giving back a chunk of the move to a bad fill.
The fix is a three-timeframe stack. Each timeframe answers one question, and only one. The weekly (or daily, for shorter holds) answers "what's the trend." The daily (or 4-hour) answers "is there a valid setup." The 1-hour (or 15-minute) answers "is now the moment." Keep those jobs separate and you stop making decisions on the wrong chart.
1. Set the Trend on the Higher Timeframe
Start with the weekly chart if you're holding for two to six weeks. Use the daily chart as your "higher timeframe" if you're holding for three to ten days. The rule doesn't change, only the zoom level does.
- Check the structure: are you seeing higher highs and higher lows (uptrend), lower highs and lower lows (downtrend), or a sideways range? Only trade in the direction of a clear structure.
- Check position relative to the moving average: price holding above the 20-week or 50-week moving average supports an uptrend read. Price stuck below it is a warning sign, even if the daily chart looks bullish.
- Check for a recent trend change: a stock that just broke a multi-month downtrend needs more confirmation than one that's been trending for months. Early trend changes carry more risk of failure.
This step takes about a minute per ticker. Its only job is to answer one question: is the wind at your back or in your face? Everything after this step is refinement, not a redo of this decision.
2. Confirm the Setup on the Trading Timeframe
Once the higher timeframe gives you a direction, move to the daily or 4-hour chart to find the actual setup. This is where most of the technical analysis conversation happens: pullbacks to a moving average, VWAP reclaims, base breakouts, RSI oversold bounces inside an uptrend.
The rule here is strict: the setup has to match a defined, repeatable pattern, not a feeling that "this looks like it's about to go." If you can't describe the setup as a rule someone else could follow (price closes above the 20-day MA after touching it three times, or price reclaims VWAP on rising volume), you don't have a setup. You have a hunch with a chart attached.
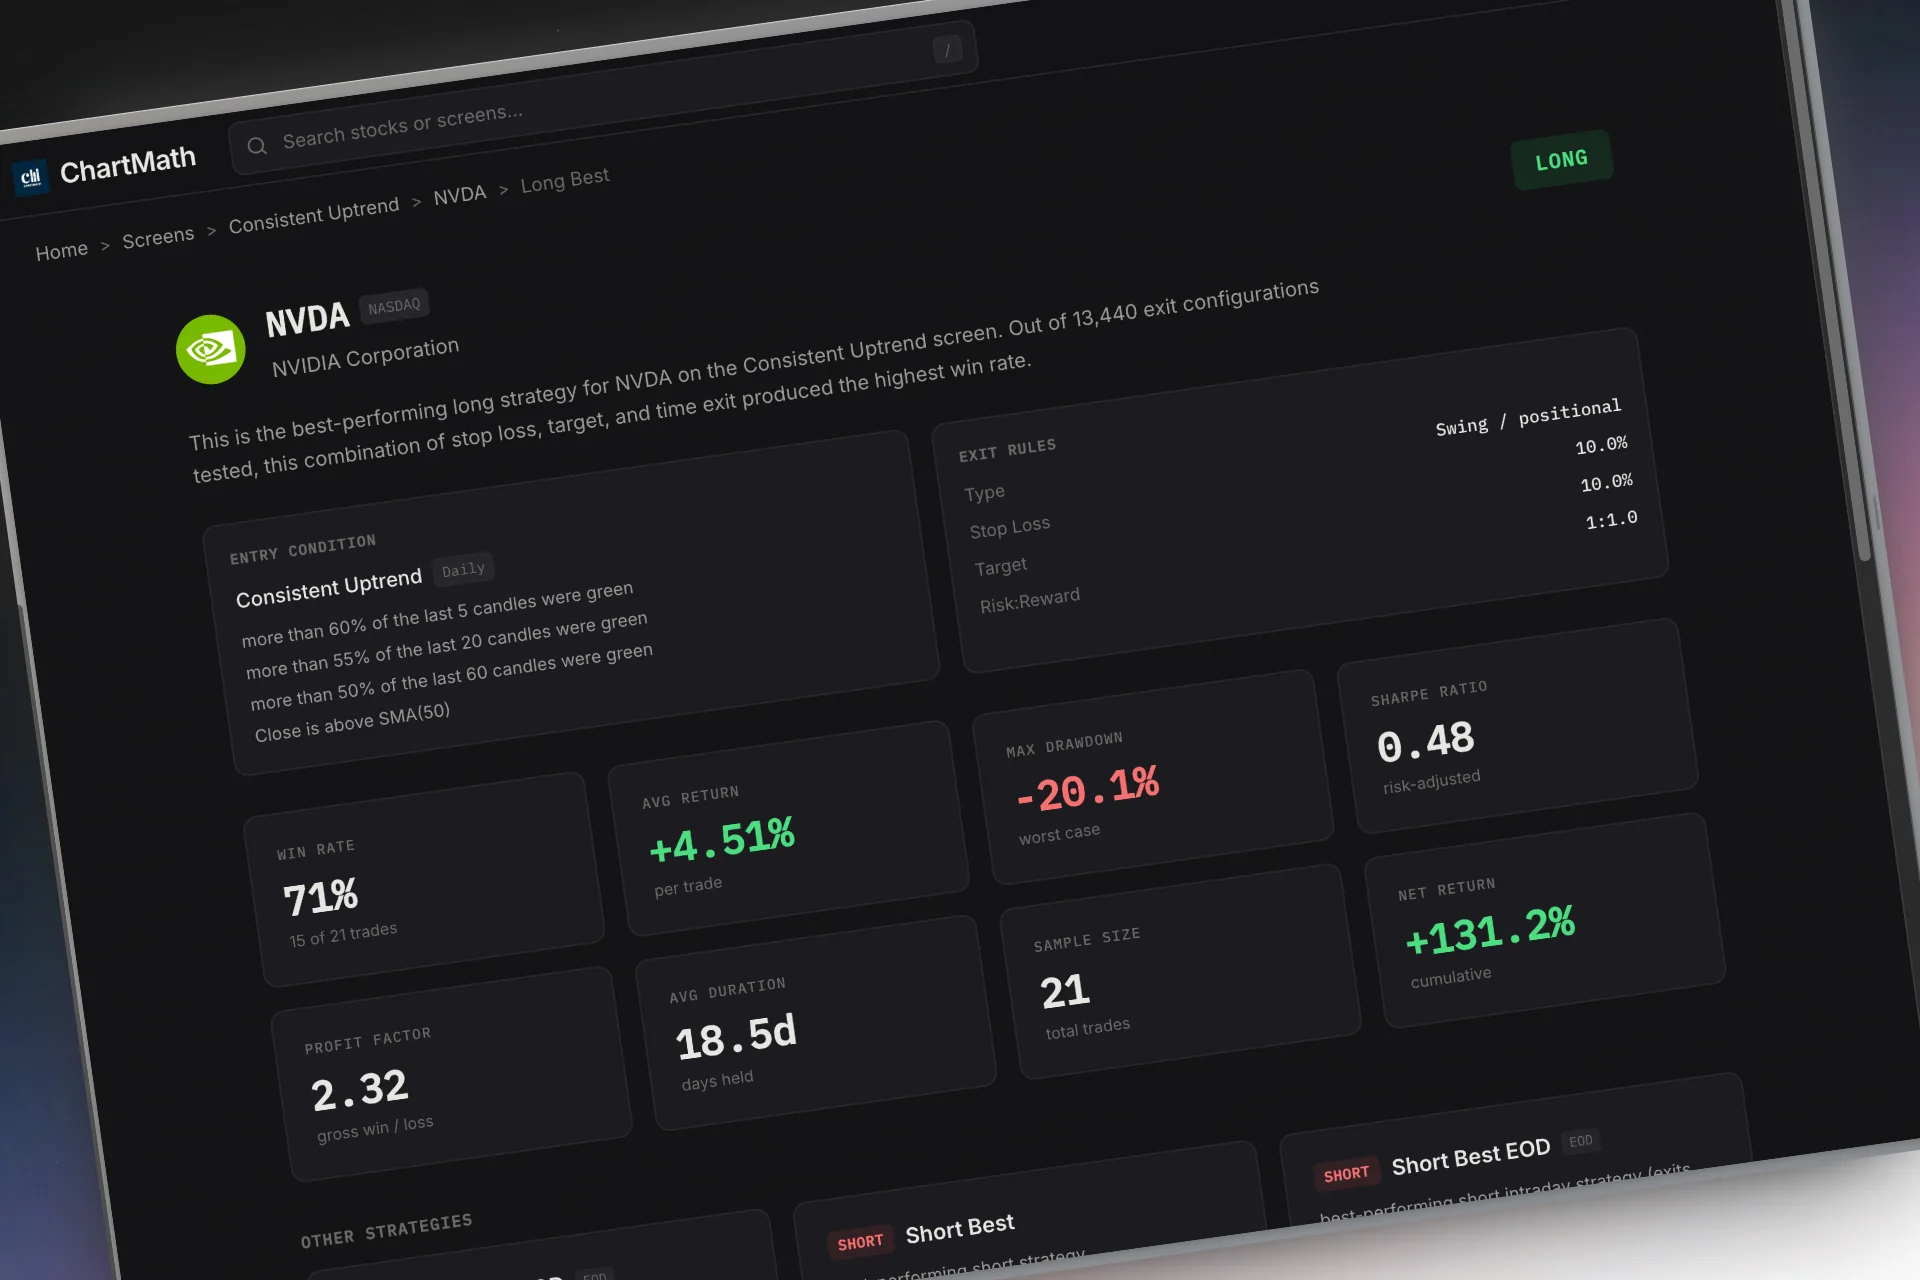
This is also where a documented history matters. A pullback pattern that's been backtested, meaning someone has actually run the rule against historical data and recorded a Win Rate and Avg. Return, carries more weight than the same pattern eyeballed fresh. If you want a deeper walkthrough of what a valid setup rule looks like before you commit capital, see how to read a trading signal before you risk money. The point of this stage isn't to predict the future. It's to confirm the present matches a pattern with a track record.
3. Time the Entry on the Lower Timeframe
The 1-hour or 15-minute chart has exactly one job at this stage: timing, not direction. You already decided direction on the weekly. You already confirmed the pattern on the daily. The lower timeframe just tells you whether to click the button now or wait for the next candle.
- Look for volume confirmation: relative volume (RVOL) running above its recent average on the lower timeframe supports that real buyers or sellers are showing up, not just noise. If you're unfamiliar with the concept, our guide on VWAP trading and volume-weighted average price covers how volume context sharpens entries.
- Wait for a candle close through the trigger level: don't enter mid-candle on a wick. A close above resistance or below support on the 1-hour chart is a stronger signal than an intrabar poke.
- Keep it simple: this step is not an invitation to start scalping the 15-minute chart. You're a swing trader. The lower timeframe refines your fill, it never overrides the trend or setup decisions you already made.
If the lower timeframe never gives you a clean trigger within a day or two of the daily setup forming, that's useful information too. Setups decay. A pullback that was clean three days ago and still hasn't triggered an entry is often a pullback that's turning into something else.
Worked Example: Confirming a Swing Setup on a Liquid Large-Cap
Here's how the three-timeframe stack plays out on a liquid, widely held US large-cap like Microsoft (MSFT). This is illustrative of the process, not a live trade call or a claim about MSFT's actual price history.
Weekly check: you pull up the weekly chart and see MSFT making higher highs and higher lows over the past several months, holding above its 20-week moving average. Trend context: bullish. You're cleared to look for long setups only.
Daily check: you drop to the daily chart and see price pulled back to the 20-day moving average after an extended run, with RSI cooling off from overbought territory back toward neutral. That matches a defined pullback-in-uptrend rule. Setup confirmed, direction matches step one.
1-hour check: you drop to the 1-hour chart and wait. Volume ticks up, RVOL moves above 1, and price closes back above a short-term resistance level it had been testing for a few hours. That's your timing trigger. All three timeframes now agree: uptrend, valid setup, confirmed entry timing.
Notice what didn't happen here: you didn't need to predict where MSFT goes next. You needed three charts to agree with each other. That agreement is the entire basis for the trade, and it's exactly what a real swing trading system for people with a full-time job is built around, repeatable rules across timeframes, not a gut call.
4. When Timeframes Conflict, Stand Down
Here's the section most guides skip, because "stand down" doesn't sell a trade idea. But it's the single highest-leverage rule in this entire framework.
If the weekly trend is down and the daily chart shows a tempting breakout, that breakout is happening inside a larger downtrend. History is full of exactly this pattern: a sharp bounce that looks like a breakout, then fails once the larger trend reasserts itself. The daily chart isn't lying to you, it's just showing you a smaller piece of a bigger picture that disagrees.
Same logic applies in reverse. If the daily setup is a clean pullback in an uptrend, but the 1-hour chart is showing a sharp reversal candle right at your entry trigger, that's a signal the timing isn't right yet, even though the bigger picture is fine. Common conflict patterns to watch for:
- Daily breakout against weekly downtrend: treat this as a countertrend bounce, not a trend trade. Size down or skip it.
- 1-hour reversal inside a daily uptrend pullback: wait. The setup may still be valid tomorrow; forcing an entry into a reversal candle just adds unnecessary risk.
- Daily and weekly agree, but volume on the lower timeframe is dead: low participation means the move can stall or reverse quickly. Not a hard no, but a reason to wait for confirmation.
Standing down isn't a failure to act. It's the same decision a disciplined trader makes dozens of times a month, and it's usually the difference between a small account that survives and one that doesn't.
5. The 5-Minute Alert Confirmation Checklist
This is the part that actually fits into a workday. Whether the alert came from your own watchlist scan or a push notification, here's how to confirm or reject it in under five minutes:
- Open the weekly (or daily) chart first. Confirm trend direction in 60 seconds. If there's no clear structure, stop here and skip the alert.
- Open the daily (or 4-hour) chart. Does the pattern match a defined rule, not just "looks interesting"? If yes, continue. If it's a stretch, skip it.
- Open the 1-hour (or 15-minute) chart. Check RVOL and look for a candle close through the trigger level. No clean trigger yet means wait, not force it.
- Ask the conflict question directly. Does any timeframe disagree with the other two? If yes, stand down regardless of how good the other two charts look.
- If all three agree, size the position and set your stop before you enter. Confirmation across timeframes tells you whether to trade, not how big. That's a separate, disciplined step: start with position sizing at 1 to 2% risk per trade, and see how it fits into an efficient trading workflow.
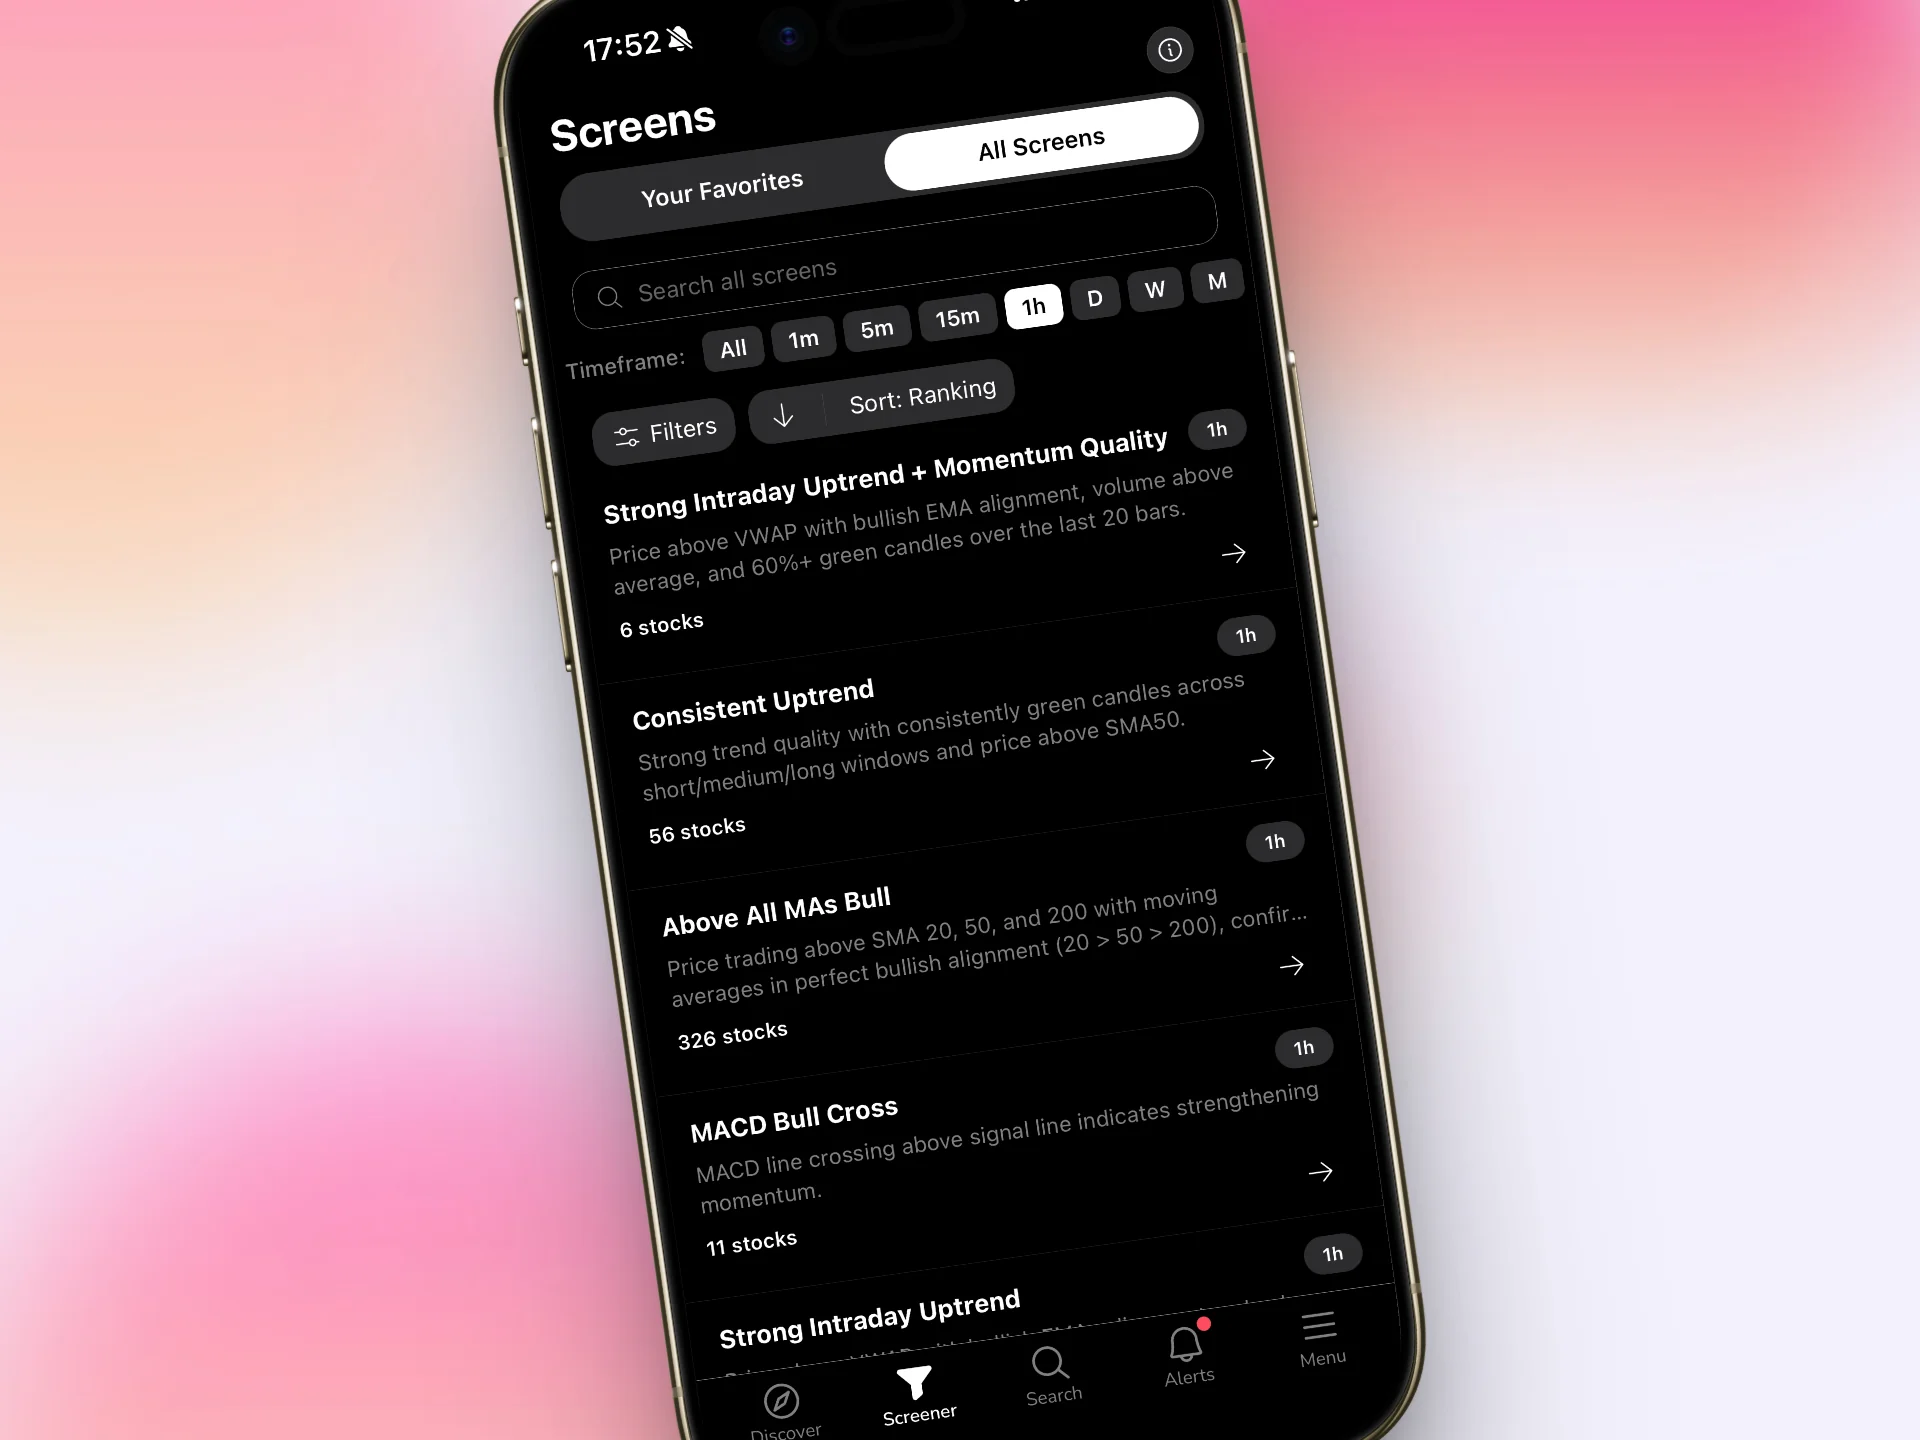
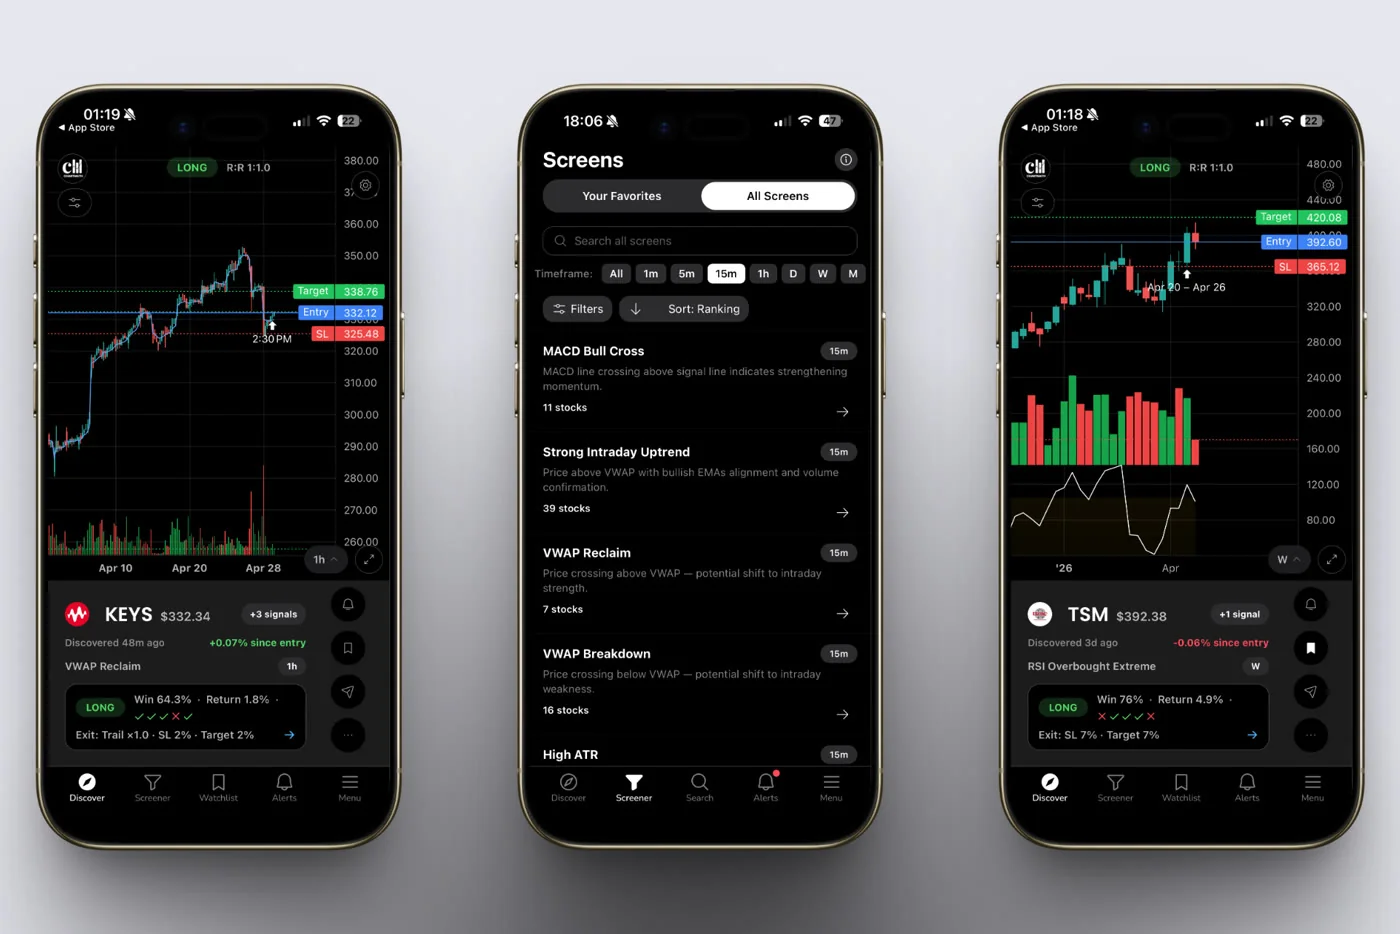
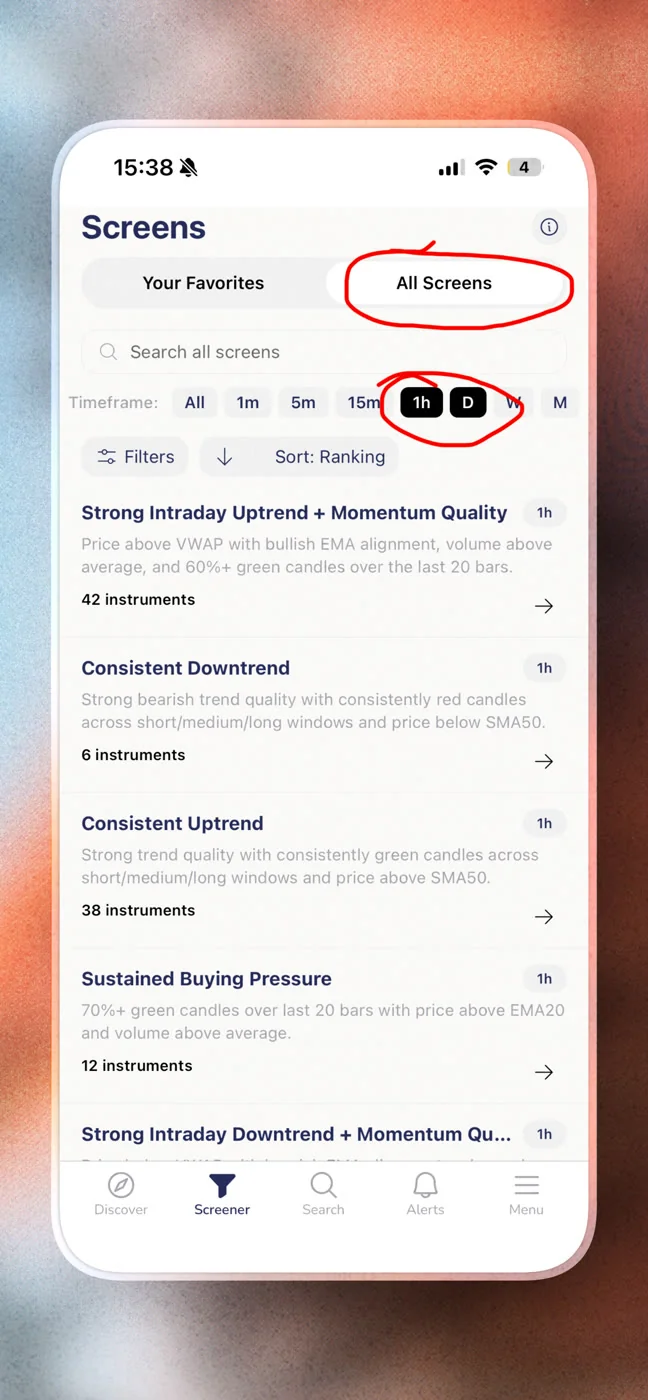
The manual version of this checklist means flipping between three charts per ticker, times however many tickers are on your watchlist. That adds up fast if you're scanning 20 to 100 names by hand. This is exactly the gap a fixed-universe scanner closes: instead of you flipping charts across three timeframes for every ticker, the screening engine checks the alignment across 7 timeframes, from 1-minute through monthly, against a defined universe of 500+ US equities, and only surfaces the ticker when a rule actually fires. It's a discovery copilot, not autopilot: the screen narrows the list down to names where a defined setup exists, and you still run this exact 5-step checklist before you act. The machine does the flipping. You still make the call.
You can browse the full library of 200+ pre-built, read-only screens across momentum, reversal, breakout, and volume categories directly through ChartMath's web-based screener, no coding or Pine Script required to see what's currently matching.
Do This in 15 Minutes Before or After Work
You don't need a trading desk to run this framework. Here's how it fits into a 15-minute window on either side of your workday.
Before work (7 to 10 minutes)
- Check any overnight alerts against your watchlist. Note which tickers have a fresh setup worth checking.
- Run the weekly/daily trend check on your shortlist, no more than 5 to 10 names. This is the fastest step, so do it first while you're fresh.
- Flag anything that passes trend and setup for a 1-hour timing check at your next break.
After work (5 to 8 minutes)
- Revisit flagged tickers and run the 1-hour entry timing check.
- Confirm or reject each one using the conflict rule. Anything that disagrees across timeframes gets dropped, not forced.
- For anything confirmed, set your entry order and stop for the next session rather than trying to time it live if you're not near a screen during market hours.
This routine avoids the two failure modes that wreck part-time traders: checking too often (which invites overtrading) and checking too rarely (which means missing valid setups entirely). If you want a longer-format version of this rhythm across a full week, our guide on running a weekly trading review in 20 minutes extends this into a Sunday process.
Run It on Your Own Ticker
Pick one name currently on your watchlist right now, something you've been eyeing but haven't pulled the trigger on. Open its weekly chart. Ask: uptrend, downtrend, or range? Then open the daily chart and check whether there's an actual defined pattern present, not just a chart that "looks okay." Then check the 1-hour chart for a real trigger.
If you get through all three and they agree, you've just done, by hand, what a multi-timeframe confirmation process is supposed to do. If you want to see how a scanner surfaces this same alignment automatically instead of you doing the chart-flipping, download the ChartMath app and run your own watchlist against the same 200+ screens across all 7 timeframes. If you'd rather see it in action first, you can watch a quick demo before you set anything up.
Recap: The Multi-Timeframe Confirmation Rules
- The higher timeframe (weekly or daily) sets trend direction. This is a one-time decision per setup, not something you re-litigate on lower timeframes.
- The trading timeframe (daily or 4h) has to show a defined, repeatable setup rule, not a feeling.
- The lower timeframe (1h or 15m) only times entry. It never overrides trend or setup decisions.
- When any two timeframes disagree, stand down. This is a decision, not a missed trade.
- Confirmation should take under 5 minutes per alert once you have a fixed checklist.
- A screening tool can pre-align timeframes across a fixed universe so you spend your limited time confirming, not searching.
Frequently Asked Questions
What is the best timeframe combination for swing trading?
For holds of one to three weeks, weekly for trend, daily for setup, and 1-hour for entry timing is the standard stack. For shorter swings of three to ten days, shift down one level: daily for trend, 4-hour for setup, and 15-minute or 1-hour for entry. The exact timeframes matter less than keeping the three jobs, trend, setup, and timing, separate and never letting the lowest timeframe override the highest.
Do I need a scanner to do multi-timeframe confirmation?
No. The process works with any charting tool you already use. What it doesn't survive is scale: three charts per ticker across 20 to 100 names is an hour of flipping you don't have on a workday. A fixed-universe screener that checks the same rule across all 7 timeframes removes the searching, not the deciding. Traders arriving from a paid scanner usually want that same trade: less manual work, reasoning still visible. Our notes on switching from Trade Ideas to a cheaper scanner cover what changes in practice.
Can I get trade setup alerts by email instead of checking charts manually?
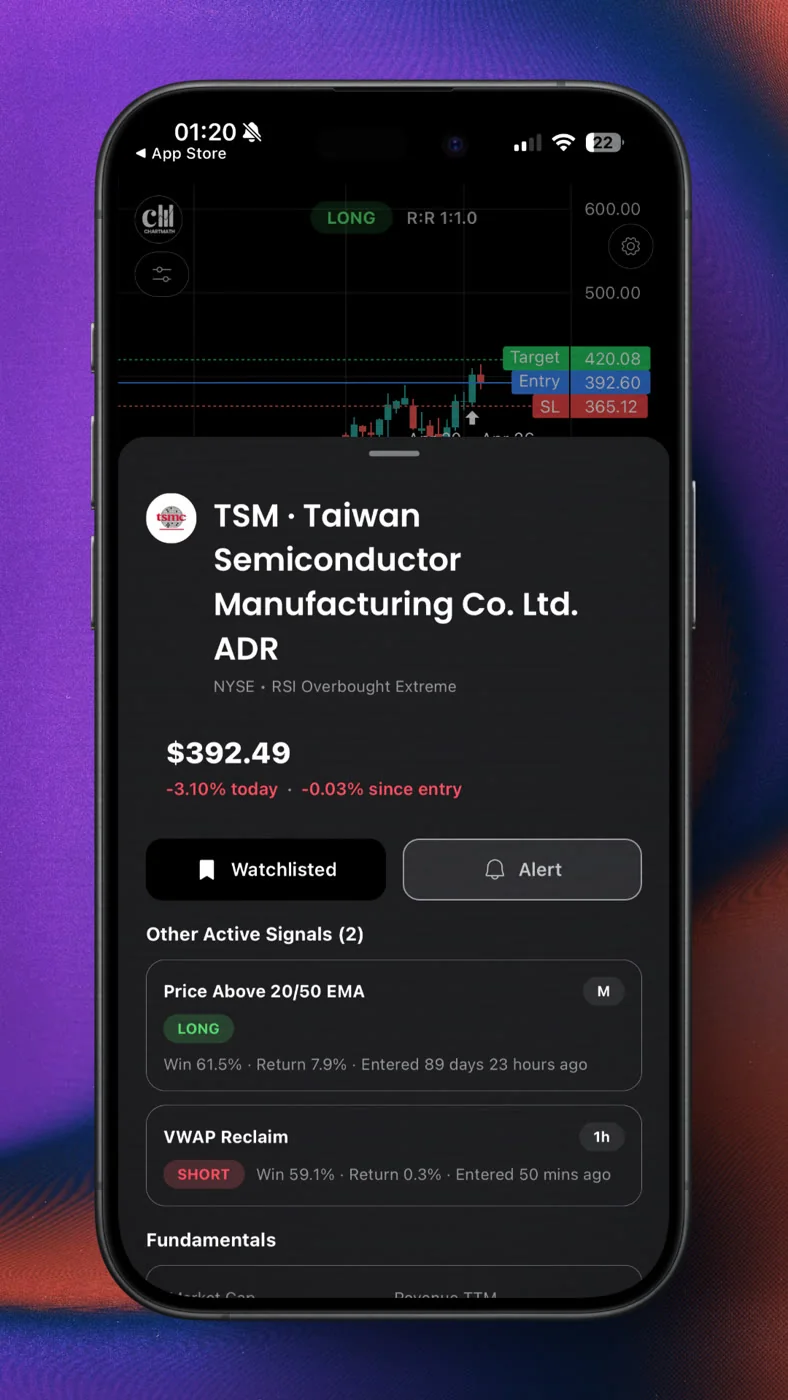
Yes. Rather than a generic trade-setup email newsletter with no backtest attached, ChartMath sends push and email alerts the moment a ticker matches one of its 200+ read-only screens, each with a documented Win Rate and Avg. Return you can check before you ever open a chart. That still leaves the multi-timeframe confirmation step to you, the alert tells you where to look, not what to do. For more on filtering noise before it reaches your phone, see how to use a stock scanner alongside TradingView.
Multi-timeframe confirmation isn't complicated. It's three questions asked in the right order, with a hard rule to stand down when they disagree. What eats your time isn't the logic, it's the manual work of flipping between charts for every name on your list. If you'd rather spend that time confirming instead of searching, download the ChartMath app and let a fixed universe of 500+ US equities get pre-screened across all 7 timeframes before an alert ever reaches your phone. You still make the call. You just stop doing the chart-flipping by hand.

Ankush Jindal
LinkedInSee these setups live in ChartMath
200+ curated screens with backtest data. Free. No credit card required.