Swing Trading Momentum Stocks Without Watching Charts All Day
Your 10:15 AM standup runs long. By the time you check your phone at 10:47, a stock you've been watching has already run 4% on volume that's triple its normal pace. You missed the entry. Not because you lack discipline. Not because you don't understand the setup. You missed it because you were in a meeting, and meetings don't pause for momentum.
This is the actual problem for most swing traders with a day job: it's not a knowledge gap, it's an availability gap. You know what RSI, MACD, and moving averages tell you. You've read enough to spot a real breakout from a fake one. What you don't have is eight uninterrupted hours to watch a chart. And here's the part most trading content gets wrong: you don't need to. Swing trading momentum stocks without watching charts all day isn't a compromise, it's the correct approach when you're holding for days instead of minutes.
Why Intraday Momentum Reads Mislead a Swing Trader
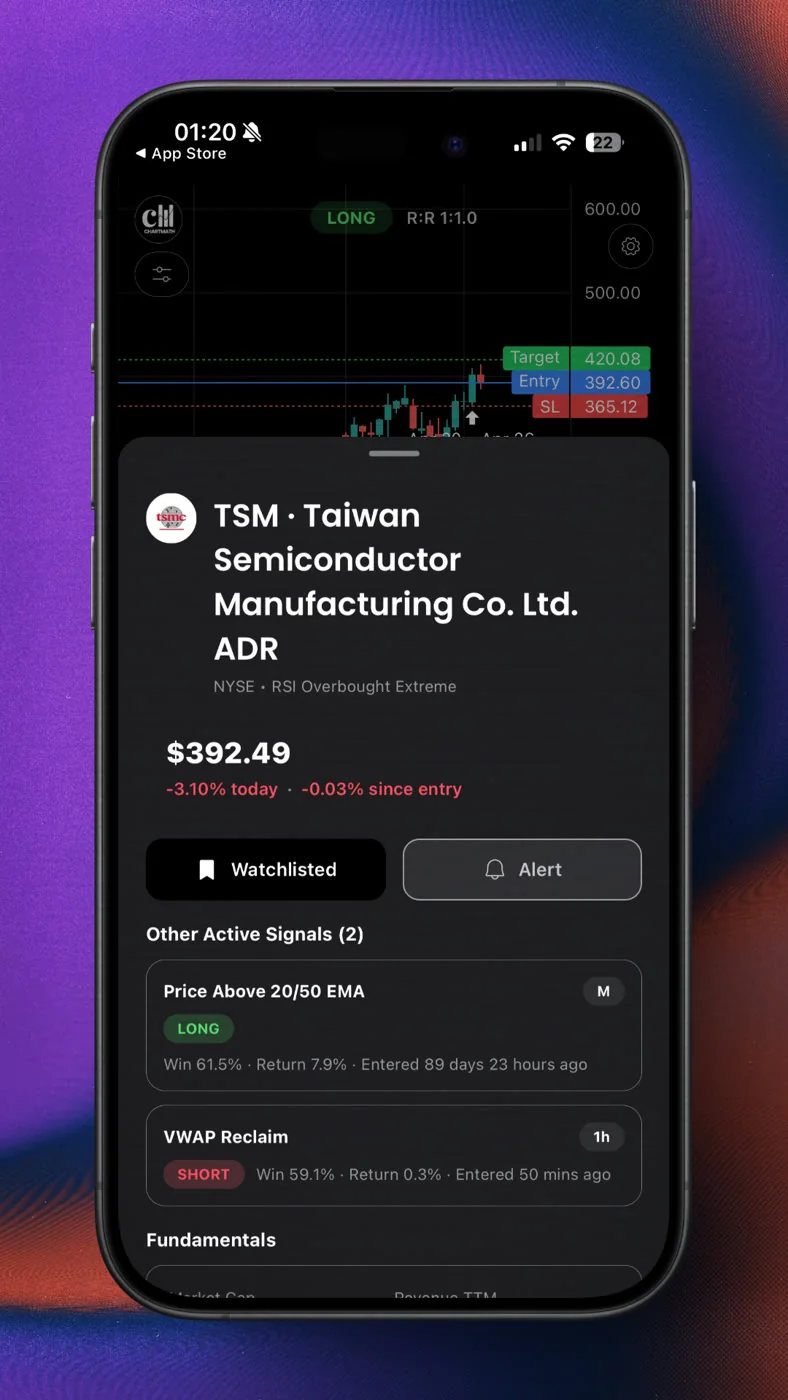
Most momentum content is written for day traders staring at a 1-minute or 5-minute chart. That's a different game with different math. A stock can spike on a 1-minute candle because of a single large order, then give the entire move back before lunch. If you're holding for three to ten days, that kind of noise is irrelevant to your decision, and reacting to it is how good swing setups turn into bad day trades by accident.
A multi-day hold needs momentum measures that describe the trend over days, not ticks. That means looking at how a stock is moving relative to its own recent volume, how fast it has actually traveled over the past week or two, and how it's performing against the broader market. None of that requires a live chart open at 10:47 AM. It requires a scan that runs whether you're watching or not, and an alert that reaches you when the conditions are actually met.
Reframe the problem this way: you're not undisciplined, you're unavailable from 9:30 to 4:00. That's an infrastructure gap, and infrastructure gaps get solved with better tools, not more willpower. The rest of this guide walks through which momentum measures matter for a multi-day hold, how to build a bounded watchlist you can actually manage, and a routine that fits around a full-time job instead of fighting it.
1. Know Which Momentum Measures Actually Matter for Multi-Day Holds
Three measures do most of the work when you're screening for momentum stocks to hold for several days: relative volume, rate of change, and relative strength against the index. Understanding what each one tells you, and what it doesn't, keeps you from chasing a move that's already over by the time you see it.
Relative Volume (RVOL)
What is relative volume in day trading and swing trading? RVOL compares a stock's current volume to its typical volume at the same point in the session, usually expressed as a multiple like 2.1x or 3.5x. A stock trading at 3x its normal volume is telling you something real is happening, new money is entering, not just the usual noise of market makers and algos shuffling shares around.
For a swing hold, RVOL matters most on the day the move starts. A breakout on 1.2x volume is weak evidence. The same breakout on 3x volume, especially if it holds into the close, suggests real participation behind the move. That's the difference between a setup worth tracking for the next several sessions and one that's likely to fade by tomorrow.
Rate of Change (ROC)
Rate of change measures how far a stock has moved over a defined lookback period, say five or ten trading days, expressed as a percentage. This is where the multi-day framing actually matters. A stock's 1-minute chart might look explosive, but its 10-day rate of change tells you whether that's part of a real trend or a single-day anomaly sitting inside a flat month.
Swing traders should care more about a stock's five-day and ten-day ROC than its intraday tick chart. A name with strong positive ROC across multiple timeframes, daily and weekly agreeing with each other, is showing sustained momentum. A name with a huge 1-minute spike but flat weekly ROC is showing you noise, not a trend you want to hold through the week.
Relative Strength vs. the Index
The third measure, relative strength against something like SPY or QQQ, answers a question RVOL and ROC can't: is this stock actually leading, or is it just getting dragged up by a strong market day? A stock up 3% on a day the S&P is up 2.8% isn't showing leadership. A stock up 3% on a day the S&P is flat or down is showing real, independent strength, and that's usually the more durable setup for a multi-day hold.
This is also why intraday-only momentum reads mislead swing traders. A 5-minute chart can't tell you whether a move is market-wide or stock-specific. You need to see the stock against its benchmark over the same multi-day window you intend to hold it. Combine all three, elevated RVOL confirming participation, positive multi-day ROC confirming trend, and relative strength confirming leadership, and you've filtered out most of the noise that traps traders who only look at intraday charts.
2. Build a Bounded Watchlist Instead of Watching the Whole Market
Here's where most retail traders get stuck. A static screener like Finviz makes you rebuild your filters constantly. You set RVOL above 2, add a rate of change condition, save it, and it's a static list the moment you close the tab. It doesn't ping you. It doesn't tell you if that filter combination has ever actually worked. You're left refreshing a page and hoping something shows up during the ten minutes you have free.
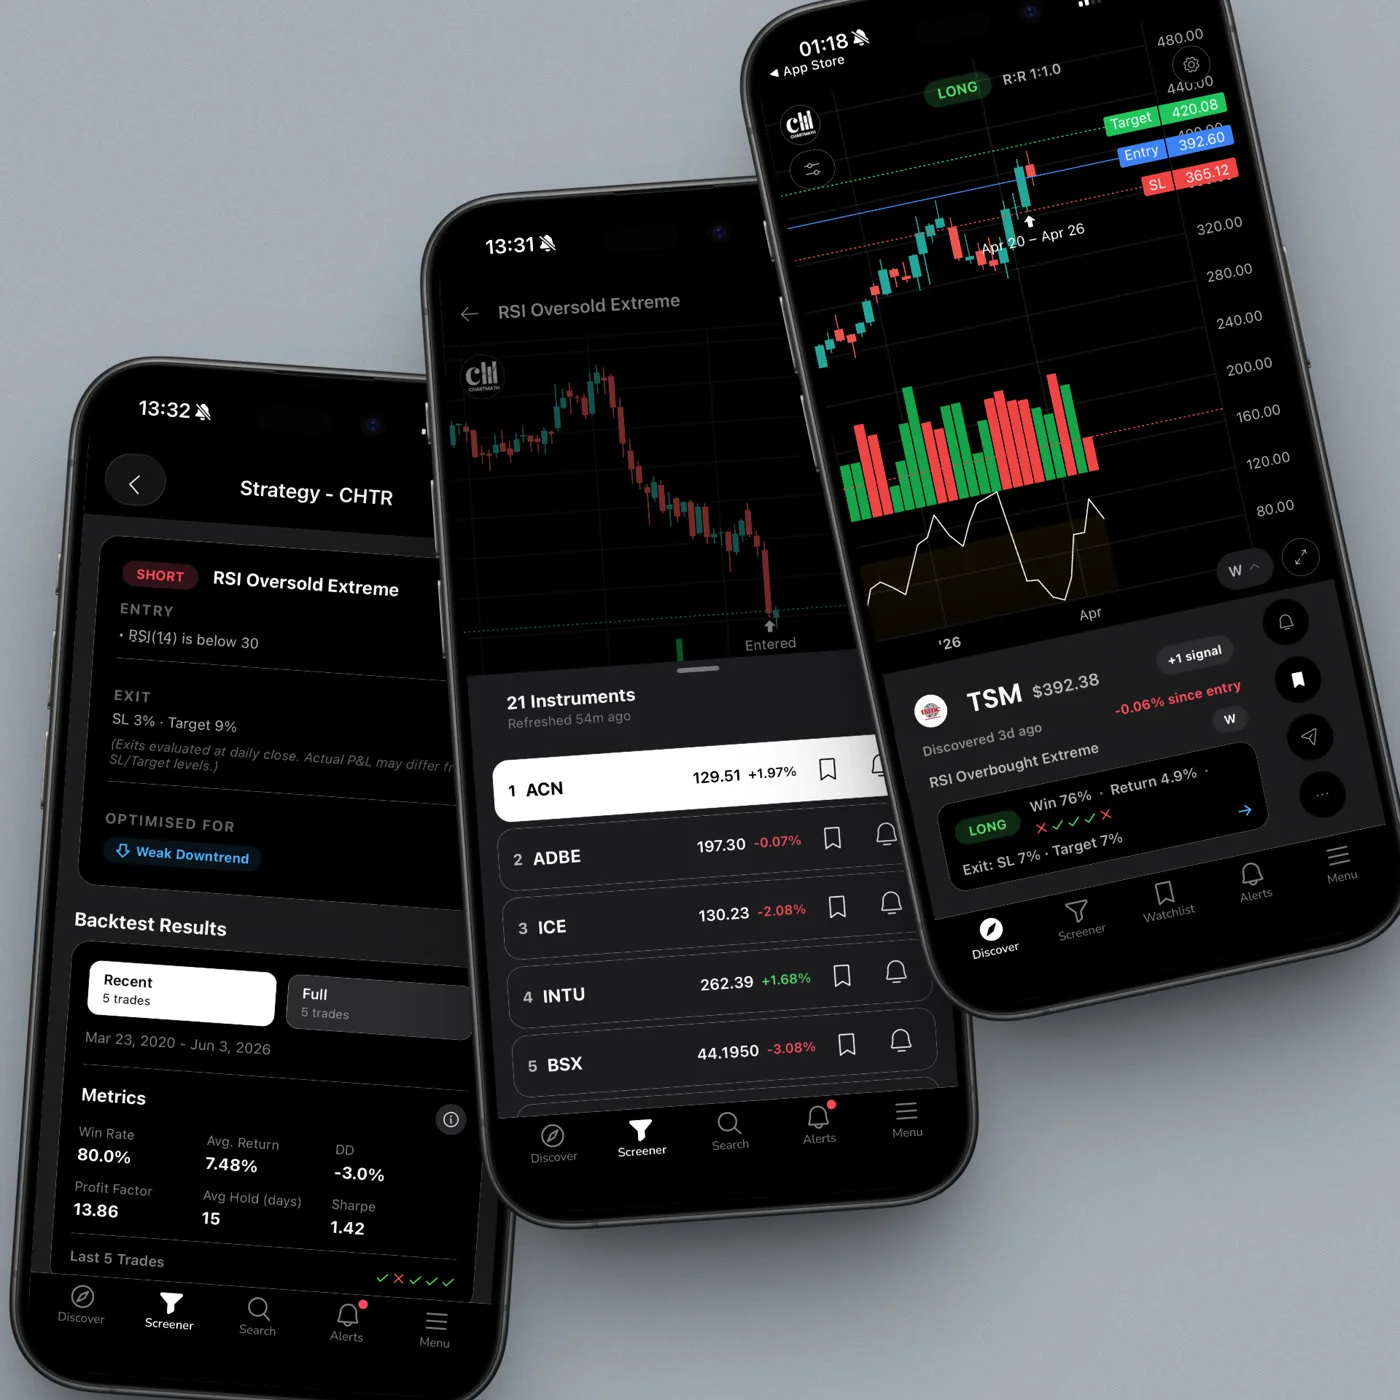
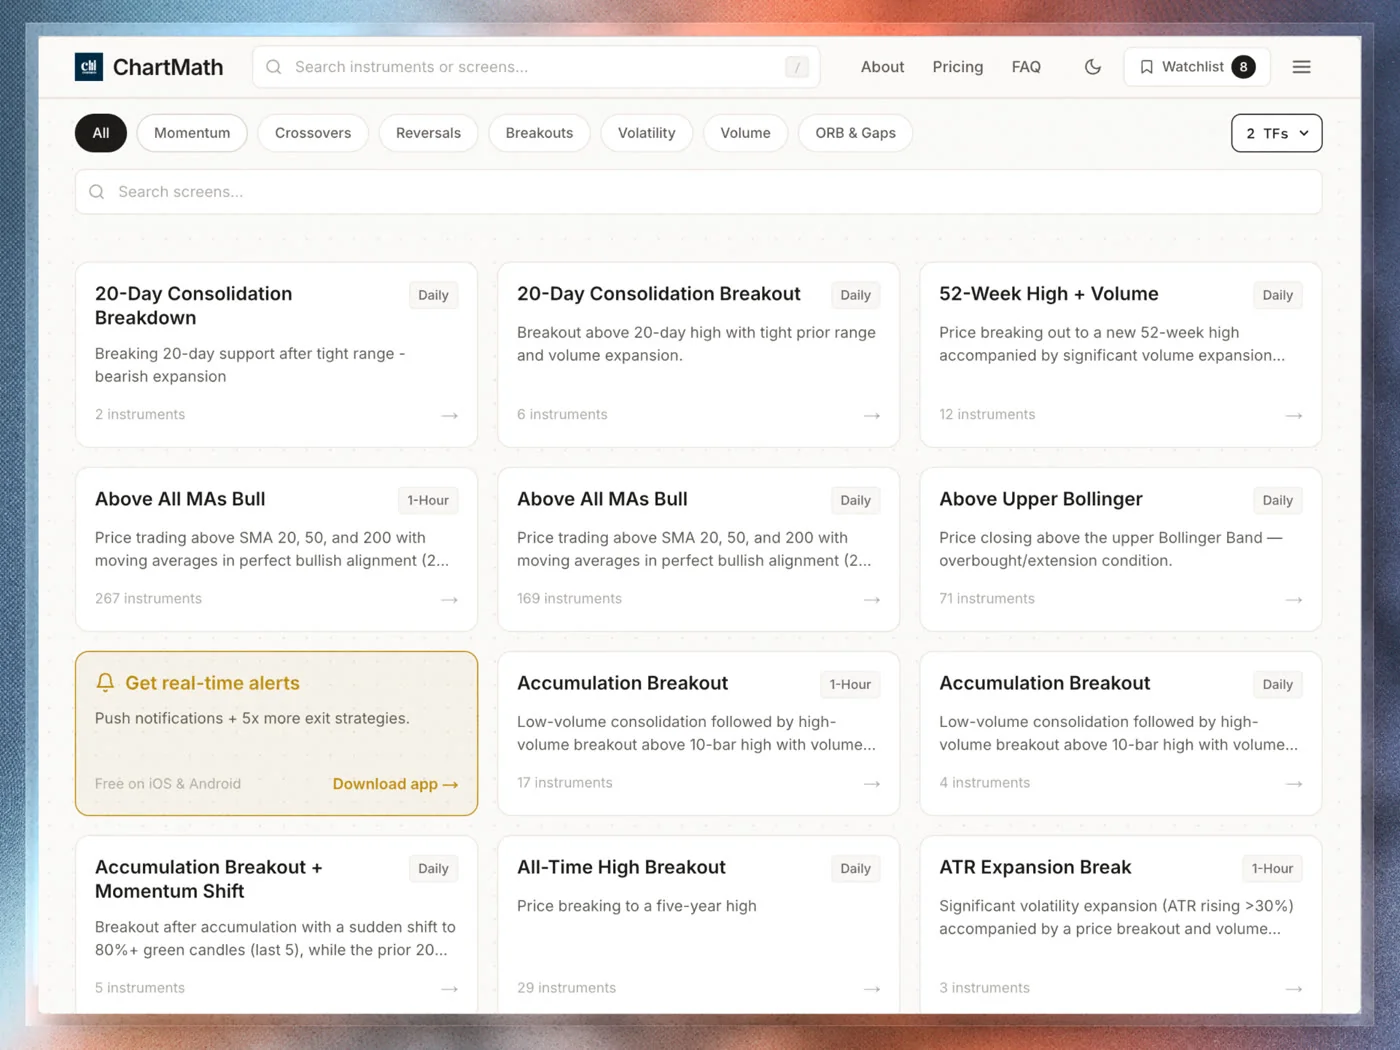
The fix isn't to watch more stocks, it's to watch a smaller, bounded universe with rules you can actually verify. A screen that runs against a defined universe, say 500+ US equities, is something you can recompute. It has a Win Rate and an Avg. Return attached to it, drawn from a stated sample size, so you're not guessing whether "RVOL above 2x plus positive relative strength" has ever actually worked. You can see the number.
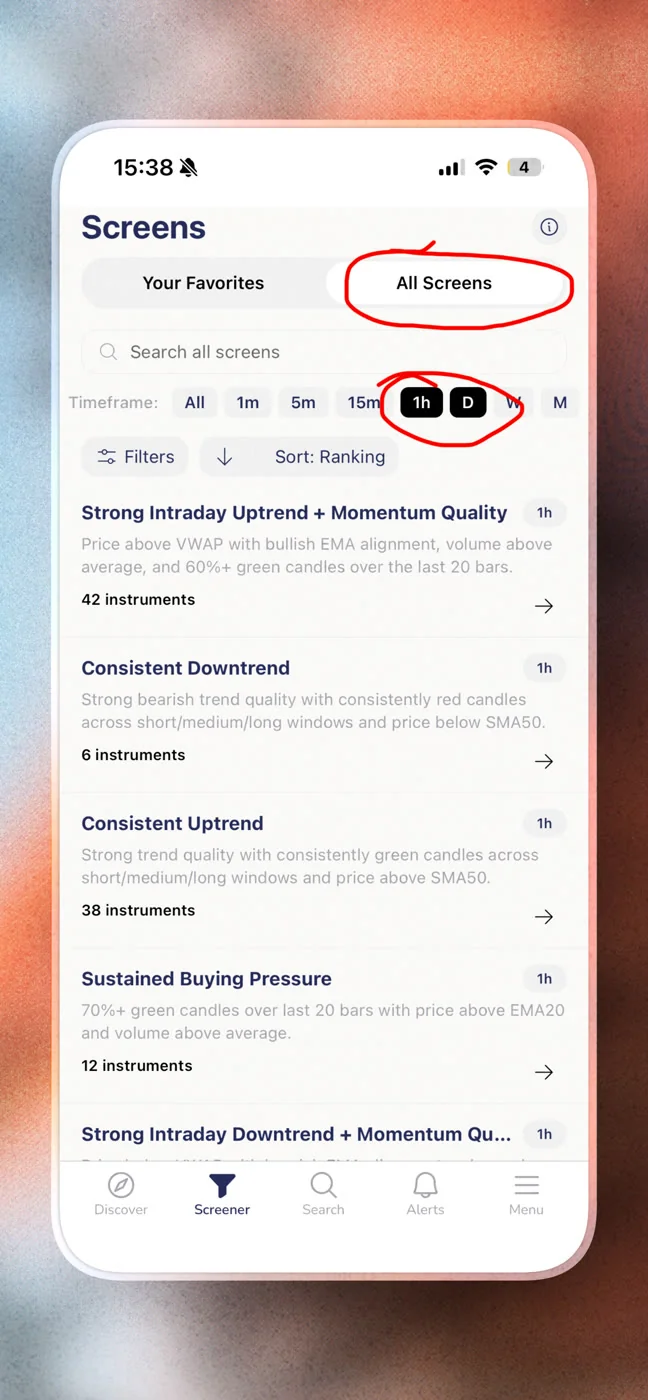
That's the core idea behind trade discovery built on ready-made screens instead of a blank filter box. ChartMath runs 200+ curated, read-only technical screens across that 500+ US equity universe (plus 100 crypto pairs and 11 US futures) across seven timeframes, from 1-minute up through monthly. For a swing trader focused on multi-day holds, that means screens built around RVOL spikes, VWAP reclaims, and relative strength leadership run continuously in the background. You don't rebuild the filter every morning. You check what matched.
A screen is a deterministic rule on a bounded universe. Anyone can recompute its Win Rate and Avg. Return. That's a meaningfully different claim than a chart that "looks like" a setup.
There's no screen builder here, and that's intentional. You're not writing Pine Script or configuring twelve filter conditions from scratch. You're picking from a curated catalog and letting the scan run against a bounded, known universe. If you've been burned by a screener that shows you a list but never tells you whether the pattern has any track record, that's the gap this closes.
3. Set Alerts That Fire Once, Not Fifty Times a Day
Alert fatigue is real, and it's the reason a lot of traders quietly stop checking their phone by Wednesday. If you've ever joined a signal group where forty tickers get posted a day, you already know what happens: you stop reading them. The signal drowns in the noise, and the one alert that actually mattered gets lost between nine others that didn't.
The fix isn't more alerts, it's fewer, better-targeted ones. Alerts should be tied to a specific screen and a specific ticker, with a plain-English reason attached, not a raw ticker symbol with no context. "KEYS entered VWAP Reclaim on the 1h screen, 64.3% backtested win rate" is something you can act on in thirty seconds. "AAPL - buy" tells you nothing about why, and you shouldn't trust it enough to risk capital on it.
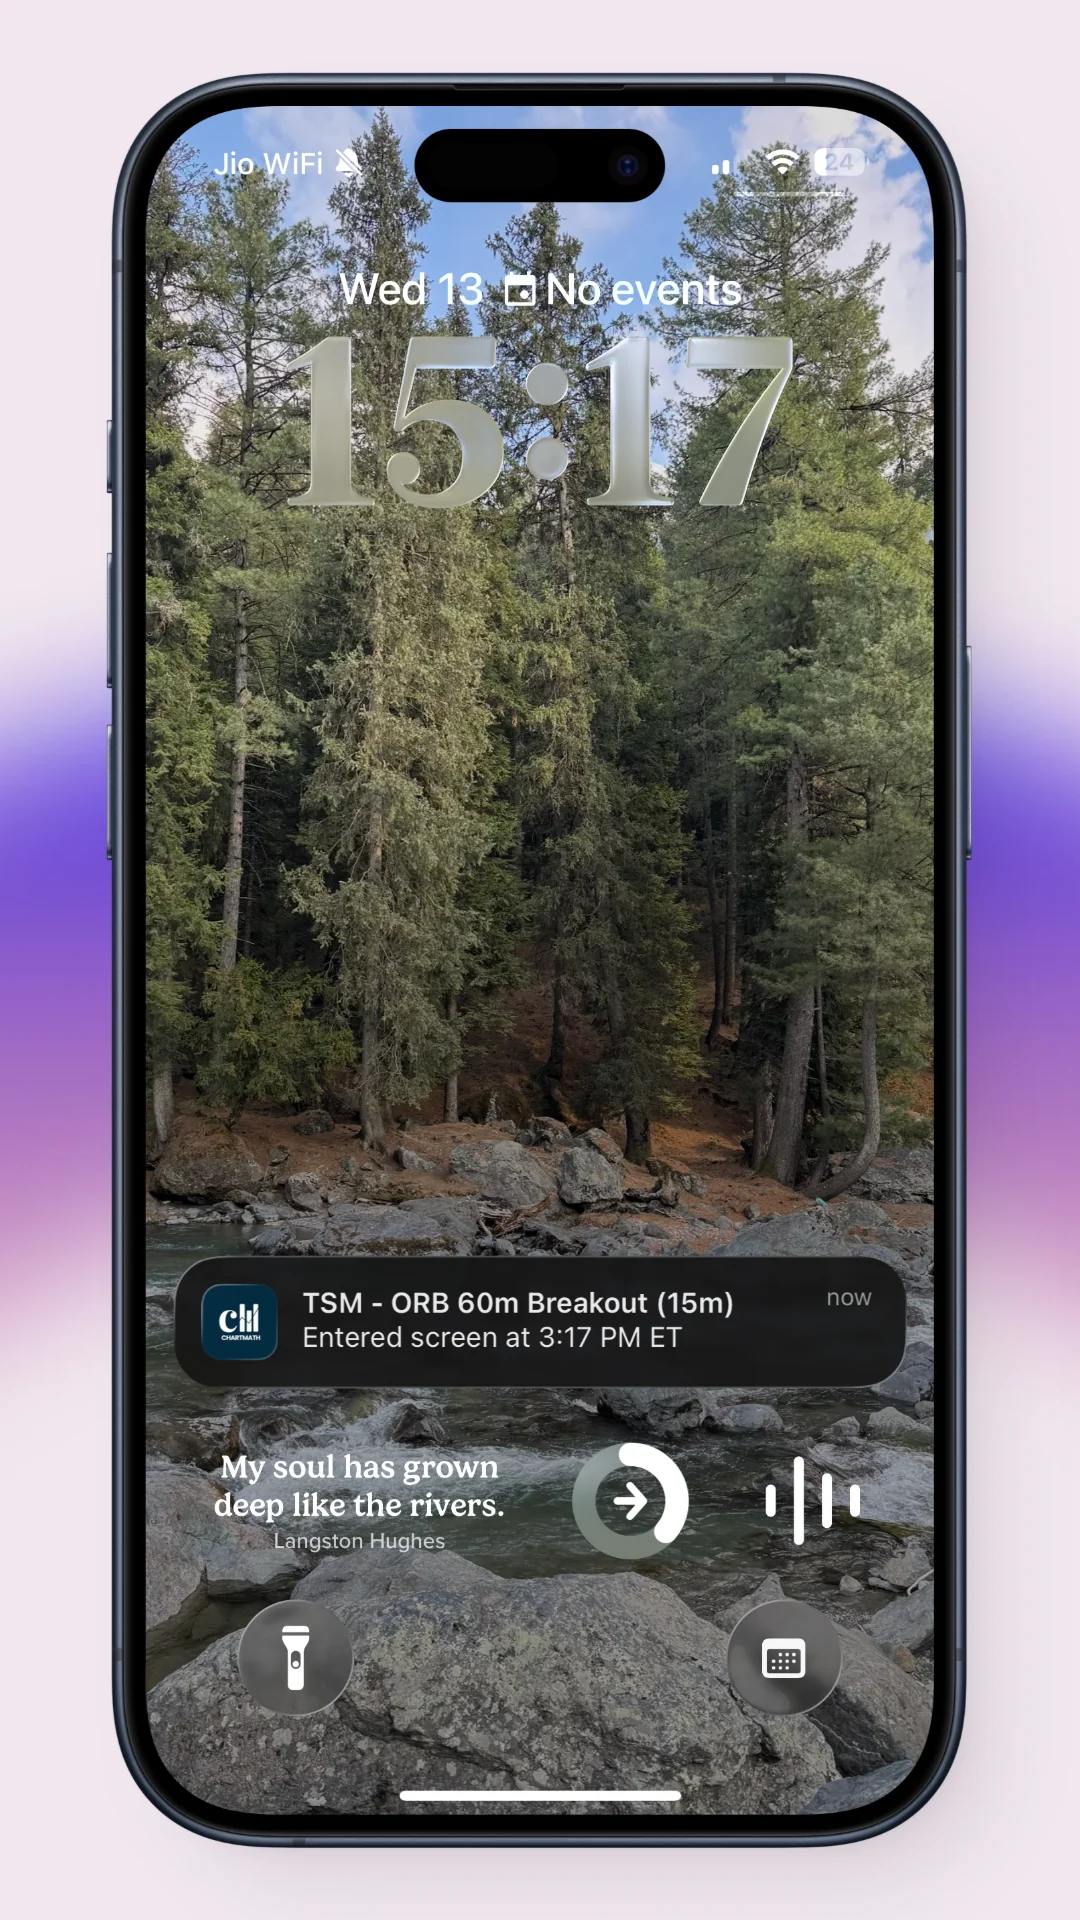
ChartMath sends alerts by push and email only, tied to screens you've favorited, with de-duplication and quiet hours so you're not getting pinged three times for the same setup or woken up at 2 AM for a crypto pair you don't trade. That's the difference between an alert system built for a 9-to-5 schedule and a Discord channel that assumes you're watching the feed all day. For more on getting the timing right, this breakdown of watchlist alerts that fire at the right time covers how to tune alert timing specifically for swing holds instead of scalps.
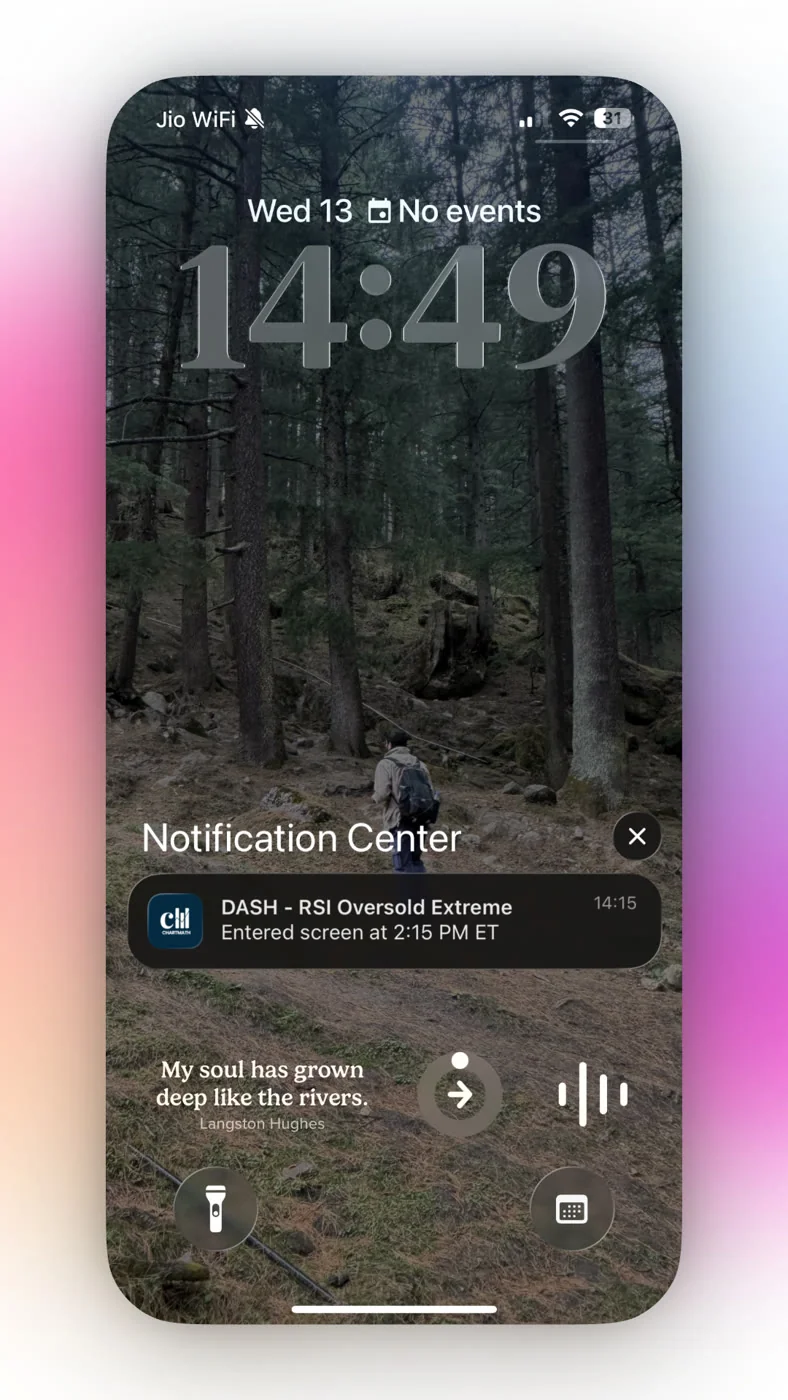
Set up your watchlist mode so alerts only fire on tickers you actually track, not every match across the entire screen. That single change cuts most of the noise before it ever reaches your phone.
4. Run the Premarket-to-Evening Workflow That Fits a 9-to-5
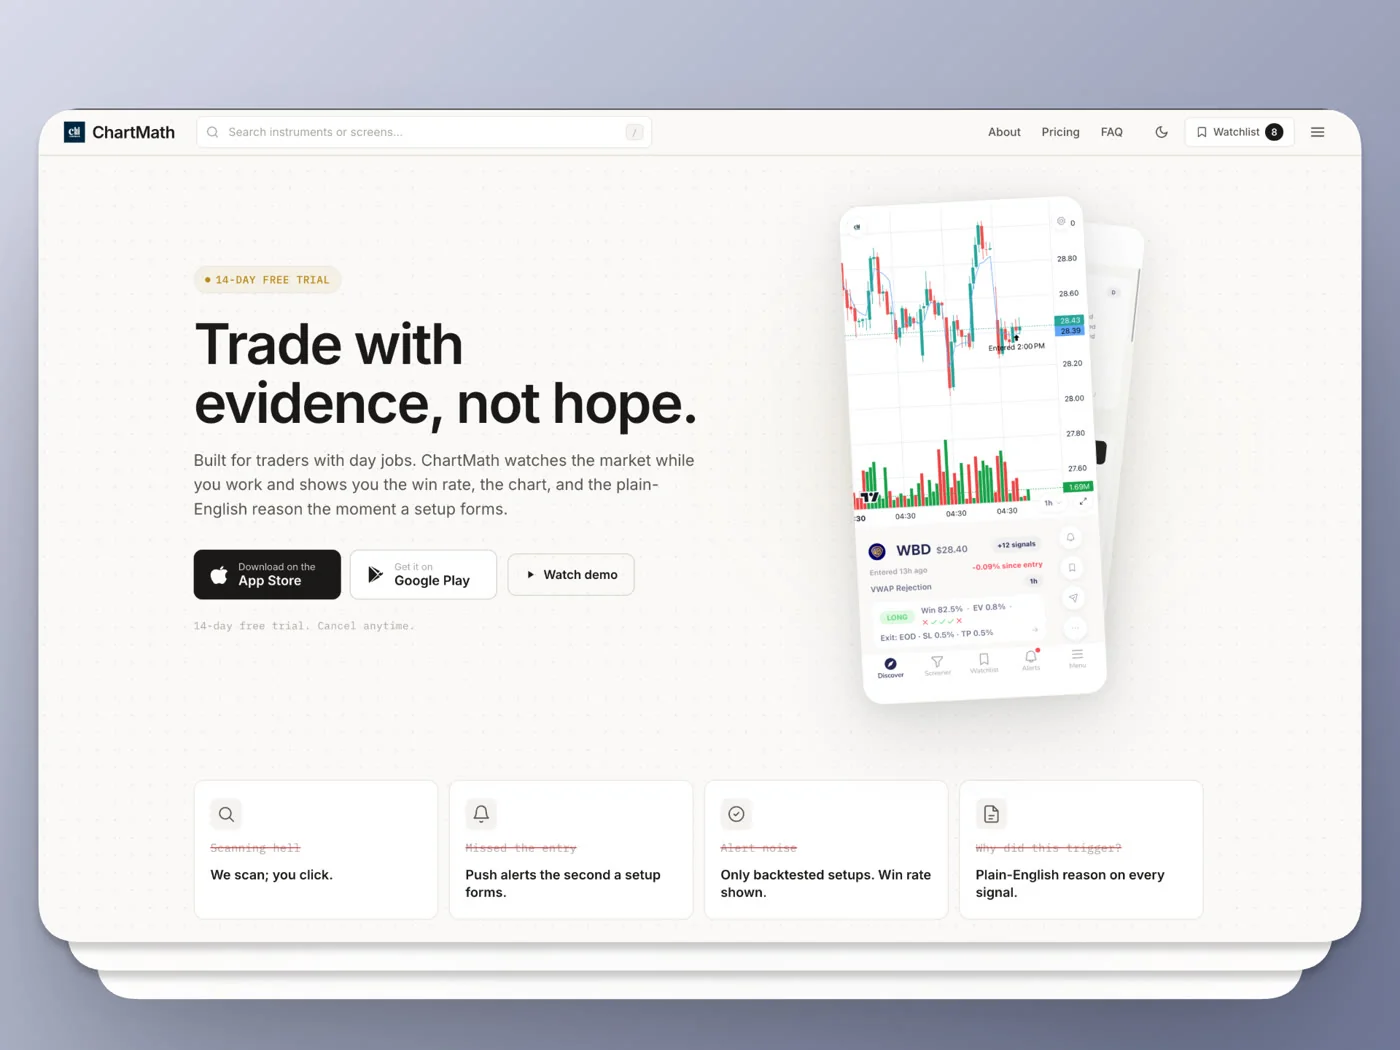
Silence between alerts isn't a gap in your process, it's the feature working as designed. You don't need to watch a chart from 9:30 to 4:00 if the scan is doing that for you and only surfacing what actually matters. Here's a routine built around three checkpoints instead of eight hours of screen time.
Premarket (15-20 minutes)
- Open your watchlist and review any overnight alerts that fired on favorited screens.
- Check whether RVOL and relative strength are still holding premarket, not just at yesterday's close.
- Confirm the setup's screen still shows an intact multi-day rate of change, not a single overnight gap that's about to reverse.
- Decide, before the open, whether you're entering, waiting for confirmation, or passing.
Midday (0 minutes, unless something fires)
This is the part that surprises people: there's nothing to do here. If a favorited screen catches a new match, you get a push notification with the ticker, the screen, and the reason it triggered. If nothing fires, your phone stays quiet, and that's exactly what you want. You're not missing anything by being in a meeting, because the scan ran the entire time you couldn't.
Evening or Weekend Review (20-30 minutes)
- Go through every alert that fired during the day and confirm the setup still holds after the close.
- Check the screen's Win Rate, Avg. Return, and sample size again before sizing a position.
- Decide position size based on your account risk rules, not the excitement of the alert.
- Add or remove tickers from your watchlist for tomorrow's premarket check.
This isn't a theoretical routine. It's the same structure covered in a real system for swing trading with a full-time job, and it pairs well with a 20-minute weekly review to catch patterns across the week instead of just reacting trade by trade. If you want a broader look at fitting the entire process, including journaling and sizing, around office hours, this guide to building an efficient trading workflow covers the full loop.
5. Turn an Alert Into an Entry Decision Without Guessing
An alert is a starting point, not a green light. Before you act on any momentum alert, run through a short checklist so you're deciding with the same rigor every time, not just when you happen to feel careful.
- Sample size: Does the screen's Win Rate come from a large enough sample to trust it, or is it based on a handful of occurrences that could easily be noise?
- Agreement across measures: Do RVOL, rate of change, and relative strength all point the same direction? One strong signal and two weak ones is a lower-conviction setup than all three agreeing.
- Timeframe match: Is the screen built on a timeframe that matches your intended hold? A 1-minute breakout screen isn't the right evidence for a five-day hold; a daily or weekly screen is.
- Position size, decided in advance: Your size should come from your account risk rules, not from how confident the alert makes you feel in the moment. Decide your 1-2% risk per trade before you ever see a ticker.
This is the same discipline covered in how to validate a swing trade setup before you risk capital, and it's worth reading in full if you've ever bought a setup on excitement and sold it on regret. Position sizing rules exist precisely so the sizing decision doesn't get made in the heat of an alert notification.
Momentum Screen Comparison: What Each Measure Tells a Swing Trader
Here's how the core momentum measures stack up against each other for a multi-day hold, including where intraday-only reads fall short.
| Measure | What It Measures | Ideal Holding Period | False-Signal Risk | Best Paired With |
|---|---|---|---|---|
| RVOL (Relative Volume) | Current volume vs. typical volume at the same session point | Entry-day confirmation for 3-10 day holds | Medium (can spike on a single large order) | Rate of change, relative strength |
| Rate of Change (ROC) | Percentage move over a 5-10 day lookback | 3-10 day swing holds | Low-Medium (lags a brand-new reversal) | RVOL, VWAP reclaim screens |
| Relative Strength vs. Index | Stock performance vs. SPY/QQQ over the same window | Multi-day to multi-week holds | Low (filters out market-wide moves) | Rate of change, RVOL |
| Intraday-Only Momentum (1m/5m spikes) | Short-term price velocity on a single candle | Scalps and day trades only | High for swing use (fades by close) | Not recommended alone for multi-day holds |
Why a Backtested Screen Beats a Gut-Feel Momentum Trade
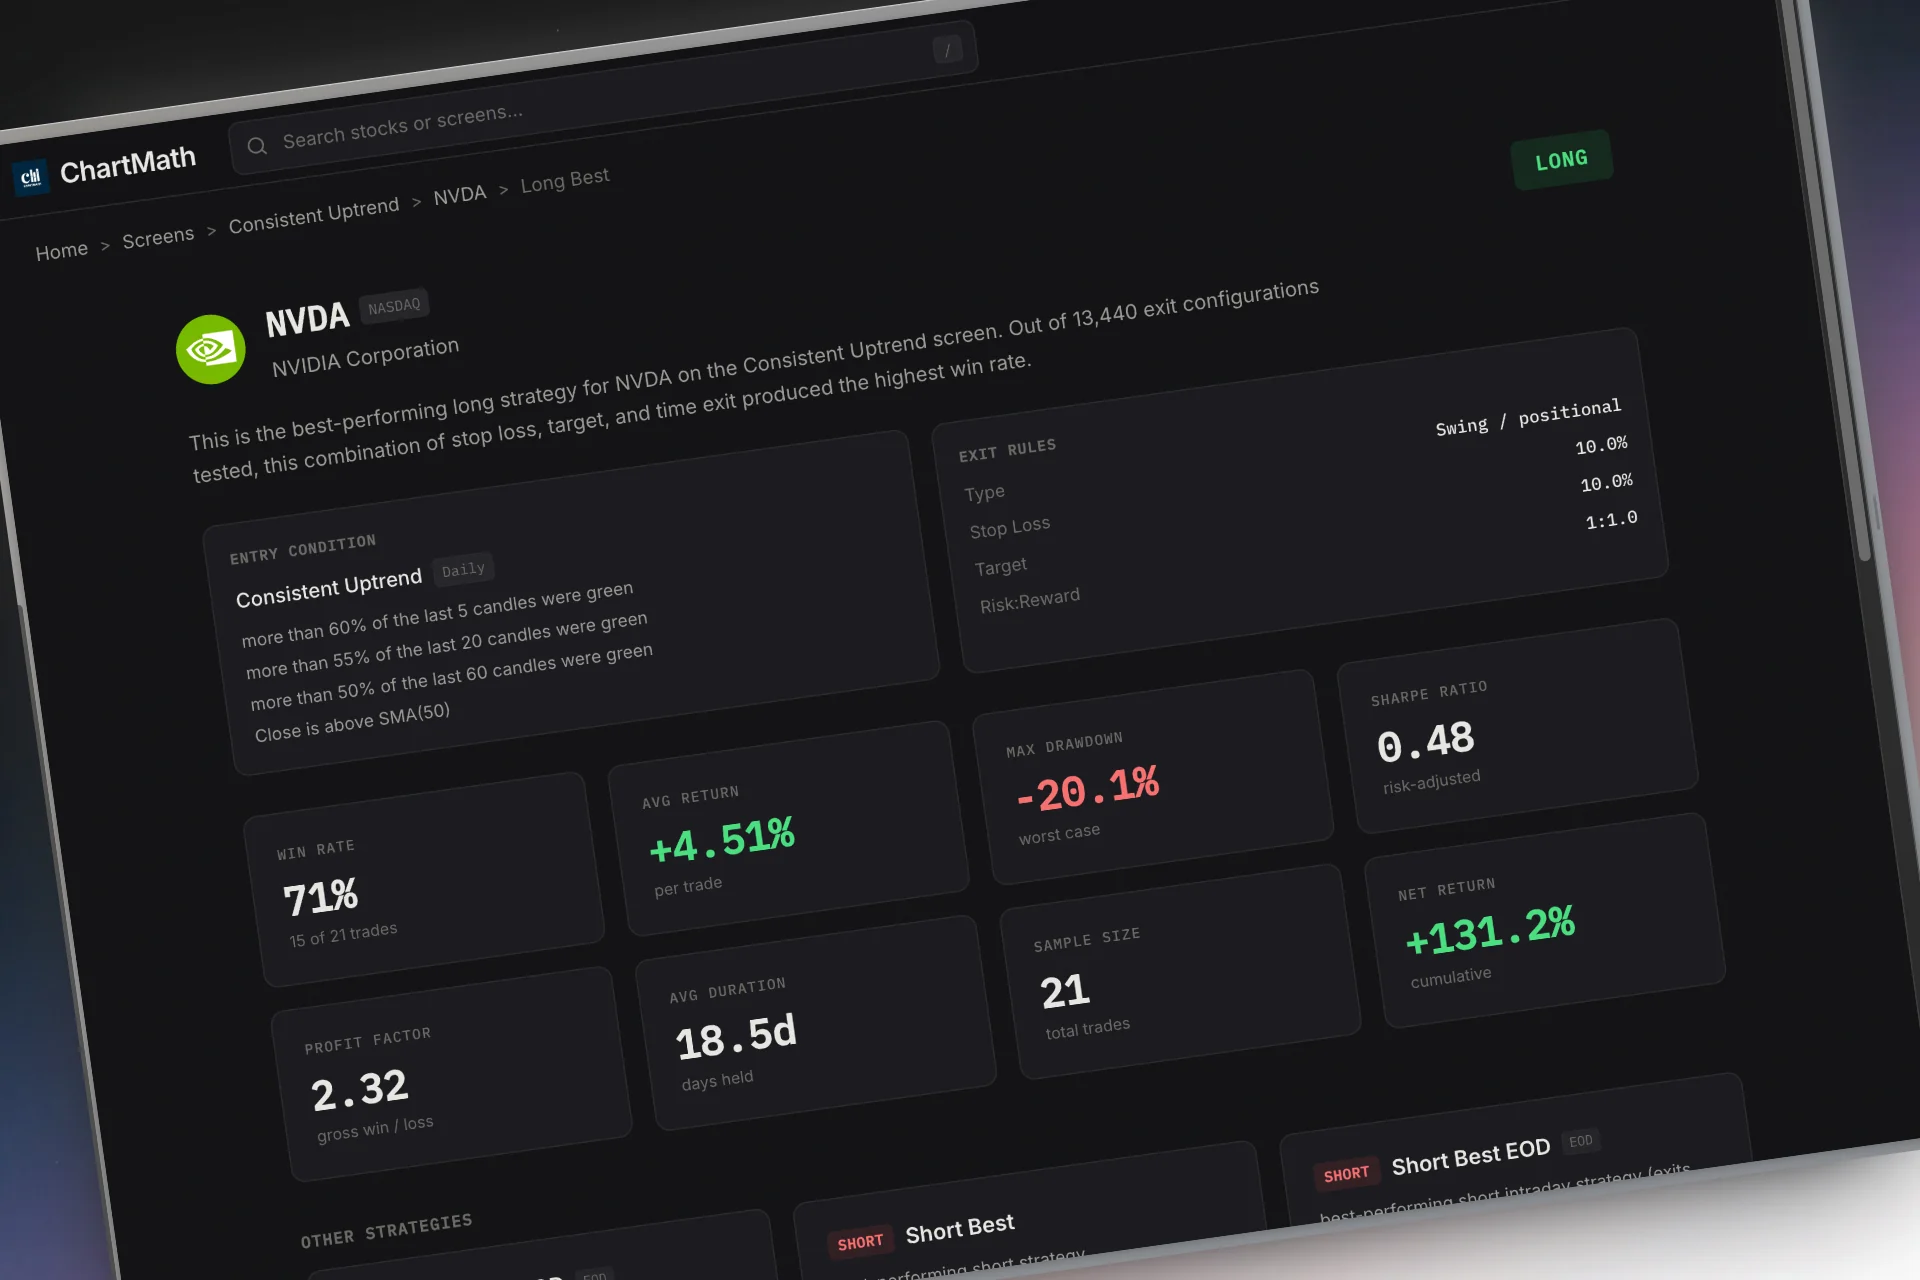
A gut-feel momentum trade relies on you correctly remembering how similar setups played out in the past, across dozens of trades, without any of it written down. That's not a knock on your memory, it's just not how humans track statistics. A backtested screen replaces that memory with a number: a Win Rate and an Avg. Return, computed against a named sample size, on a bounded universe you can check yourself.
That number comes with real limits worth stating plainly. ChartMath's backtests use bar-close entries with no look-ahead, and they don't yet model commissions or slippage. That means the actual result of a live trade will differ somewhat from the backtested figure, and a high win rate on its own still doesn't guarantee a profitable trade if your position sizing or exit discipline is off. The value isn't certainty, it's evidence: a documented, recomputable track record instead of a vague sense that "this pattern usually works."
Compare that to how most retail traders currently validate a setup, by watching a Discord or Telegram channel post a ticker with no attached history, no win rate, no sample size, just an entry price and a promise. Reading a trading signal before you risk money means asking what rule generated it and how often that rule has worked historically, questions a tip in a group chat usually can't answer. A curated screen can.
You can browse the full catalog yourself, no sign-up required, at the read-only screener at chartmath.com/screens, and see the Win Rate, Avg. Return, and matched-instrument count for momentum screens like RVOL spikes, VWAP reclaims, and relative strength leaders before you ever commit to a trade.
Frequently Asked Questions
What is relative volume (RVOL) in day trading and swing trading?
RVOL compares a stock's current trading volume to its typical volume at the same point in the session, expressed as a multiple like 2x or 3x. High RVOL on a breakout suggests real participation behind the move, rather than a quiet drift that could reverse just as easily.
How do I trade stocks with a day job without missing entries?
Build a bounded watchlist tied to backtested screens, set push and email alerts on the specific setups you track, and run a fixed routine: a premarket check, silence during work hours unless something actually fires, and an evening or weekend review. The scan runs while you're unavailable; you decide when you're free to look.
Is ChartMath a Trade Ideas or Finviz alternative for swing traders?
ChartMath is a mobile-first trade discovery copilot. It scans a curated universe of 500+ US equities, 100 crypto pairs, and 11 US futures across 200+ read-only screens, and unlike a static screener, every screen carries a backtested Win Rate and Avg. Return you can check against a stated sample size. It doesn't place trades or connect to a broker, you keep the final call.
Does a high win rate guarantee a profitable trade?
No. A win rate is historical evidence, not a promise. It tells you how a rule performed on past occurrences within a stated sample, using bar-close entries that don't account for commissions or slippage. Position sizing, risk management, and market conditions still determine whether any individual trade works out.
Run This on Your Own Ticker
The next time a stock catches your eye, don't just glance at the 5-minute chart and guess. Check its RVOL, its multi-day rate of change, and its relative strength against the index, then see whether a comparable screen has a documented track record. You can start right now with the web-based screener at chartmath.com/screens, no account needed, just the screens, their Win Rate, and their Avg. Return laid out plainly.
If you want the alerts to reach you the moment a favorited screen matches, without refreshing anything during your workday, download the ChartMath app and set up your watchlist tonight. Or if you'd rather see the discovery-to-alert flow first, watch a quick demo before you commit your first ticker to a screen. Either way, the goal is the same: swing trading momentum stocks without watching charts all day, because the scan is already running whether you're at your desk or in a meeting that won't end.

See these setups live in ChartMath
200+ curated screens with backtest data. Free. No credit card required.