How to Scan for Crypto Breakouts in Real Time
Crypto doesn't wait for you. A breakout on BTC can start at 2:47 AM, run 8% by the time you wake up, and look like a completely different chart by the time you open your app. For traders who aren't glued to screens around the clock, that's not a minor inconvenience — it's the whole problem.
The answer isn't to watch more charts. It's to stop watching charts manually and let a systematic scanner do it for you. This guide walks through exactly how to scan for crypto breakouts in real time: which setups to look for, how backtested screens filter out noise, and how push alerts let you act on a setup without staring at 100 pairs all day.
Why Manual Chart-Watching Fails Crypto Traders
Stock traders have it relatively easy. The NYSE and Nasdaq open at 9:30 AM ET and close at 4:00 PM ET. You can build a pre-market routine, scan before the open, and check in at lunch. Crypto has no such schedule. It trades 24 hours a day, seven days a week, across dozens of pairs simultaneously.
Manual chart-watching across 100 pairs is not a workflow. It's a second job with no pay and no sleep. Even if you narrow your watchlist to 10 pairs, you're still making a judgment call about which 10 to watch — and the breakout will often happen on the one you skipped.
The other common approach is Discord or Telegram signal groups. The appeal is obvious: someone else does the scanning and posts the call. The problem is that those calls are unvalidated. There's no documented Win Rate. There's no Average Return. You have no idea whether the setup has historically worked 30% of the time or 70% of the time. You're trading someone else's gut feeling, often after the entry has already moved.
A systematic scanner solves both problems. It watches every pair against every screen every minute, fires a push alert the moment a setup forms, and shows you the screen's historical Win Rate and Average Return before you decide whether to act. That's the difference between reacting to noise and trading with evidence.
What a Crypto Breakout Actually Looks Like (Technically)
Before you can scan for crypto breakouts, you need a precise definition. "Breakout" gets used loosely, sometimes it means any upward move, which is not useful. For scanning purposes, a breakout is a specific, rule-based event that a screen can detect and backtest.
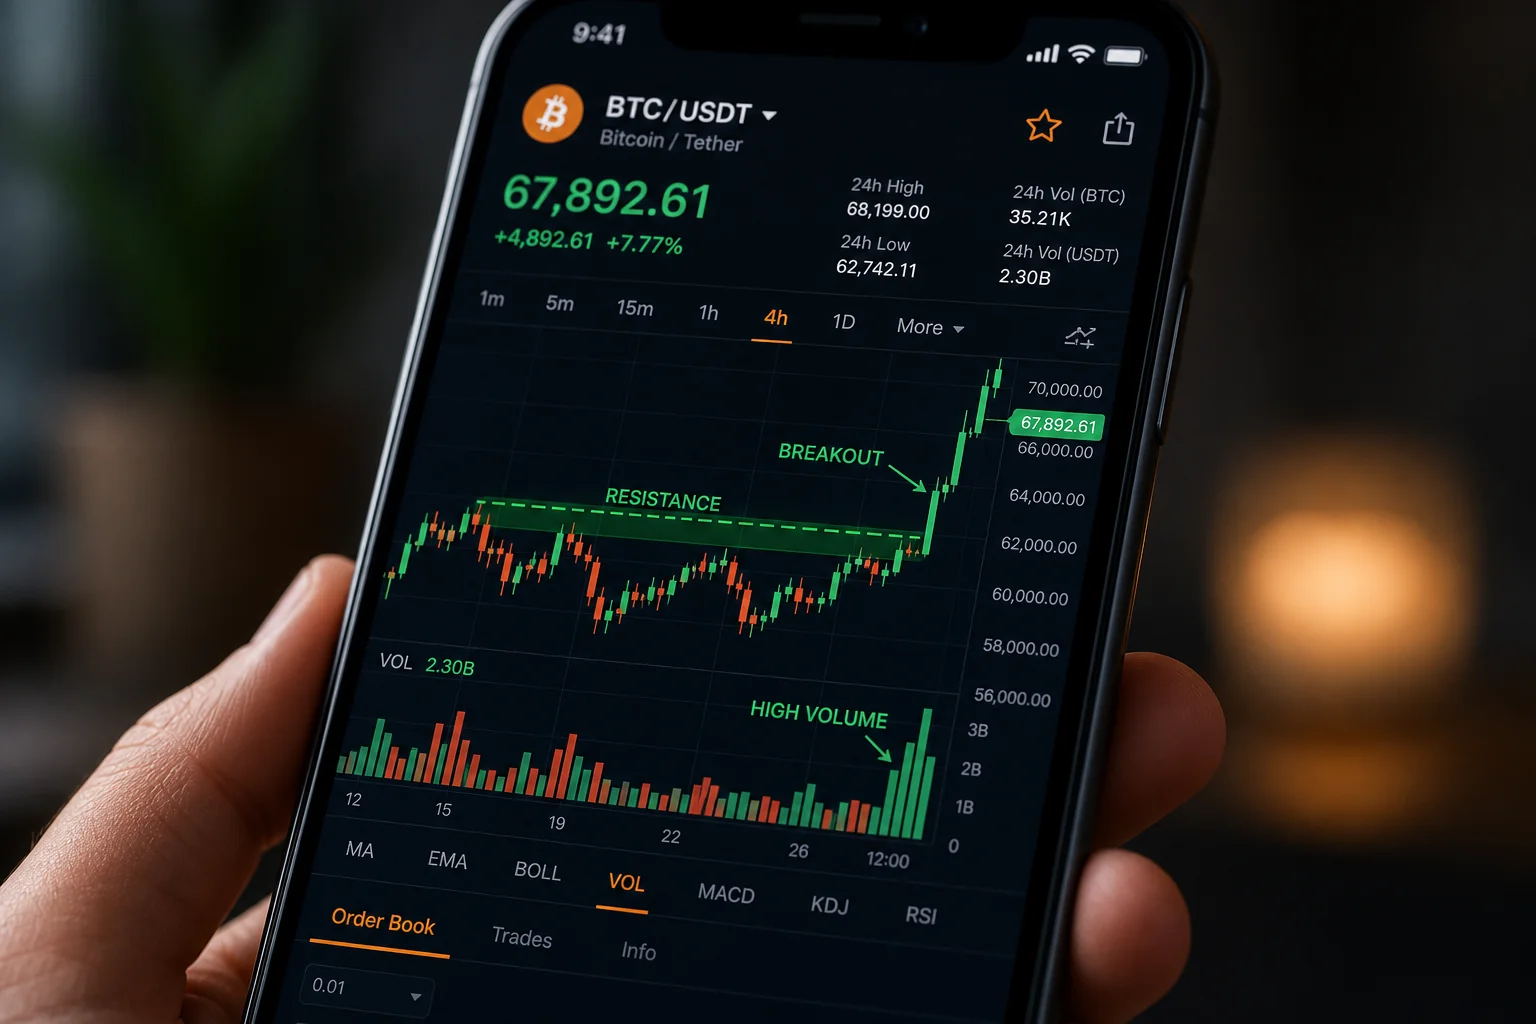
The Core Breakout Setups Worth Scanning For
Range breakout: Price has been consolidating in a tight range for a defined number of bars. It then closes above the upper boundary of that range, ideally on elevated volume. The screen defines "tight range" and "upper boundary" precisely, not loosely.
Momentum continuation: Price is already in an uptrend and makes a new high relative to a lookback period. The setup is not a reversal; it's a continuation of existing strength. These tend to work well on higher timeframes (Daily, Weekly) where the trend has more structural support.
RVOL spike: Relative volume (RVOL) measures current volume against the average for that time of day and timeframe. A breakout on 2x or 3x RVOL is more meaningful than the same price move on flat volume. Screens that require elevated RVOL filter out a large percentage of fakeouts. For a deeper look at how RVOL works in practice, see Volume Analysis for Day Traders: How to Use RVOL and Volume Spikes.
VWAP reclaim: Price dips below VWAP, then reclaims it on volume. This is a short-term momentum reset that often precedes a continuation move. It works on intraday timeframes (1h, 15m) and is particularly useful for crypto because of how frequently crypto pairs oscillate around VWAP during active sessions. For more on this setup, VWAP Trading: How to Use Volume-Weighted Average Price covers the mechanics in detail.
Why Timeframe Matters for Crypto Breakouts
A 1-minute breakout on ETH is a very different trade from a Daily breakout on BTC. The 1-minute setup might last 10 minutes. The Daily setup might run for days. Neither is inherently better, but they require different approaches: different position sizes, different hold times, different risk management.
For swing traders with a day job, the 1h and Daily timeframes tend to be more practical. The setups form more slowly, give you time to verify before entering, and don't require you to be watching a screen every minute. For active day traders, the 1m, 5m, and 15m timeframes are where the action is, but they demand faster reaction times and tighter stops.
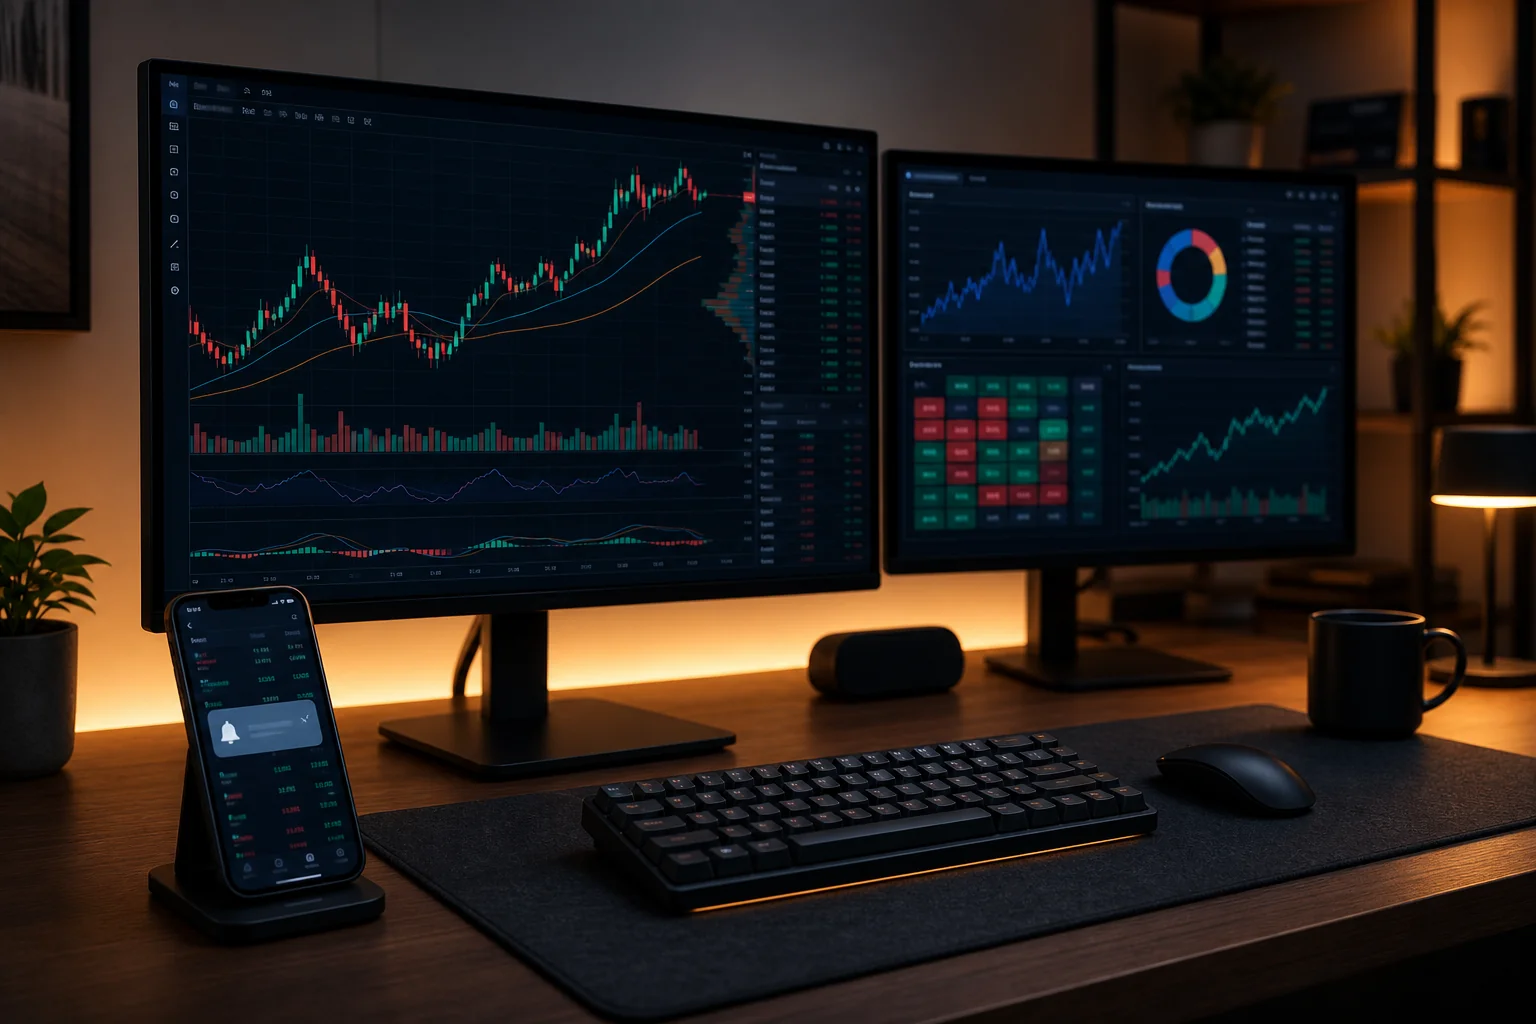
How a Real-Time Crypto Scanner Works
A real-time scanner is not a chart you refresh. It's a system that continuously evaluates every instrument in its universe against every screen in its library, and fires an alert the moment a match occurs. You don't pull the data, the data comes to you.
ChartMath's screener covers 100 crypto pairs alongside 500+ US equities and 11 US futures, across 200+ curated, backtested technical screens and 7 timeframes (1m, 5m, 15m, 1h, Daily, Weekly, Monthly). Every screen in the library has been backtested before it ships. Only screens with a verified track record make it into the app.
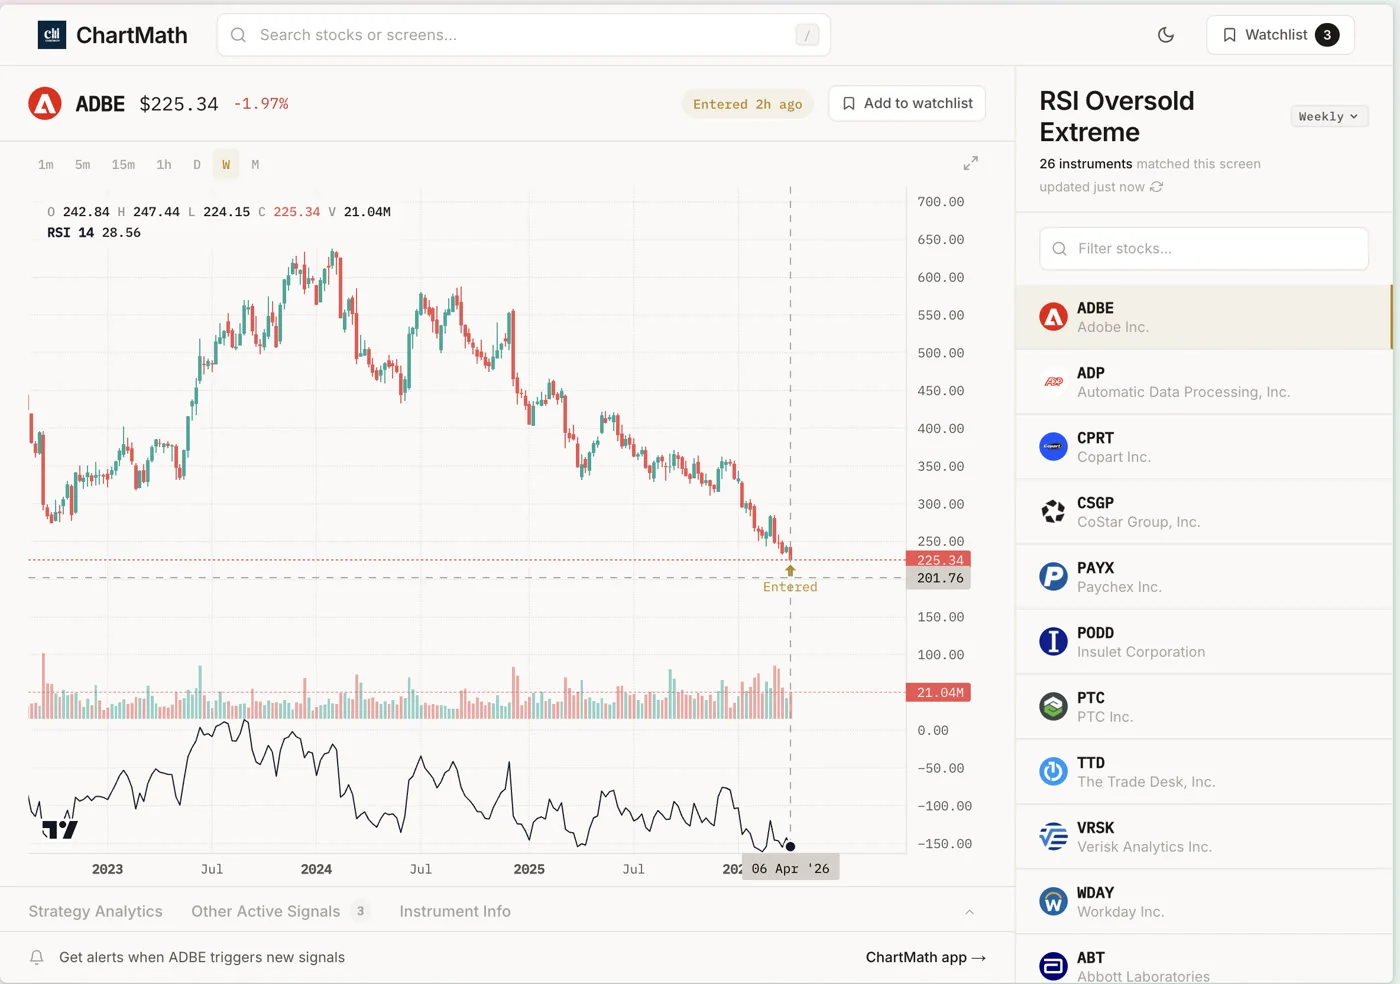
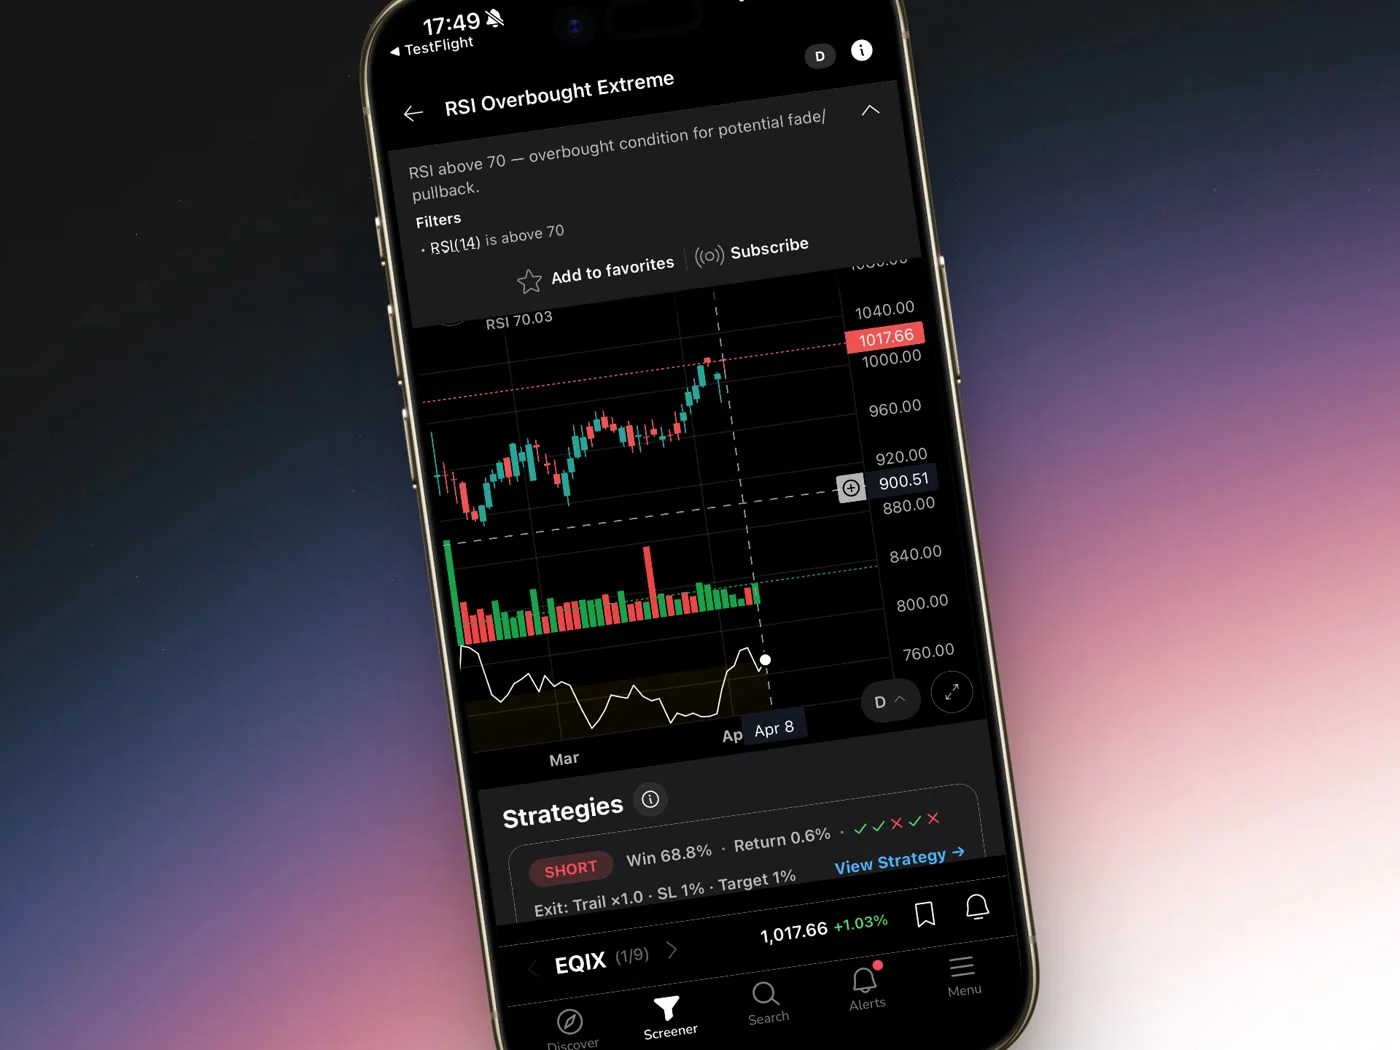
The key distinction from a static screener like Finviz is that ChartMath doesn't wait for you to run a scan. It runs continuously. When a crypto pair enters a screen, a push alert fires to your phone. The alert includes the pair name, the timeframe, the screen name, and the screen's filter rules in plain English, so you know exactly what conditions triggered it.
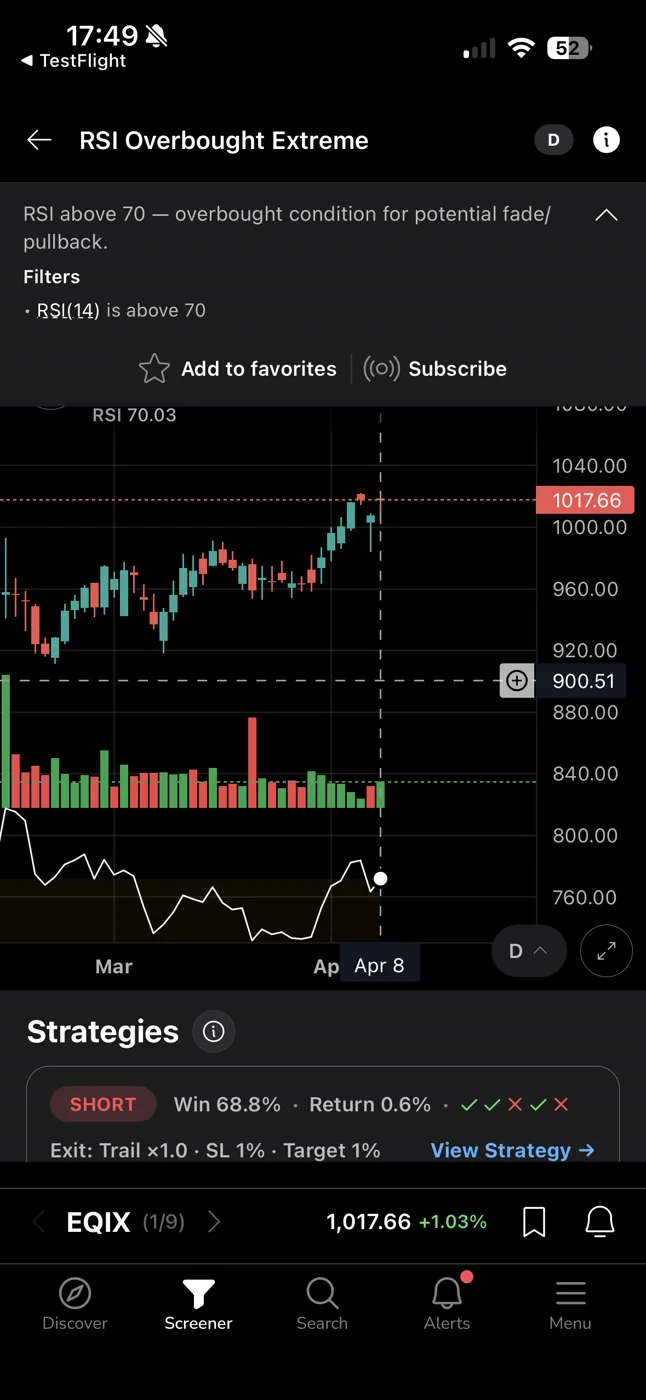
Each screen also shows its historical Win Rate and Average Return. These are backtested figures based on past occurrences of the same setup, not a forecast or a guarantee. But they give you something most retail tools don't: a documented edge to evaluate before you risk capital.
The scanner watches 100 crypto pairs against 200+ screens every minute. You get a push alert when something matches. You decide whether to trade it. That's the workflow.
1. Choose the Right Breakout Screens for Crypto
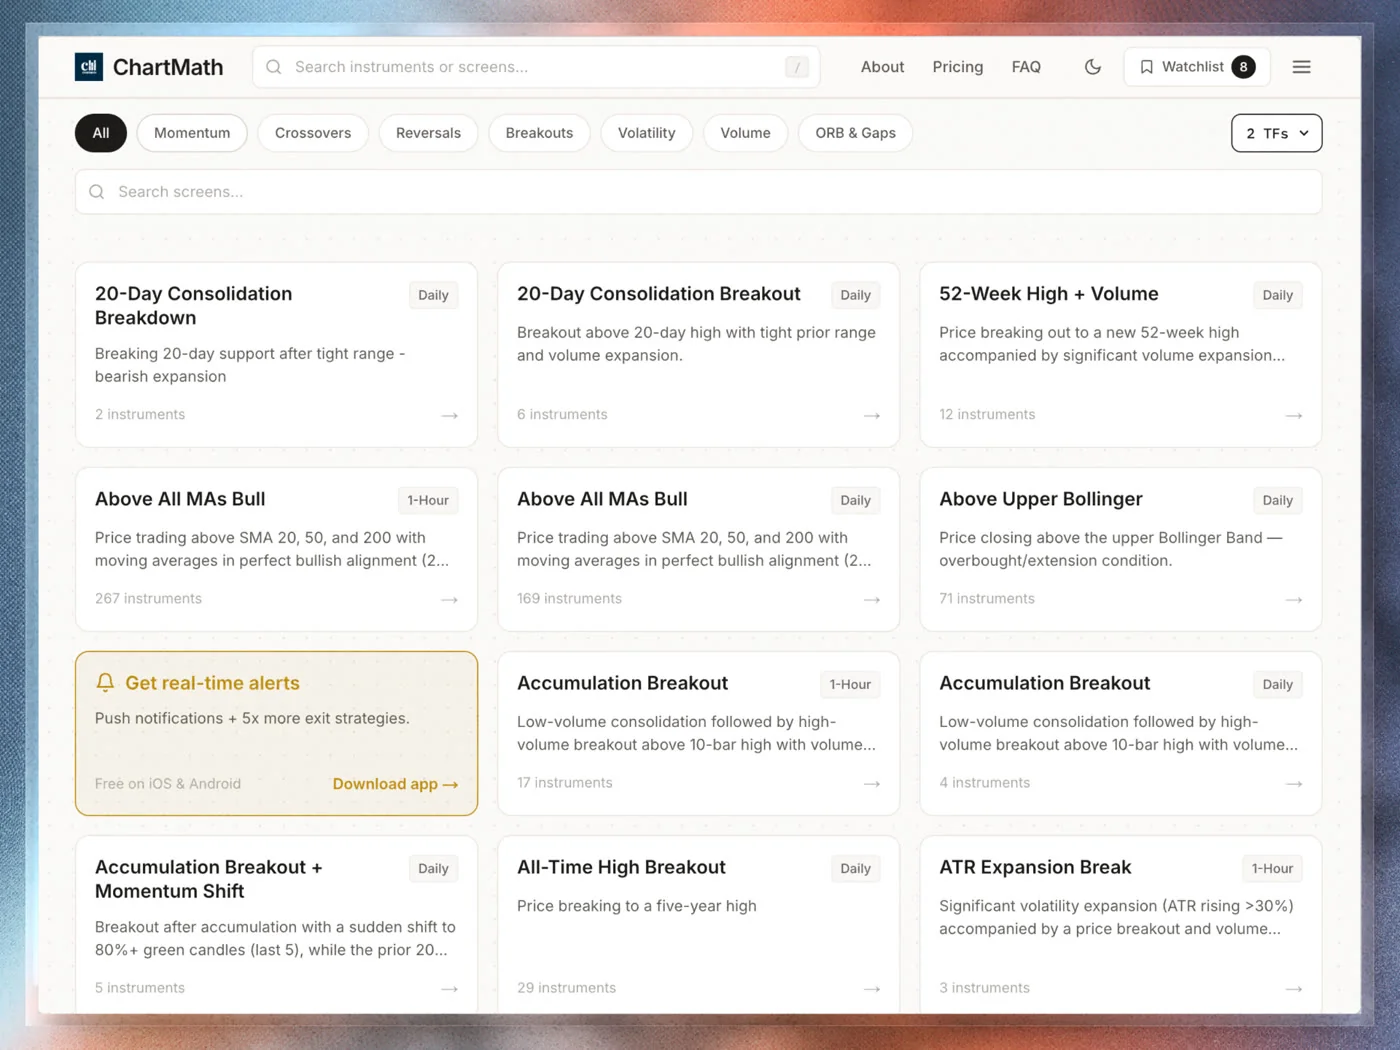
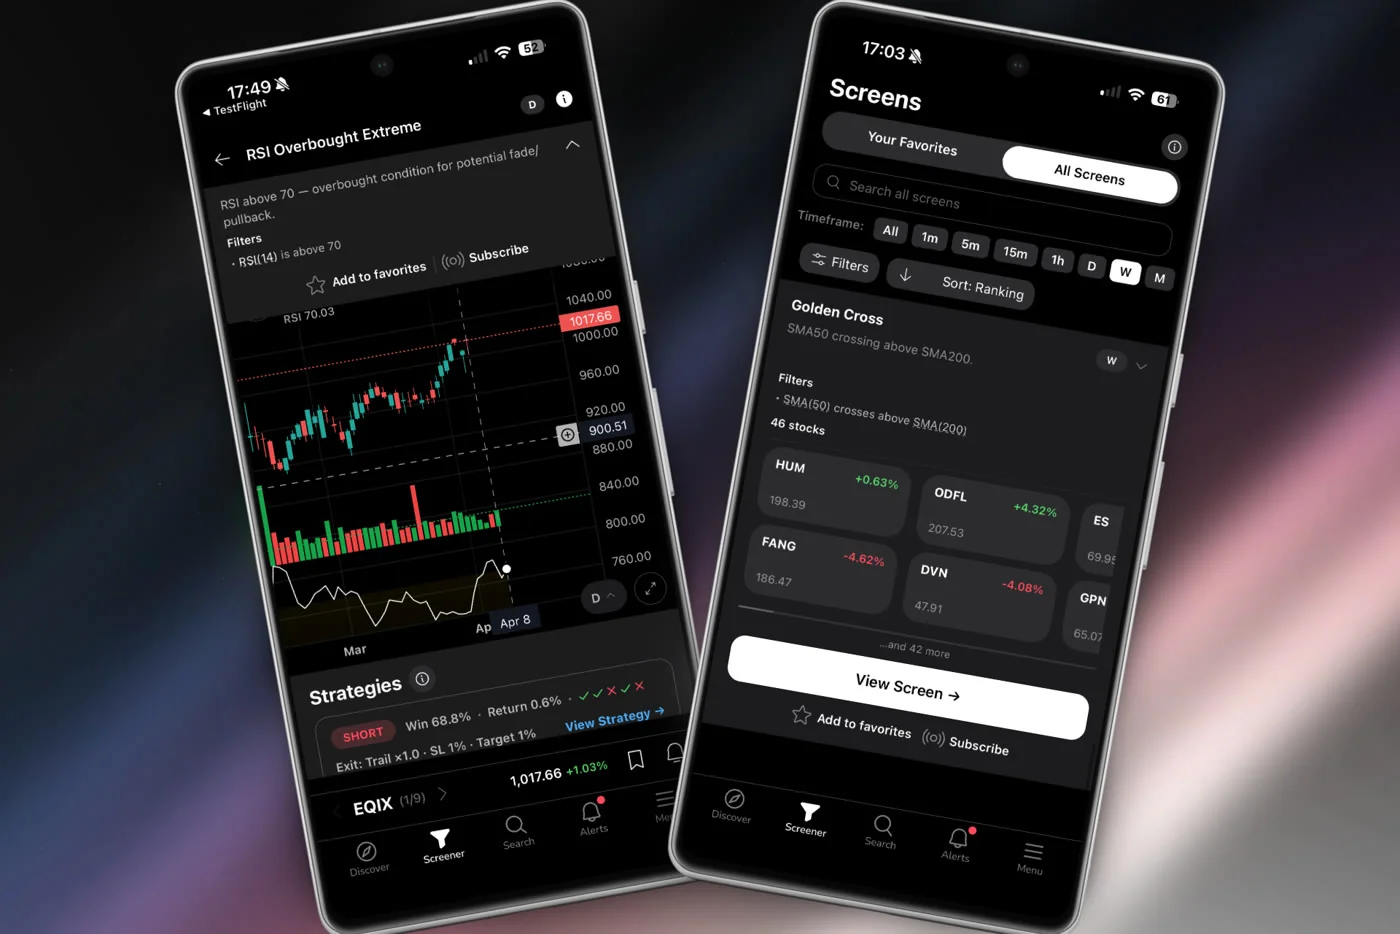
The first step is selecting which screens to follow. ChartMath has 200+ curated, read-only screens, you don't build them, you browse and favorite them. That's intentional: every screen in the library has already been backtested, so you're not starting from scratch with an untested filter set.
For crypto breakout scanning specifically, focus on screens in these categories:
- Breakout screens: Look for setups that require price to clear a defined level (range high, resistance zone, multi-week high) with a volume condition attached. Volume confirmation is what separates a real breakout from a low-liquidity drift.
- Momentum screens: These capture pairs already in motion, new highs relative to a lookback period, consecutive up-closes, or price above a key moving average on elevated RVOL.
- VWAP reclaim screens: Useful for intraday crypto setups. Price reclaims VWAP after a dip, signaling that buyers have reasserted control.
- Low volatility compression screens: Price compresses into a tight range before a potential expansion. These are leading setups, the breakout hasn't happened yet, but the conditions for one are forming.
Before you favorite a screen, look at two numbers: the Win Rate and the Average Return. A screen with a high Win Rate but a low Average Return might not be worth the risk. A screen with a moderate Win Rate but a strong Average Return might have excellent expected value. Both numbers together tell you more than either one alone.
Also read the screen's filter rules. Understanding what conditions must be true before an alert fires is what separates systematic trading from blind signal-following. If you can't explain why the setup should work, you won't have the conviction to hold it when it moves against you briefly.
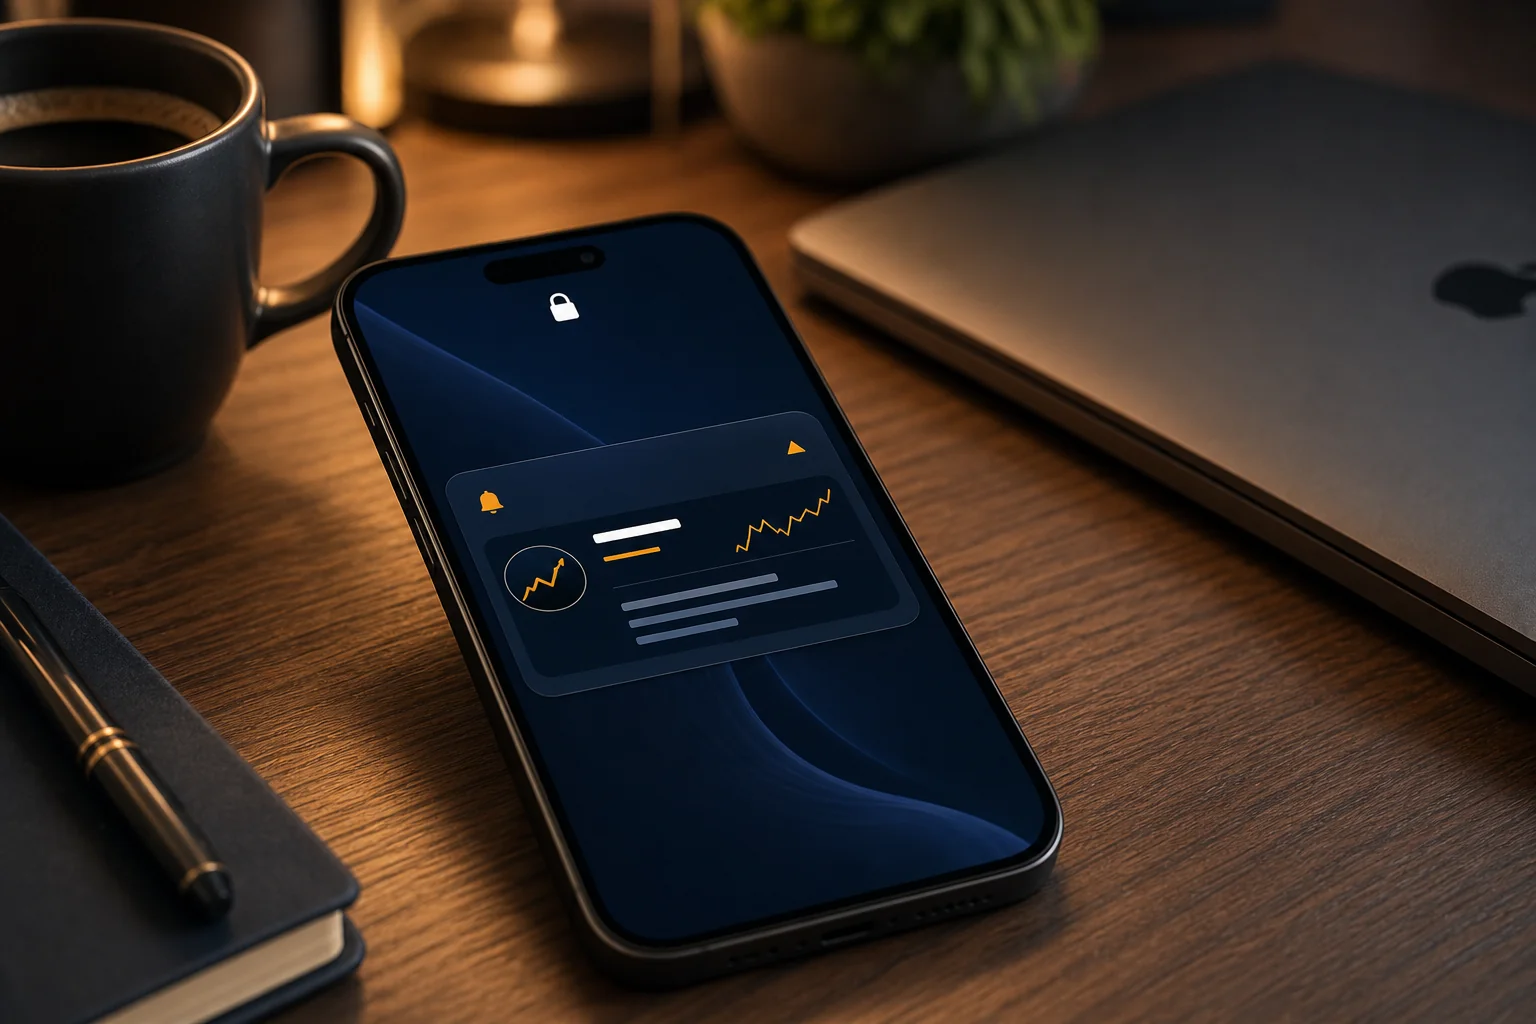
2. Set Up Push Alerts on Your Crypto Screens
Once you've identified the screens you want to follow, favoriting them activates push alerts. From that point, ChartMath monitors those screens across all covered crypto pairs continuously. When a pair enters a screen, your phone gets a push notification.
A few things worth knowing about how the alerts work:
- Alert channels: Push notifications only. No SMS, no email. The alert goes to your phone via the iOS or Android app.
- Alert payload: The notification includes the pair name, the timeframe, the screen name, and the screen's filter rules. You know immediately what fired and why the screen triggered.
- Notification hygiene: ChartMath de-duplicates alerts and applies throttling so you're not getting pinged every 30 seconds on the same setup. Per-bar caps and timezone-aware quiet hours keep the noise manageable.
- Deep link: Tapping the alert takes you directly to the setup card in the app, where you can see the Win Rate, Average Return, and sample size before deciding anything.
Alert fatigue is a real problem with most screeners. When every alert looks the same and none of them have a documented edge, you either ignore them all or chase them all, neither is good. The combination of backtested screens and notification hygiene is what makes the alerts actionable rather than just noisy. For more on managing alert volume systematically, see How to Avoid Alert Fatigue From Stock Screeners.
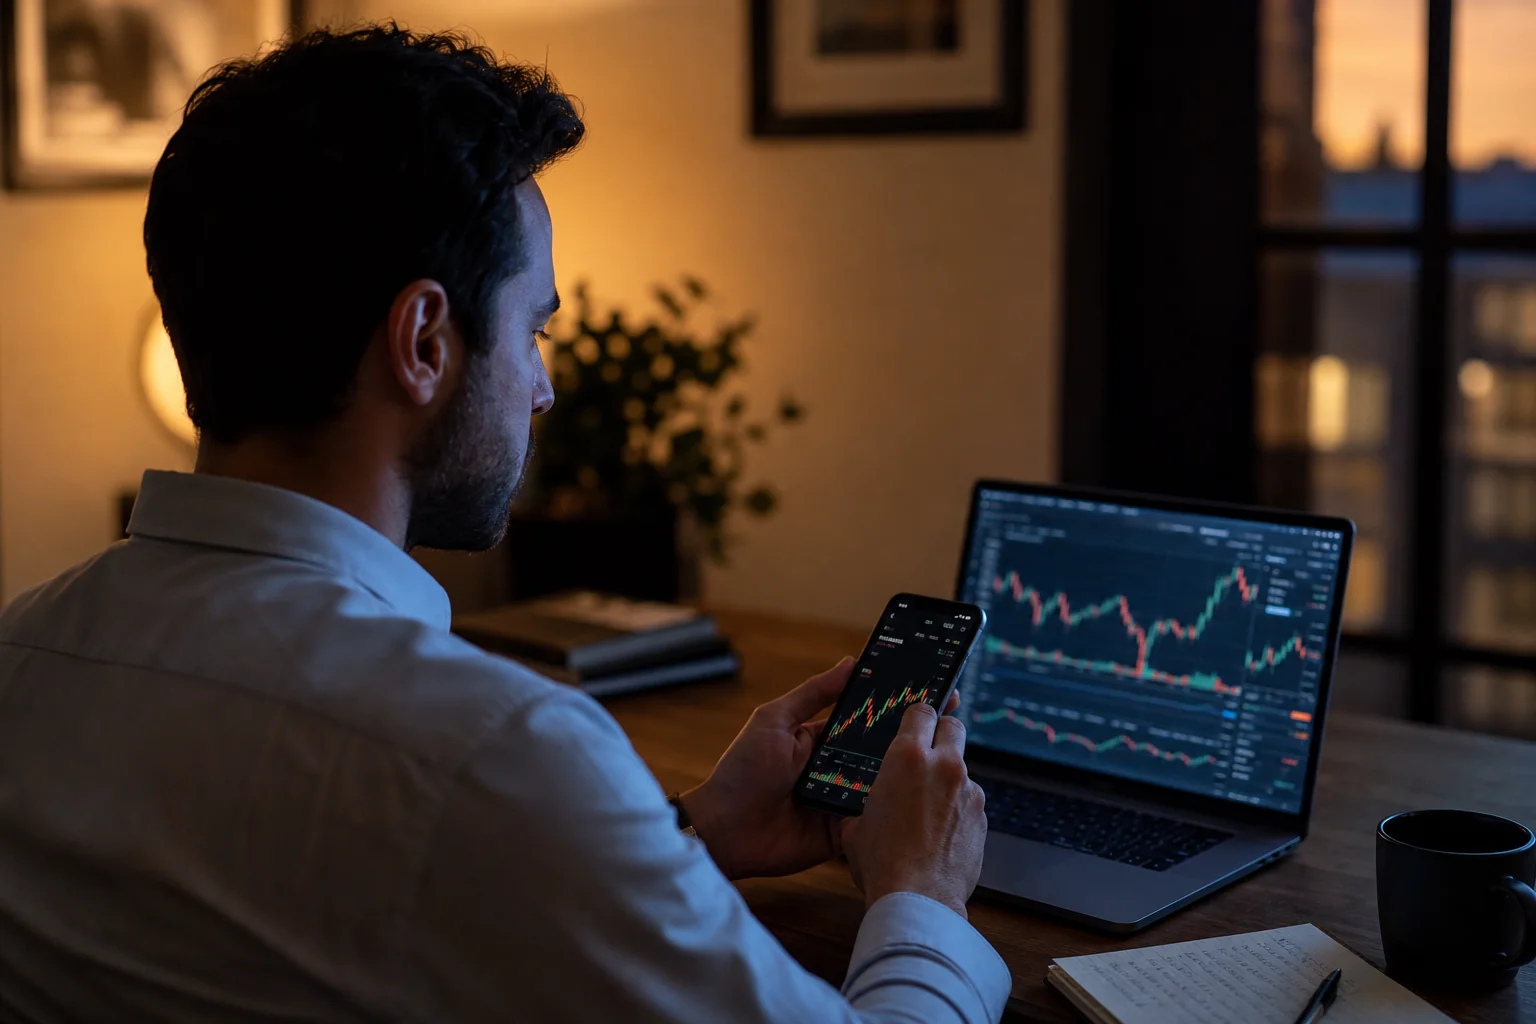
3. Verify the Setup Before You Trade
An alert is not a trade. It's a signal to look. This distinction matters more in crypto than almost anywhere else, because crypto moves fast and fakeouts are common. The alert tells you a setup has formed. Your job is to verify it before you risk capital.
Here's a practical verification checklist:
- Open the setup card. Check the Win Rate, Average Return, and sample size. A screen with 12 historical occurrences is not statistically meaningful. Look for screens with a larger sample before sizing up.
- Read the filter rules. The screen description tells you exactly what conditions triggered the alert. Confirm those conditions make sense given the current market environment. A breakout screen firing during a broad crypto selloff deserves more skepticism than the same screen firing during a trending market.
- Cross-reference on your charting platform. ChartMath is a copilot, not an autopilot. It surfaces the setup; you verify it. Pull up the pair on TradingView or whatever charting tool you use. Does the chart look clean? Is the breakout level obvious? Is volume confirming?
- Check RVOL. Is volume elevated relative to the norm for this pair and timeframe? A breakout on flat volume is a much weaker signal than the same price action on 2x+ RVOL.
- Size appropriately. ChartMath has no broker connection and places no orders. You execute in your own brokerage. Before you enter, know your stop level and position size. The setup card gives you the historical edge; your risk management determines whether that edge translates to a good trade for your account.
This three-step flow, Discover, Verify, Trade, is the core workflow. The scanner handles the discovery. You handle the judgment. That's the right division of labor.
4. Build a Watchlist and Run Targeted Crypto Scans
Beyond broad screen alerts, ChartMath lets you add specific crypto pairs to your watchlist. The scanner then runs all 200+ screens against those pairs every minute, so you get alerts specifically on the pairs you care about most.
This is useful when you have a thesis on a specific pair. Say you've been watching ETH consolidate for two weeks and you think a breakout is coming. Add it to your watchlist. Now every breakout, momentum, and RVOL screen in the library is watching ETH for you. When the setup forms, you get the alert.
ChartMath has one watchlist (synced on mobile, browser-local on web). Keep it focused. A watchlist with 40 pairs generates a lot of alerts and dilutes your attention. A watchlist with 8-12 high-conviction pairs gives you targeted coverage without overwhelming your notification feed.
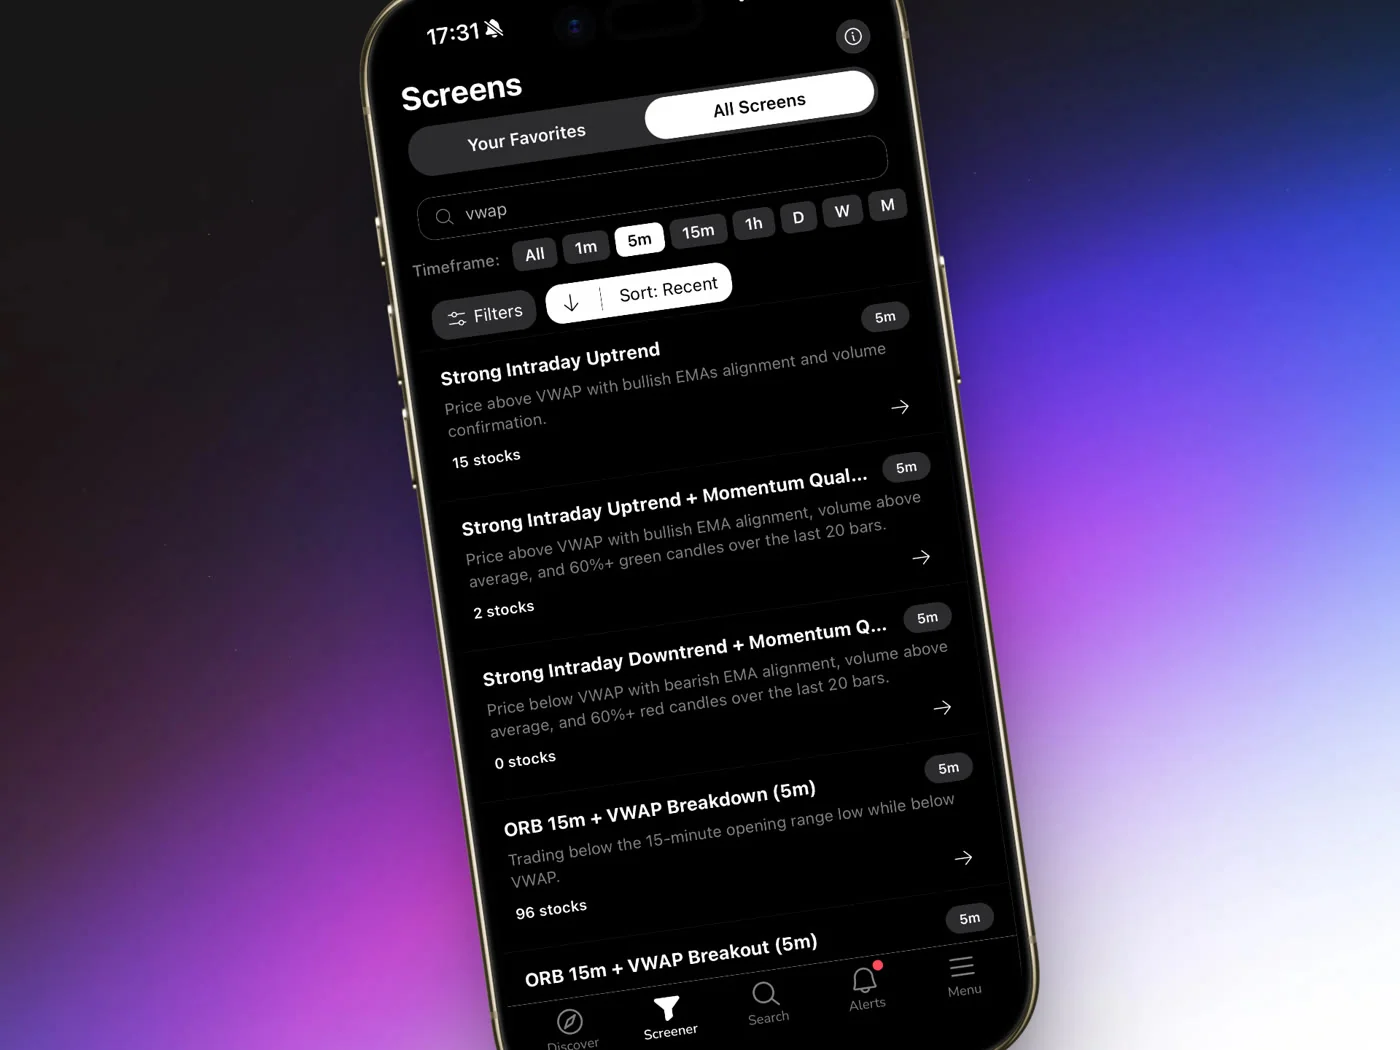
You can also use the Screener tab to browse which crypto pairs are currently matching a given screen. This is useful for end-of-day review: open a breakout screen, see which pairs are in it right now, and build your shortlist for the next session. For a structured approach to this kind of workflow, Daily Chart Swing Trade Setups: A Scanner Workflow walks through the process in detail.
Common Mistakes When Scanning for Crypto Breakouts
A scanner is a tool. Like any tool, it can be used well or poorly. These are the mistakes that show up most often:
Chasing every alert without checking the Win Rate
The alert tells you a setup formed. It doesn't tell you whether that setup has historically worked. Before you act on any alert, open the setup card and check the Win Rate and Average Return. If you're not doing that, you're trading blind, just with more sophisticated noise.
Over-indexing on short timeframes
1-minute and 5-minute breakouts in crypto are real, but they're also the most prone to fakeouts and require the fastest execution. For traders who aren't watching screens all day, the 1h and Daily timeframes give you more time to verify and more follow-through when the setup works. Start with higher timeframes and work down as you get comfortable with the workflow.
Treating the alert as the trade
ChartMath is a copilot. It surfaces setups. You decide. An alert that fires at 2 PM while you're in a meeting is not a trade you need to take immediately. Check it when you can, verify the setup, and enter only if the conditions still hold. Missing a move is better than entering a setup you haven't verified.
Ignoring sample size
A screen with a 75% Win Rate over 8 historical occurrences is not the same as a screen with a 65% Win Rate over 200 occurrences. Small sample sizes produce unreliable statistics. Pay attention to the sample size on every screen you consider acting on. More occurrences means more confidence in the historical edge.
Favoriting too many screens at once
If you favorite 50 screens across 100 crypto pairs, you will get a lot of alerts. Most of them will be irrelevant to your current focus. Start with 5-8 screens that match your trading style and timeframe preference. Add more as you develop a feel for which screens produce setups you actually want to trade.
Frequently Asked Questions
Which crypto pairs does ChartMath cover?
ChartMath covers 100 crypto pairs. The focus is on the most liquid and widely traded pairs. Crypto coverage is secondary to the US equities universe (500+ stocks), but the same backtested screen infrastructure applies to all covered pairs.
How often does the scanner update?
The scanner runs continuously across all 7 timeframes. On the 1-minute timeframe, that means a new scan every minute. On the Daily timeframe, it updates at bar close. Push alerts fire the moment a pair enters a screen.
Can I build my own crypto breakout screen?
No. ChartMath's screens are curated and read-only. There is no screen builder and no Pine Script. The 200+ screens in the library have all been backtested before shipping. The trade-off is that you can't customize them, but you also don't need to build or validate anything from scratch. For traders who want to understand what that means in practice, Stock Scanner Without Pine Script: 200+ Ready-Made Screens covers the approach in detail.
Does ChartMath place trades automatically?
No. ChartMath has no broker connection and places no orders. It is a trade-discovery copilot: it surfaces setups, shows you the historical Win Rate and Average Return, and sends you a push alert. You decide whether to trade and execute in your own brokerage. There is no auto-trading, no bots, and no automated execution of any kind.
Is ChartMath free to use?
ChartMath is a paid product with a 14-day free trial (no credit card to start). After the trial it's $24.99/month founding pricing (locked for 12 months) or $149/year. The founding rate is for early users.
Start Scanning Crypto Breakouts Systematically
Manual chart-watching across 100 crypto pairs is not a strategy. It's a recipe for missed entries, emotional decisions, and exhaustion. A systematic scanner that watches every pair against every screen every minute, and fires a push alert with a documented Win Rate when something matches, is a fundamentally different approach.
ChartMath covers 100 crypto pairs alongside 500+ US equities and 11 US futures, across 200+ backtested screens and 7 timeframes. Start with a 14-day free trial, then $24.99/mo founding (locked 12 months) or $149/yr — no card to start. The workflow is simple: favorite the screens that match your style, get push alerts when a setup forms, verify before you trade, and execute in your own broker.
If you want to see the screen library before downloading, browse the 200+ screens on the web, no sign-in required. When you're ready to get push alerts on your phone, download the ChartMath app for iOS or Android and start scanning crypto breakouts in real time.
Backtested Win Rate and Average Return figures reflect historical screen performance and are not a guarantee of future results. Past performance does not predict future returns. ChartMath is an educational and research tool, not financial advice. Always manage your own risk.

Ankush Jindal
LinkedInSee these setups live in ChartMath
200+ curated screens with backtest data. 14-day free trial.