How to Set Up Stock Screener Alerts on Mobile
Your alarm goes off at 6:45 AM. You check your watchlist, spot two setups forming, and head into the office. By 10:30 AM you're deep in a meeting. At 11:15 AM, one of those setups triggers — clean entry, elevated volume, exactly what you'd been waiting for. You find out at 5:45 PM. The move is already 5% done and fading.
That's not a strategy problem. That's a configuration problem. The fix isn't quitting your job or staring at charts all day. It's knowing how to set up stock screener alerts on mobile so the market comes to you, with enough context to act on it.
This guide walks through the exact steps to configure real-time push alerts inside ChartMath — a mobile-first trade-discovery app built specifically for swing traders who have a day job. Every step is practical. By the end, your phone will notify you the moment a setup forms — with the ticker, screen name, and timeframe on the notification, and the screen's backtested Win Rate one tap away — so you're deciding with evidence instead of guessing.
Why Mobile Alerts Change the Game for Busy Traders
Most retail traders use a screener the same way: they sit down at night, run a scan, build a watchlist, and hope the setup triggers at a convenient time. It rarely does. Setups trigger at 10:43 AM on a Wednesday, not at 8 PM when you're finally free to look.
Static screeners like Finviz are excellent research tools, but they don't push anything to your phone. You have to go to them. That's a fundamental mismatch for anyone who can't monitor charts during market hours.
Real-time mobile alerts flip that relationship. Instead of you checking the market, the market checks in with you. But not all alerts are equal. A raw price alert that says "AAPL crossed $200" tells you almost nothing useful. You still have to open a chart, check the volume, verify the setup, and decide whether it's worth acting on, all while you're supposed to be in a meeting.
A well-configured alert from a backtested screener does more. It tells you:
- Which ticker triggered
- Which technical screen it matched
- The timeframe it fired on
- The screen's filter rules, written in plain English (the same for every stock that enters it)
- The historical Win Rate and Average Return for that screen, one tap away
- A deep link to the full setup card
That's the difference between noise and signal. The rest of this guide shows you how to build that system in ChartMath, step by step.
1. Download ChartMath and Create Your Account
ChartMath is available on iOS and Android. The web version at chartmath.com/screens is a free, read-only browse layer, useful for exploring screens on a larger screen, but alerts and watchlist sync require the mobile app.
Download the app from the App Store or Google Play, then create your account and start a 14-day free trial, no credit card to start. After the trial, ChartMath is $24.99/month founding pricing (locked for 12 months) or $149/year. You get the full product from day one.
Once you're signed in, you'll see five bottom tabs: Discover, Screener, Search, Alerts, and Menu. Each one plays a specific role in the alert workflow, and you'll use all of them during setup.
Note on the web layer: The website lets you browse all 200+ screens and read setup cards without signing in. It's a good way to explore before committing to the app. But push alerts only work through the mobile app, so that's where the real configuration happens.
2. Explore the Screener: 200+ Curated Technical Screens
Tap the Screener tab. You'll see a scrollable library of 200+ pre-built technical screens covering a wide range of setups: momentum breakouts, VWAP reclaims, RSI bounces, volatility compressions, opening range breakouts, and more.
A few things worth understanding about how these screens work:
They're curated, not user-built
ChartMath uses no Pine Script and no coding. You don't build screens from scratch or edit existing ones. Every screen was proposed by internal AI agents, then backtested before it shipped. Only screens with a verified Win Rate make it into the app. That's a meaningful filter, it means you're not browsing a library of untested ideas.
Each screen shows its historical edge
Open any screen and you'll see its Win Rate and Average Return, along with sample size and an equity curve. These are the metrics that matter. They tell you how the setup has performed historically across the 500+ US equities, 100 crypto pairs, and 11 US futures in ChartMath's universe. Use them to decide which screens are worth favoriting.
Timeframes are built in
ChartMath covers 7 timeframes: 1m, 5m, 15m, 1h, Daily, Weekly, and Monthly. Many screens are available across multiple timeframes. A VWAP Reclaim on the 1h chart behaves differently from the same setup on the 15m chart, and the backtested metrics reflect that. Check the timeframe before you favorite a screen, it should match when you're actually able to act on an alert.
If you're a swing trader with a day job, Daily and Weekly screens are often the most practical. If you can check your phone during market hours, 1h and 15m screens open up more opportunities. For a deeper look at how VWAP setups work across timeframes, see VWAP Trading: How to Use Volume-Weighted Average Price.
3. Favorite the Screens That Match Your Strategy
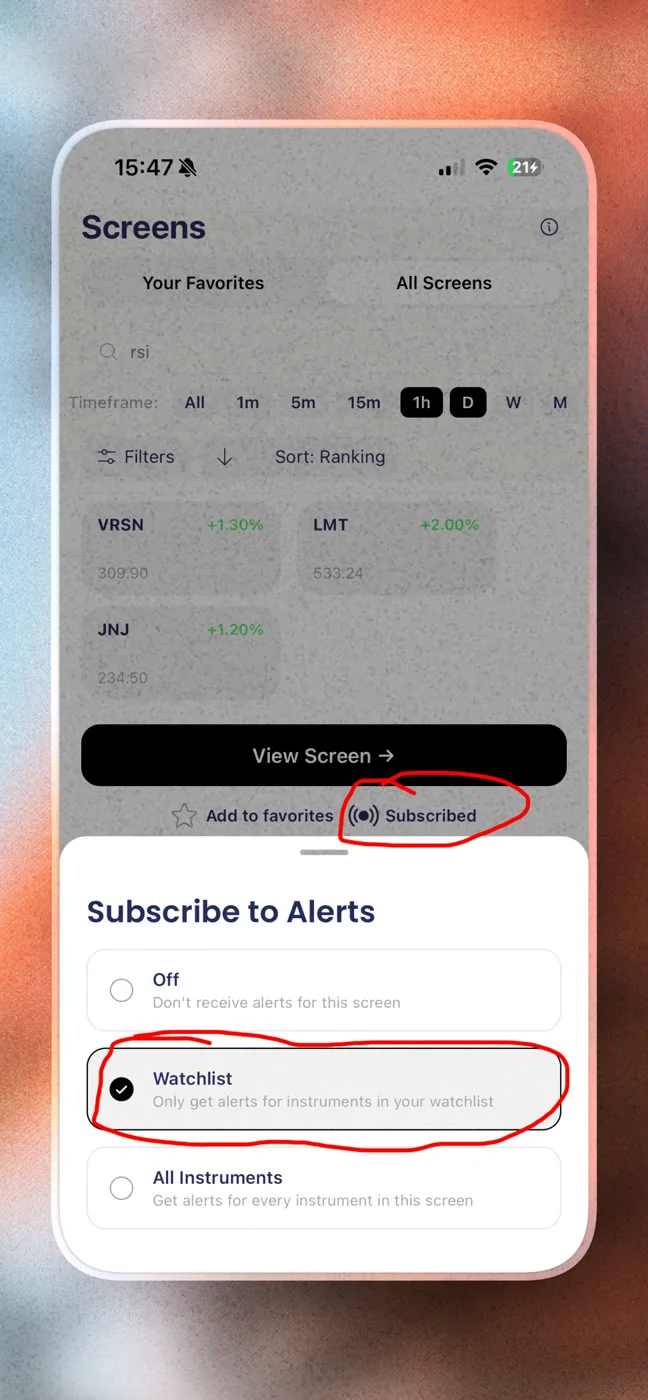
This is the step most traders skip, and it's the most important one. Favoriting a screen is what subscribes you to its alerts. When a ticker enters a screen you've favorited, ChartMath fires a push notification to your phone.
To favorite a screen, open it in the Screener tab and tap the star icon. That's it. From that point on, any time a ticker in ChartMath's universe matches that screen's conditions, you get an alert.
How many screens should you favorite?
Start with three to five. This is the most common mistake new users make: they favorite 20 screens on day one and then complain about too many notifications. Alert fatigue is real, and it's self-inflicted. A smaller set of high-conviction screens gives you fewer, higher-quality alerts that you'll actually act on.
Pick screens that match your trading style. If you trade momentum breakouts, favorite the screens built around volume expansion and price clearing key levels. If you prefer mean-reversion setups, look at RSI bounce and VWAP reclaim screens. If you're a swing trader focused on daily charts, filter for Daily timeframe screens with larger sample sizes, those Win Rate figures are more statistically meaningful.
For a broader look at how to structure your trading workflow around alerts, How to Build an Efficient Trading Workflow in 2026 covers the full picture.
4. Build Your Watchlist and Add Tickers
Tap the Search tab to reach your watchlist. ChartMath gives you one watchlist, server-synced on mobile, so it follows you across your iPhone and Android devices automatically.
Search for any ticker and add it to your watchlist. ChartMath's universe covers 500+ US equities (NYSE and Nasdaq), 100 crypto pairs, and 11 US futures. Once a ticker is on your watchlist, ChartMath scans it against all 200+ screens every minute across all 7 timeframes.
Two types of alerts, two different purposes
Understanding this distinction makes your alert setup much more effective:
- Screen-enter alerts (favorited screens): These fire when any ticker in ChartMath's universe enters a screen you've favorited. Good for discovery, finding setups you weren't already watching.
- Symbol-level alerts (watchlist tickers): These fire when a specific ticker on your watchlist matches a screen. Good for monitoring names you already have conviction on.
Most traders use both. Screen alerts surface new opportunities. Watchlist alerts keep you updated on names you're already tracking. Together, they cover the full range of how a setup might come to your attention.
For guidance on building a watchlist that's worth monitoring, Swing Trading with a Full-Time Job: A Real System walks through how to keep your list focused and actionable.
5. Configure Your Alert Settings
Tap the Alerts tab to manage your notification preferences. This is where you control the volume and timing of what hits your phone.
Enable push notifications
First, make sure ChartMath has permission to send push notifications on your device. Go to your phone's system settings, find ChartMath, and confirm notifications are enabled. Without this step, alerts will queue in the app but won't reach your lock screen.
ChartMath delivers alerts two ways: a push notification to your lock screen and an in-app entry in the Alerts tab. There's no email and no SMS. Push is the fast, real-time channel; the in-app Alerts feed is the log you can scroll back through whenever you want.
Use quiet hours
ChartMath's alert system includes timezone-aware quiet hours. Set your quiet window to cover times when you can't act on a trade anyway, overnight, early morning before the open, or during a block when you know you'll be unavailable. This keeps your notification feed clean and prevents alert fatigue from building up over time.
Built-in notification hygiene
ChartMath handles de-duplication, throttling, and per-bar caps automatically. If the same ticker re-enters the same screen multiple times within a short window, you won't get spammed with repeated alerts. This is a meaningful difference from raw price alert systems, which can fire dozens of times on a volatile ticker without any filtering.
If you've struggled with alert overload from other tools, How to Trade Stocks Without Watching Screen All Day covers the broader strategy for managing signal noise while staying informed.
6. Read the Alert, and Decide With Confidence
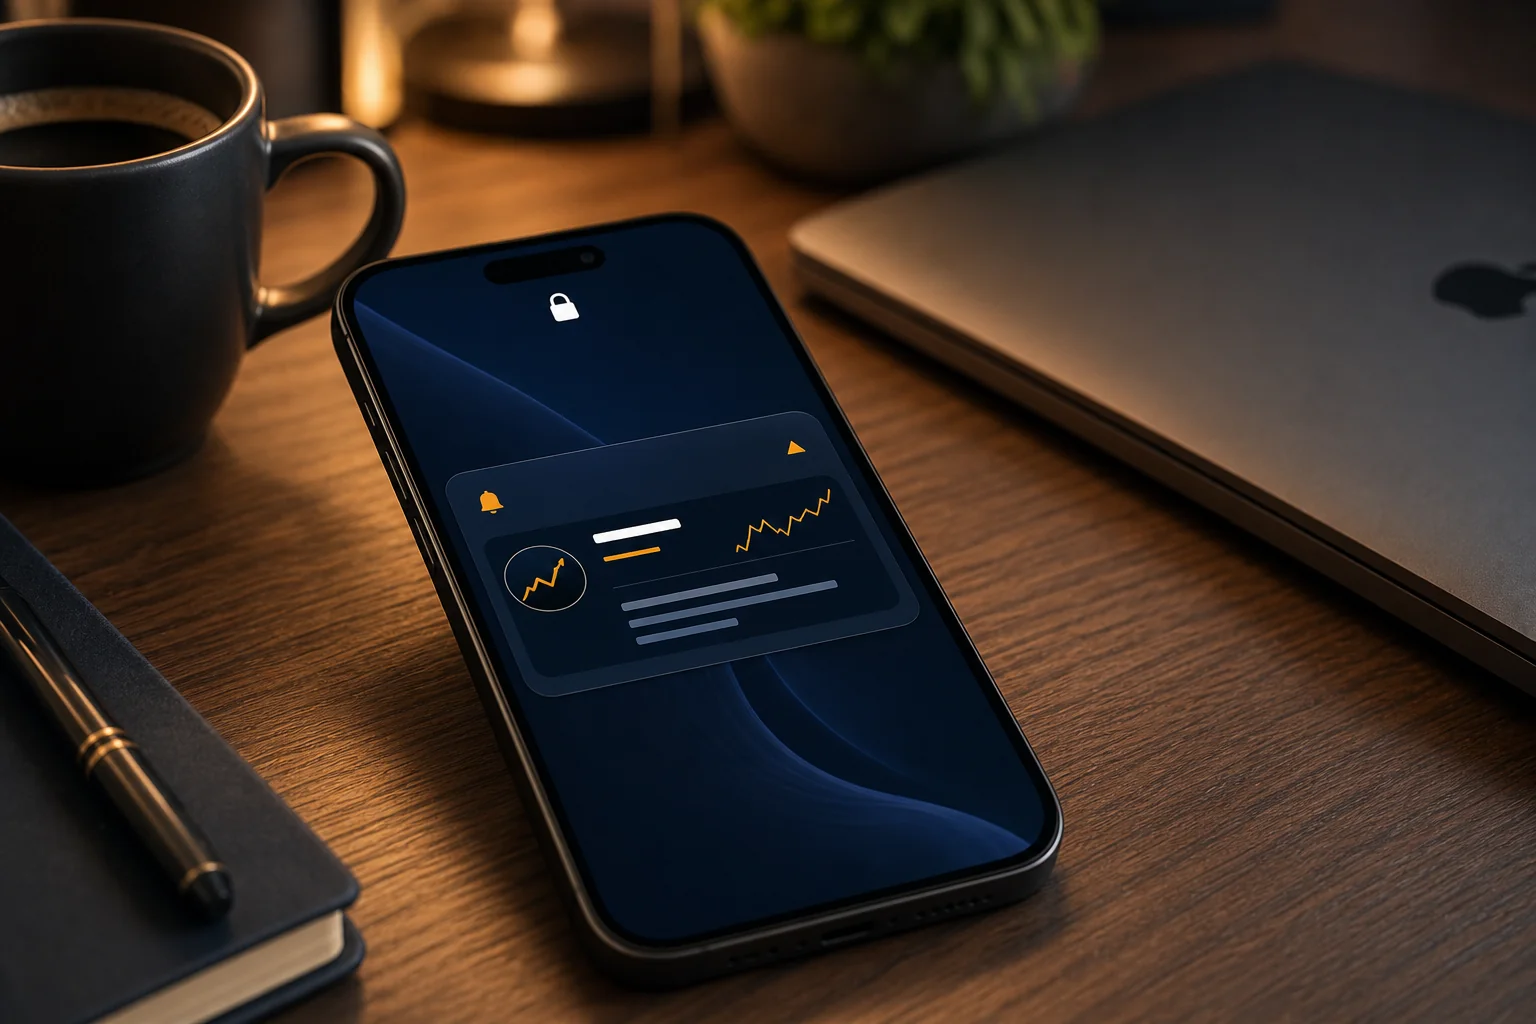
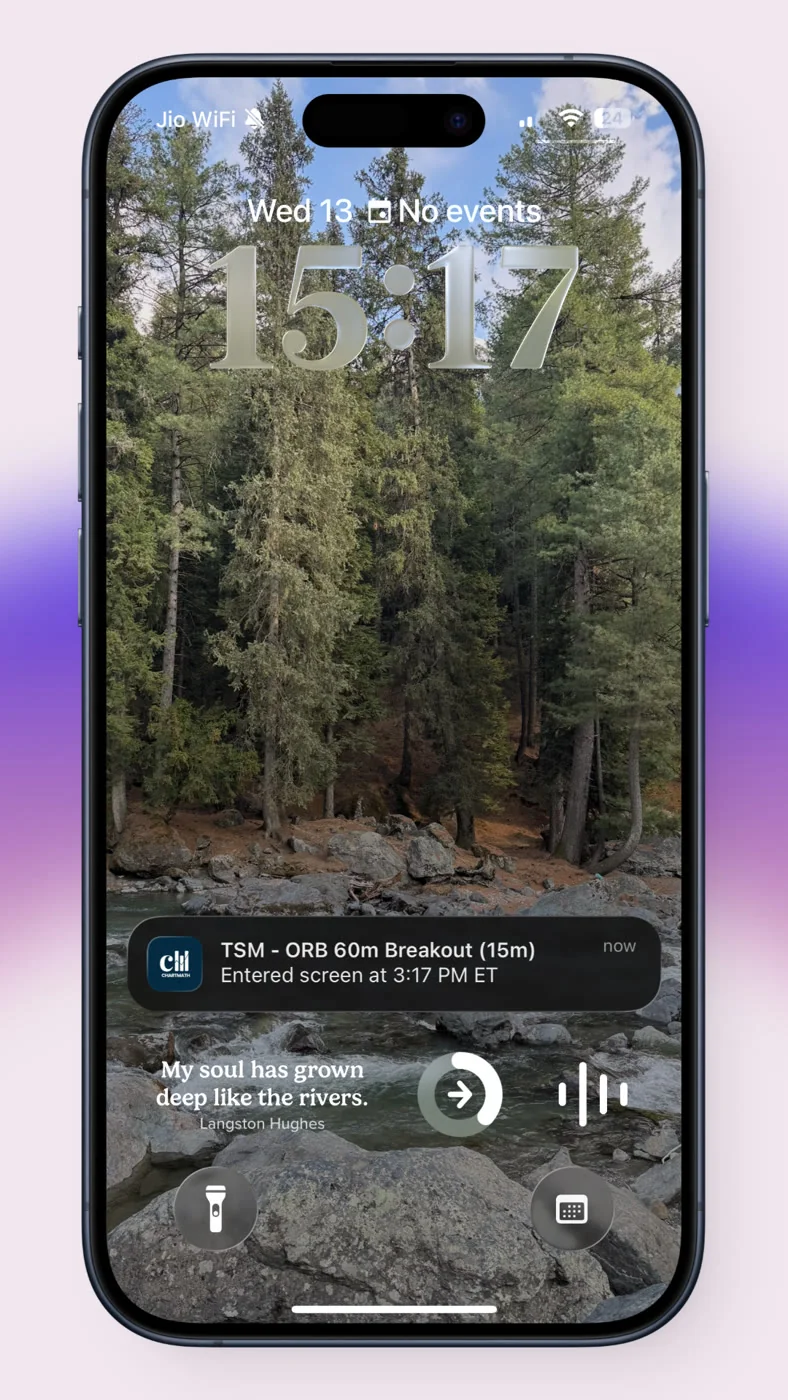
When an alert fires, your phone shows a notification on the lock screen. Tap it and ChartMath deep-links you directly to the setup card. Here's what you'll find:
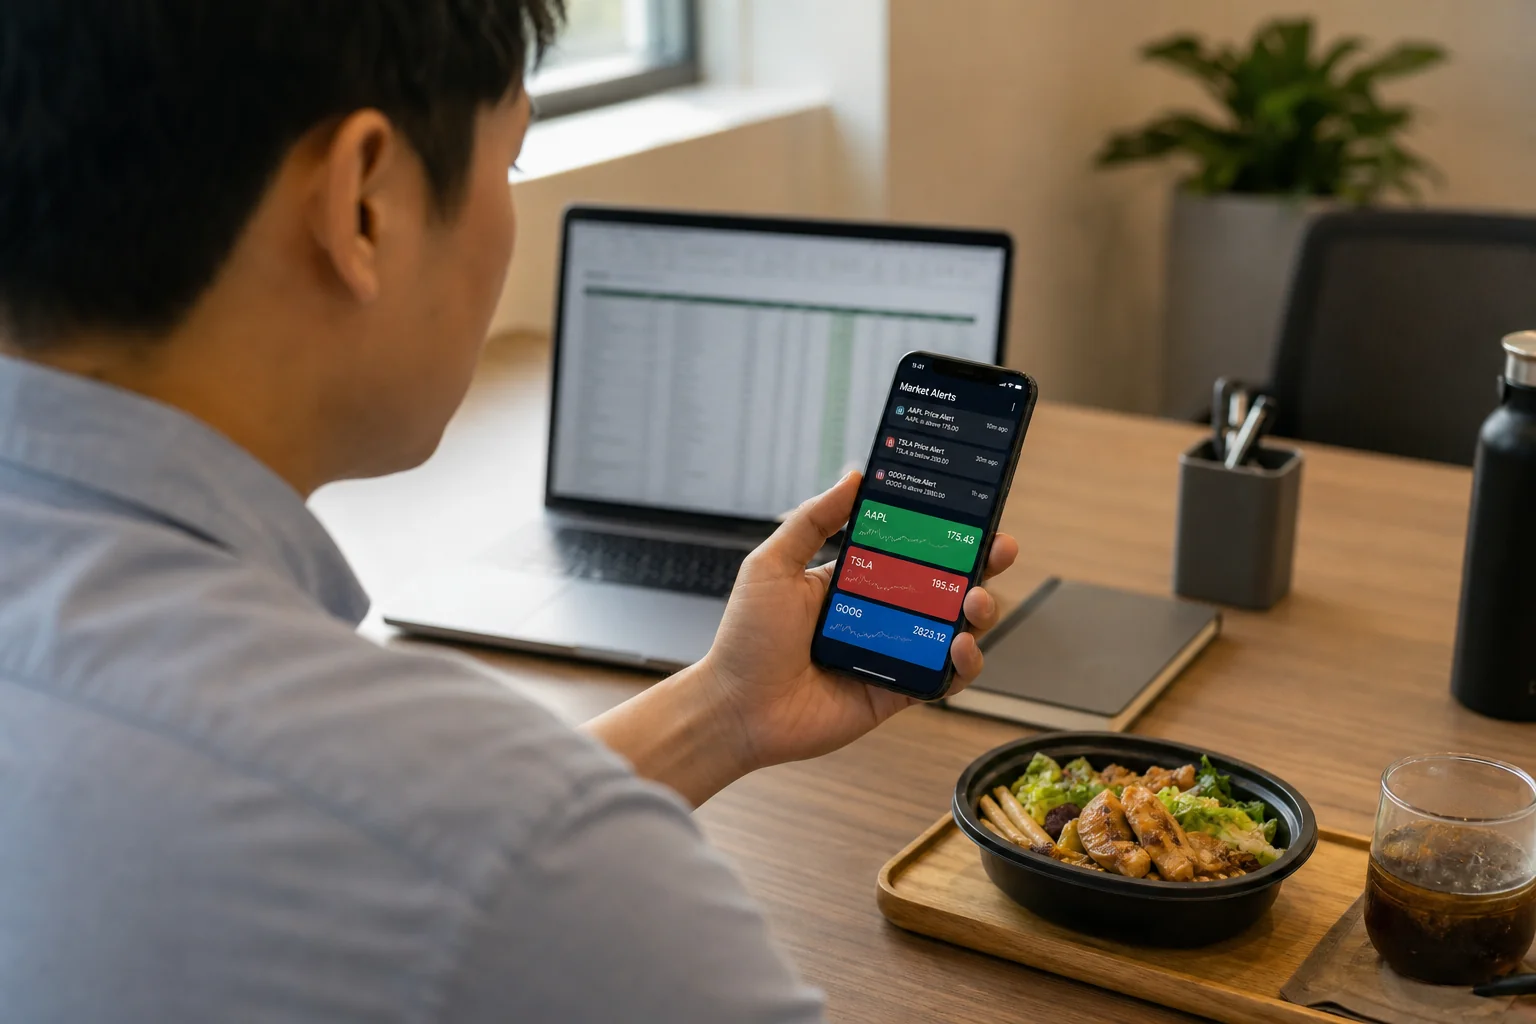
The alert payload
Every alert includes the ticker symbol, the screen name, the timeframe it fired on, and the timestamp. That's enough to make a first-pass judgment before you even open the app. The alert doesn't try to narrate why that one ticker fired — instead, the screen itself spells out its filter rules in plain English (for example, "RSI(14) crosses above 30 on the 15m chart"), and those rules are identical for every stock that enters the screen.
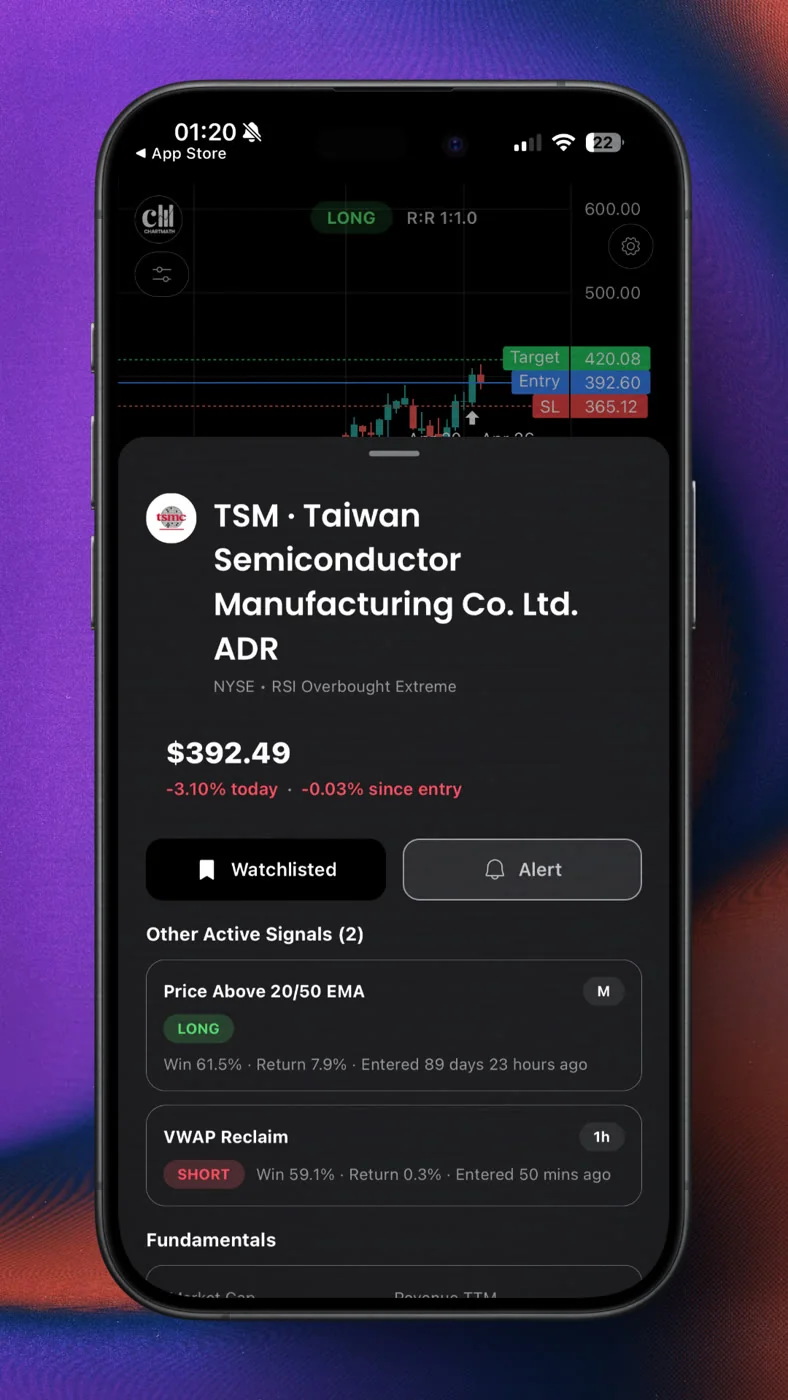
The setup card
Inside the app, the full setup card shows the historical Win Rate and Average Return for that screen, along with the entry level, target, and stop. You also get the sample size, the number of historical occurrences the backtest is based on, and an equity curve showing how the setup has performed over time.
This is the context that most alert systems don't provide. A price alert tells you something happened. ChartMath's alert tells you what happened and points you to how that screen has performed historically and what the setup parameters look like. That's the difference between reacting and deciding.
ChartMath is copilot, not autopilot
ChartMath surfaces the setup and gives you the evidence. You make the call. There's no broker connection and no order placement from the app. Once you decide to act, you execute in your own brokerage. That's intentional, the app is a research and discovery tool, not a trading terminal.
For traders who want to understand the backtesting methodology behind the Win Rate figures, How to Build Winning Backtesting Strategies: A Complete Guide explains how backtests are constructed and what the numbers actually mean. Remember that backtested figures are a historical track record, not a forecast — past performance does not guarantee future results.
Avoiding Alert Fatigue: Smart Configuration Tips
Alert fatigue is the silent killer of mobile trading setups. You configure 30 screens, get 80 notifications on day one, start ignoring them by day three, and miss the one that actually mattered on day five. Here's how to avoid that cycle:
Start narrow, expand deliberately
Three to five favorited screens is the right starting point. Run that configuration for two weeks. See which screen types are generating setups you'd actually trade. Then add one or two more screens based on what you've learned. Expanding gradually keeps your alert volume manageable and your attention focused.
Match screens to your available trading windows
If you can only check your phone during lunch and after market close, there's no point favoriting 1-minute or 5-minute screens. Those setups move too fast for a delayed response. Stick to 1h and Daily screens during the week, and use the weekend to review Weekly setups for the coming session.
Prioritize screens with larger sample sizes
A screen with a high Win Rate based on 12 historical occurrences is less meaningful than one with the same Win Rate based on 200 occurrences. Sample size is displayed on every screen card. When you're choosing which screens to favorite, weight the ones with more data behind them, especially if you're newer to systematic trading.
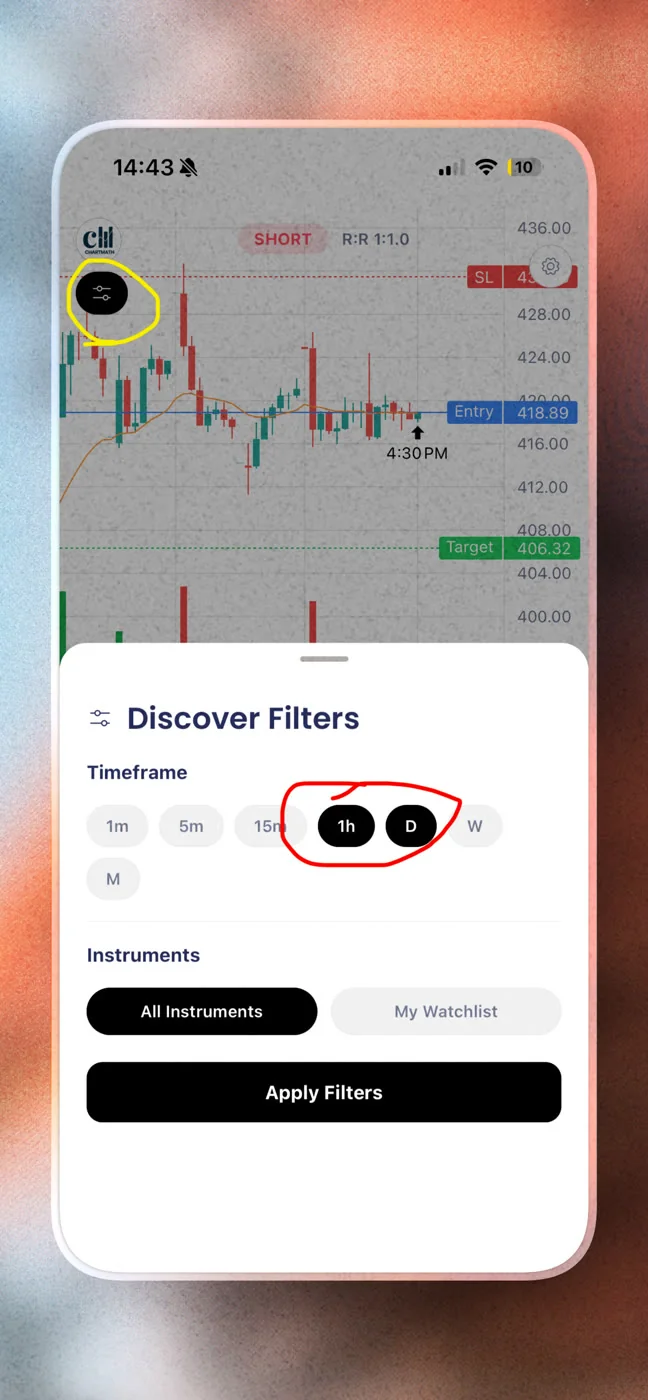
Use the Discover feed as a complement
The Discover tab is ChartMath's swipe-first feed of entry cards. It surfaces setups by backtested reliability and recency, so you can browse what's forming right now without waiting for an alert to fire. Use it during your morning prep or lunch break to stay oriented on what the market is doing across the full universe.
For traders building a complete scanning routine around these tools, Daily Chart Swing Trade Setups: A Scanner Workflow shows how to structure your day around the signals you're receiving.
Frequently Asked Questions
Can I build my own screens in ChartMath?
No. ChartMath's 200+ screens are curated and read-only. There's no screen builder and no way to edit existing screens. That's a deliberate design choice, every screen in the app has been backtested before it ships, so you're working from a validated library rather than building from scratch. If you want to explore what's available, browse the full screen library at chartmath.com/screens.
Does ChartMath send SMS or email alerts?
No. Alerts go out via push notification and the in-app Alerts inbox only — there's no SMS and no email. Push is the primary channel for real-time setups, and the in-app inbox keeps a log you can scroll back through later.
What markets does ChartMath cover?
ChartMath is US-first. The universe covers 500+ US equities (NYSE and Nasdaq), 100 crypto pairs, and 11 US futures, across 7 timeframes from 1-minute to monthly. Sessions and market hours are referenced in Eastern Time.
Is ChartMath free?
ChartMath is a paid product with a 14-day free trial. After the trial it's $24.99/month founding pricing (locked for 12 months) or $149/year. No credit card to start.
Does ChartMath place trades for me?
No. ChartMath is a copilot, not an autopilot. It surfaces setups and delivers alerts with historical context. You decide whether to act and execute in your own brokerage. There's no broker connection and no order placement from the app.
What's the difference between the Discover feed and the Screener?
The Screener tab lets you browse all 200+ screens and see which tickers currently match each one. The Discover feed is a curated, swipe-first feed that surfaces setups forming right now, ranked by backtested reliability and recency. Both are useful, Screener for research, Discover for real-time awareness.
Start Getting Alerts That Actually Tell You Something
Missing entries because you couldn't watch the chart is a solvable problem. The solution isn't more screen time, it's smarter alerts. When every notification carries a ticker, a screen name, and a timeframe, and one tap opens the screen's plain-English rules and backtested Win Rate, you stop reacting to noise and start making informed decisions in the time you actually have.
Start with a 14-day free trial, no card to start, then $24.99/mo founding (locked 12 months) or $149/yr. Download the app, favorite three to five screens that match your strategy, add your key tickers to your watchlist, and let the alerts come to you. The full setup takes under 15 minutes, and the next time a setup triggers at 10:43 AM, you'll know about it before the move is done.
Download ChartMath on iOS or Android and configure your first mobile alert today. Or browse the full screen library first at chartmath.com/screens to see which setups match your trading style before you commit.

Ankush Jindal
LinkedInSee these setups live in ChartMath
200+ curated screens with backtest data. 14-day free trial.