End of Day Swing Trade Scanner: A Day Jobber's Setup

Most traders who scan at the end of the day do it wrong. Not because they pick bad setups, but because they sit down at 8 PM with no system, open a screener, and start clicking through tickers one by one until their eyes glaze over. Forty-five minutes later, they have a list of six stocks they half-remember and no clear reason why any of them made the cut.
There is a better way. The end-of-day scan, done right, takes under 20 minutes and leaves you with a shortlist of high-probability setups, each one backed by historical data, waiting on your phone before tomorrow's open. This guide walks through exactly how to build that routine using an end of day swing trade scanner, so the market does the filtering and you make the decisions.
Why the Last 20 Minutes of Market Hours Are Your Most Valuable Trading Time
The daily candle closes at 4:00 PM ET. That single moment is when every technical setup you care about as a swing trader either confirms or falls apart. A breakout above a six-week base either holds on the daily close or it doesn't. A 52-week high either prints or it fades. The close is the verdict.
For traders with a day job, this creates a structural advantage that most people overlook. You can't watch the open. You can't monitor intraday price action. But you can review what the market decided at the close, after hours, from your couch. That 20-minute window between 4:00 PM and whenever you go to bed is the most actionable time in your trading day.
The problem is that most traders waste it. They manually scroll through a watchlist of 80 tickers, open charts one by one, and try to remember which setups looked interesting last week. It's exhausting, it's inconsistent, and it's easy to miss the one stock that actually mattered.
A structured end of day swing trade scanner replaces that chaos with a repeatable system. Instead of you hunting through the market, the scanner hunts for you. By the time you sit down, the setups are already filtered, ranked, and explained. Your job is to evaluate, not excavate.
1. Understand What an End of Day Swing Trade Scanner Actually Does
A scanner and a screener are often used interchangeably, but the distinction matters here. A screener is a filter you run manually: you set criteria, hit search, and get a list. A scanner runs continuously and fires an alert the moment a ticker crosses your threshold. For day jobbers, the scanner model wins every time, because it doesn't require you to be at your desk to catch the signal.
An end-of-day-focused scanner specifically watches for setups that confirm on the daily (or weekly) timeframe at or near the close. That means breakouts above multi-week bases, momentum continuation patterns, 52-week high reclaims, and relative volume spikes that show institutional interest. These are the setups swing traders hold for days to weeks, not minutes.
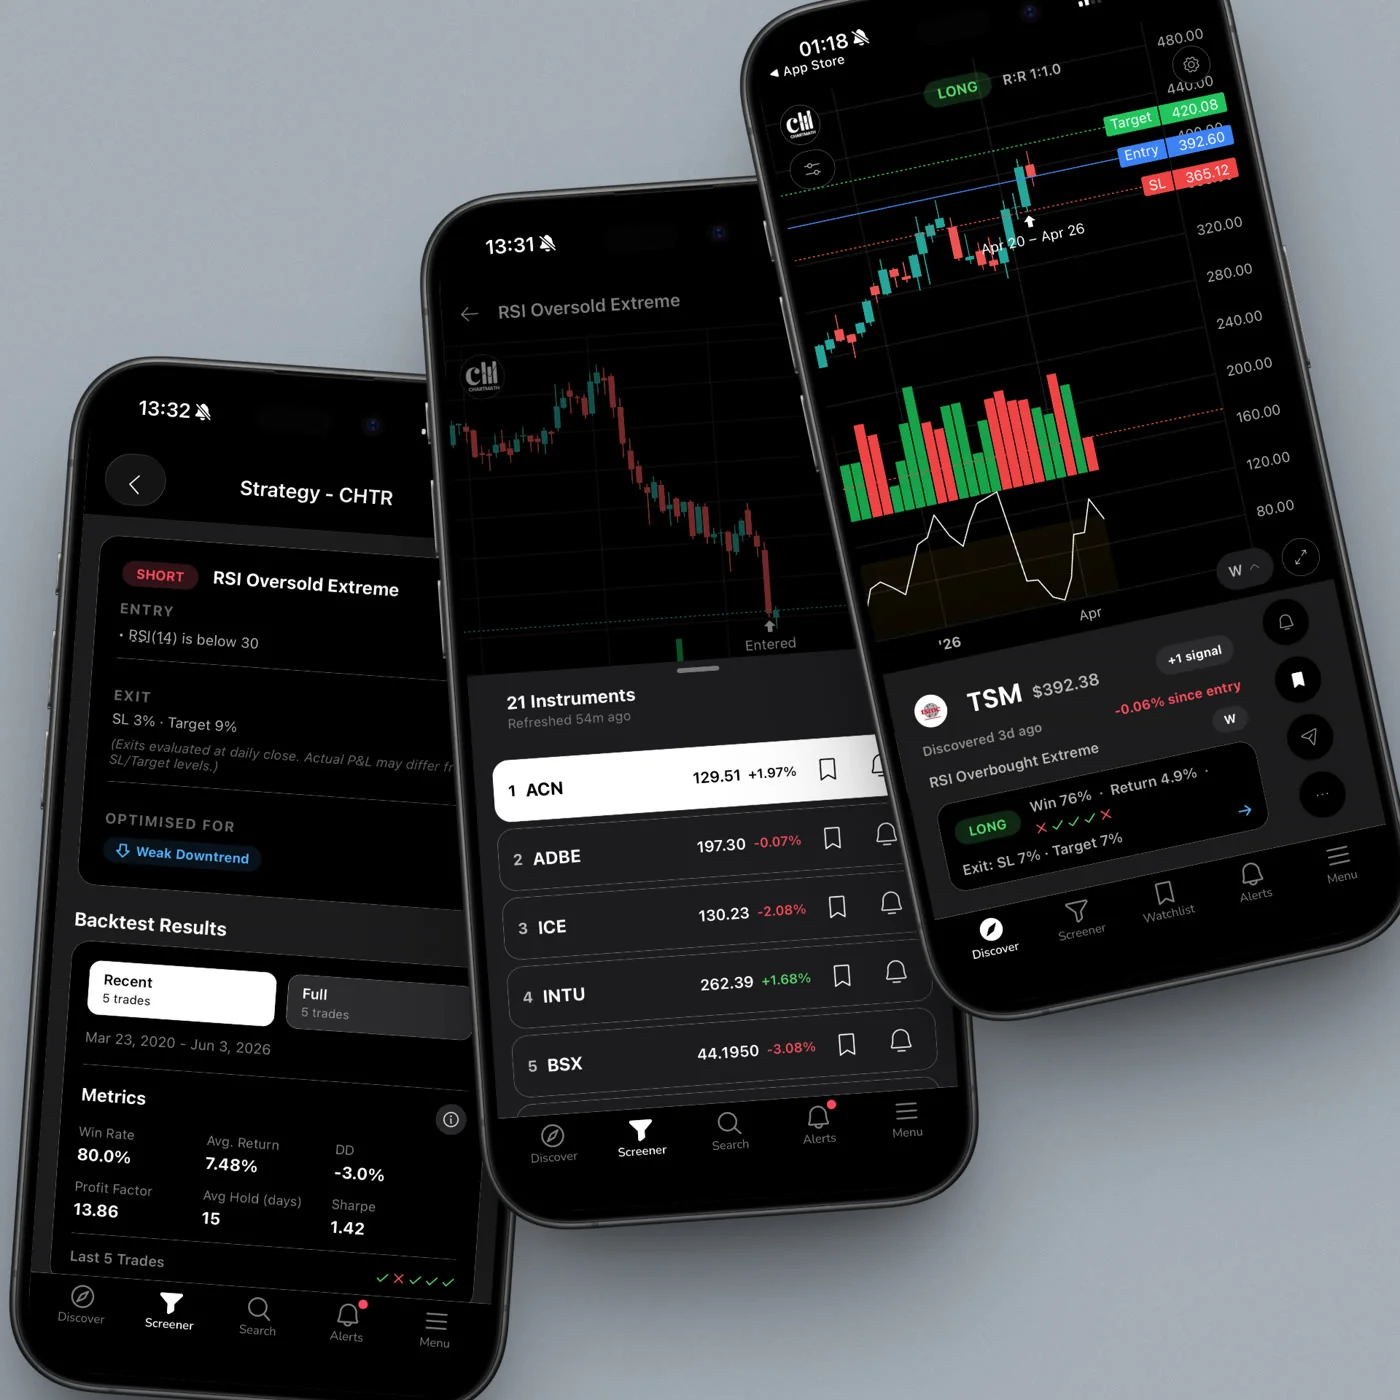
What separates a useful scanner from a noisy one is explainability. Most scanners tell you that a stock triggered a filter. The better ones tell you why it triggered, and whether that trigger has historically led to profitable outcomes. That second piece, the historical win rate and average return, is what lets you decide whether a setup is worth your capital or just worth a glance.
ChartMath's 200+ curated technical screens are built around exactly this model. Every screen ships with its historical Win Rate and Average Return, calculated from backtested data using bar-close entries with no look-ahead. You're not guessing whether a setup has edge. The data is right there on the card.
2. Choose the Right Screens for Your EOD Scan
ChartMath gives you 200+ curated, read-only screens covering breakouts, momentum, VWAP, RVOL, candlestick patterns, and more across 7 timeframes: 1m, 5m, 15m, 1h, Daily, Weekly, and Monthly. For an end-of-day swing trade routine, you don't need all of them. You need the ones that match your setup style and fire on the Daily or Weekly timeframe.
Setup categories worth prioritizing for EOD swing scans
- 52-week high breakouts: Stocks clearing a major resistance level on elevated volume. These are momentum setups with strong historical follow-through. See the 52-week high breakout screener guide for a deeper look at how these setups work.
- Momentum continuation: Stocks already in an uptrend that are setting up for the next leg. These tend to have tighter risk profiles than breakouts from bases.
- VWAP reclaims on the daily: When a stock reclaims VWAP on the daily chart after a pullback, it often signals renewed buying interest. VWAP as a swing trade filter is worth understanding before you lean on these screens.
- Relative volume spikes: RVOL above 1.5x or 2x on the daily close is a signal that something is happening. Combined with a clean technical setup, it's one of the most reliable confirmation filters available. The RVOL and volume spike guide covers this in detail.
In ChartMath, you favorite the screens you care about. Once a screen is favorited, you'll receive a push or email alert the moment a ticker in the universe enters that screen. That's the mechanism that makes the scanner work passively while you're at your desk job.
A practical starting point: pick 5 to 8 screens that match your setup style. More than that and you'll start seeing alert fatigue. Fewer than five and you may miss setups that fit your edge. The goal is a curated signal, not a firehose.
3. Set Up Your Watchlist Before the Close
ChartMath gives you one watchlist, server-synced on mobile, so it's always current across your devices. That single watchlist is your EOD shortlist: the tickers you're already tracking that you want to monitor specifically for screen-enter alerts.
The watchlist serves two purposes in an EOD routine. First, it keeps your highest-conviction candidates visible so you can check their status quickly in the Discover feed or Screener tab. Second, it enables symbol-level alerts: you can set an alert on a specific ticker so you're notified when it enters any screen you care about, not just the ones you've favorited globally.
How to keep the watchlist useful
The temptation is to add every interesting ticker you come across. Resist it. A watchlist with 60 names is just a second screener. Keep it to 15 to 25 tickers that represent your highest-conviction setups in progress. When a stock resolves (breaks out, fails, or you take the trade), remove it and add the next candidate.
The watchlist is also where you capture setups that are almost there. A stock sitting just below a 52-week high, building a tight base, belongs on the watchlist. When it finally clears that level on volume, your alert fires and you're ready to act, even if you're in a meeting at 10:43 AM.
For a deeper look at building a scanner-driven daily chart workflow, the daily chart swing trade setups guide walks through the full process.
4. Configure Alerts So Your Phone Does the Scanning
This is the step that separates a passive EOD routine from an active one. If you're manually checking the app every evening, you're still doing the work. If your phone is doing the scanning and notifying you when something matches, you've built a system.
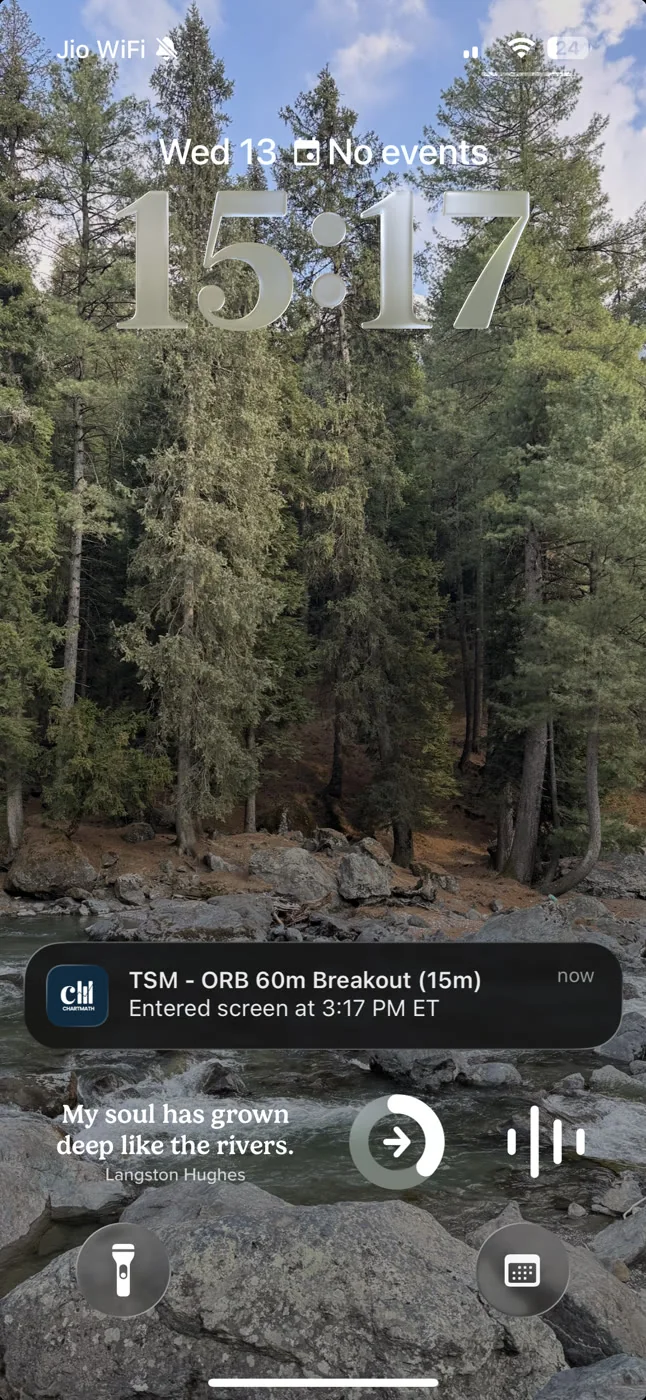
ChartMath sends alerts via push notification and email. No SMS. The alert payload carries everything you need to evaluate the setup without opening a chart: the ticker, the timeframe, the screen name, a plain-English explanation of why it fired, a timestamp, and a deep link that takes you directly to the setup card in the app.
Two alert types and when to use each
Screen-enter alerts fire when any ticker in the universe enters a screen you've favorited. These are your broad-market alerts. If you've favorited the "52-Week High Breakout" screen on the Daily timeframe, you'll get a push notification every time a stock in ChartMath's 500+ US equity universe clears that threshold. You don't have to be watching. The scanner is watching for you.
Symbol-level alerts are set on specific tickers in your watchlist. These are your high-conviction alerts. You've already identified the setup; you just need to know when it triggers. Symbol-level alerts fire when that specific ticker enters any screen you've configured, so you get a targeted notification rather than a broad market sweep.
Notification hygiene: why fewer alerts work better
ChartMath builds de-duplication, throttling, per-bar caps, and timezone-aware quiet hours into the alert system. That's not a minor feature. Alert fatigue is one of the most common reasons traders abandon scanner tools. When every alert looks the same and half of them are noise, you start ignoring all of them, including the ones that matter.
The quiet hours setting alone is worth the setup time. Configure it to suppress alerts during your work hours if you can't act on them anyway, and let them batch for your EOD review. You get a clean inbox at 4:30 PM instead of 40 pings throughout the day that you couldn't do anything with.
For more on building an alert system that doesn't overwhelm you, the guide to integrating trading alerts with your charting platform covers the workflow in detail.
5. Validate the Setup With Backtest Data Before You Commit
Getting an alert is the beginning of the process, not the end. The alert tells you a stock entered a screen. The backtest data tells you whether that screen has historically been worth trading.
Every screen in ChartMath shows its historical Win Rate and Average Return, along with expected value (EV), sample size, and equity and drawdown curves. These metrics are calculated from backtested data using bar-close entries with no look-ahead bias. One important caveat: the backtests do not yet model commissions, slippage, or spread. Factor that into your own risk assessment.
How to read the card metrics
Win Rate tells you how often the setup resulted in a profitable trade historically. Average Return tells you the average gain (or loss) per trade. EV combines both: a screen with a 55% win rate and a 4% average return has a different EV than one with a 45% win rate and an 8% average return. Both can be worth trading; the EV tells you which one has more edge per dollar risked.
Sample size matters too. A screen with a 70% win rate over 12 historical occurrences is far less reliable than one with a 62% win rate over 300 occurrences. The larger the sample, the more confidence you can place in the metric. ChartMath shows the sample size on every card so you can make that judgment yourself.
For a deeper understanding of how to use backtest data in your decision-making, the guide to building winning backtesting strategies is worth reading alongside this one.
ChartMath is a copilot, not an autopilot
This is worth stating plainly: ChartMath does not place trades. It does not connect to your broker. It surfaces setups, explains why they fired, and shows you the historical data behind them. You make the decision. You execute in your own brokerage account. That's the model, and it's the right one. No scanner should be making trade decisions for you.
Think of it as a research assistant that never sleeps. It scans 500+ US equities, 100 crypto pairs, and 11 US futures across 200+ screens and 7 timeframes, and hands you a shortlist with evidence. What you do with that shortlist is entirely your call.
6. Build Your Pre-Open Shortlist the Night Before
By the time you sit down for your EOD review, the alerts have already fired. Your job now is to triage them into a shortlist of 3 to 5 setups you'll actually watch tomorrow.
Open the Discover feed in ChartMath. This is the swipe-first surface where explainable setup cards appear, each one showing the ticker, the screen it matched, the timeframe, the plain-English reason it fired, and the backtest metrics. You're not reading charts at this stage. You're reading cards and deciding which setups deserve a deeper look.
The triage process
For each card, ask three questions: Does the Win Rate and Average Return justify the risk? Does the plain-English explanation match a setup I actually trade? Is the sample size large enough to trust the metric? If the answer to all three is yes, it goes on the shortlist. If any answer is no, swipe past it.
Once you have your shortlist, cross-reference with your charting platform. Pull up the daily chart in TradingView or TrendSpider, confirm the setup visually, check the broader market context, and decide on your entry criteria for tomorrow. ChartMath found the setup. Your charting platform confirms it. You execute when the conditions are met.
This is the workflow described in the guide to trading stocks without watching the screen all day: let the scanner do the discovery, use your charting tools for confirmation, and only act when both agree.
What a realistic shortlist looks like
Three to five setups is the right number for most day jobbers. More than that and you're spreading attention too thin. Fewer than three and you may not have enough candidates if one or two fail to set up cleanly at the open. Each setup on the shortlist should have a clear entry trigger, a defined stop level, and a target based on the screen's historical average return.
7. Execute the Routine: A Sample EOD Scan Walkthrough
Here's what a realistic 20-minute EOD session looks like using ChartMath, from market close to shortlist built.
Step 1: Check your alert inbox (3 minutes)
Open the Alerts tab in ChartMath. Review the screen-enter alerts that fired during the session. Each alert shows the ticker, the screen it matched, the timeframe, and the plain-English reason. Scan for alerts from your favorited screens on the Daily timeframe. Flag anything that looks relevant.
Step 2: Browse the Screener tab (5 minutes)
Go to the Screener tab and filter by Daily timeframe. Browse the screens you've favorited to see the current list of matching tickers. This gives you a broader view than just the alerts that fired today. Some setups build over multiple days and may not have triggered a new alert but are still worth watching.
You can also browse all 200+ screens at chartmath.com/screens on the web if you prefer a larger display for your evening review. The web layer is anonymous and read-only, so no sign-in is needed to browse.
Step 3: Swipe through the Discover feed (7 minutes)
Open the Discover tab and swipe through the setup cards that surfaced today. Each card explains why the setup fired and shows the Win Rate and Average Return for that screen. Apply your triage criteria: strong metrics, setup type you trade, adequate sample size. Flag your top candidates.
Step 4: Update your watchlist and set symbol-level alerts (5 minutes)
Add your top 3 to 5 candidates to the watchlist if they're not already there. Set symbol-level alerts on any new additions so you'll be notified if they enter additional screens overnight or premarket. Remove any tickers that have resolved (broke out, failed, or you've already traded).
That's it. Twenty minutes, a clean shortlist, and alerts configured for tomorrow. You wake up with a plan instead of a blank screen.
Frequently Asked Questions
Can I use ChartMath alongside TradingView or Finviz?
Yes, and that's exactly how most users run it. ChartMath is a discovery layer, not a replacement for your charting platform. It finds the setups; TradingView or TrendSpider lets you analyze them in depth. The two tools complement each other rather than compete. ChartMath has no formal integration with those platforms; they're used separately as part of the same workflow.
Does ChartMath place trades automatically?
No. ChartMath is a copilot, not an autopilot. It surfaces setups and sends alerts, but it does not connect to a broker and does not place orders. You execute in your own brokerage account. There is no broker integration in the live product.
What markets does ChartMath scan?
ChartMath scans 500+ US equities (NYSE and Nasdaq), 100 crypto pairs, and 11 US futures, across 7 timeframes from 1-minute to monthly. It is a US-first product. Session references align to Eastern Time.
How is ChartMath different from Finviz or Trade Ideas?
Finviz updates end-of-day and has no mobile app or real-time push alerts. It's a solid screener for EOD research but won't notify you during the trading day. Trade Ideas is a powerful desktop platform built for professional day traders, starting at $118/month, with a complex interface that takes significant time to configure. ChartMath is mobile-first, requires no coding, and is in open beta, with the full screen library, backtests, and alerts open while it's early.
Is ChartMath free to use?
ChartMath is in open beta, with the full screen library, backtests, and alerts open while the platform is early. Paid plans come later, and traders who join during beta keep founding pricing when they do.
Start Your EOD Scan Routine Tonight
The end-of-day scan is the highest-leverage 20 minutes in a day jobber's trading week. Done manually, it's a grind that burns out most traders within a month. Done with the right scanner, it becomes a repeatable system that surfaces high-probability setups, validates them with backtest data, and pushes alerts to your phone before you even sit down to review.
ChartMath is built for exactly this workflow. Scan 500+ US equities across 200+ curated technical screens, get explainable push alerts when a setup matches, and review the Win Rate and Average Return before you risk a dollar. No Pine Script. No coding. No alert spam.
Download the app at chartmath.com/app (iOS and Android) and run your first EOD scan tonight. Or browse all 200+ screens right now at chartmath.com/screens, no sign-in required. ChartMath is in open beta, with the full screen library open while it's early.

Ankush Jindal
LinkedInSee these setups live in ChartMath
200+ curated screens with backtest data. 14-day free trial.