How to Scan Futures for Day Trading Setups
Futures contracts don't care about your schedule. ES can rip 20 points in the first 15 minutes of the session. NQ can reverse hard at VWAP before you've finished your morning coffee. CL can spike on an inventory number you didn't know was dropping at 10:30 AM Eastern. If you're trading futures without a systematic scanning process, you're not really trading — you're reacting, usually late.
The good news: scanning futures for day trading setups doesn't require a Bloomberg terminal, a custom Pine Script strategy, or six monitors. What it requires is the right screens, the right timeframes, and a setup that alerts you the moment a contract enters a pattern worth looking at. This guide walks through exactly how to do that.
Why Futures Scanning Is Different From Stock Scanning
Most retail screeners are built for equities. They scan for gap-ups, earnings plays, or sector momentum during regular market hours. Futures are a different animal, and the differences matter when you're building a scanning workflow.
First, futures trade nearly 24 hours. The ES (S&P 500 futures) session opens at 6:00 PM Eastern the night before and runs through 5:00 PM the following day, with a brief maintenance break. That means setups can form overnight, during pre-market, or in the middle of the trading day — not just at the 9:30 AM open. A screener that only runs during regular equity hours will miss a lot of the action.
Second, intraday moves in futures are often driven by macro catalysts: Fed statements, CPI prints, oil inventory data, jobs reports. These events create sharp, fast moves that reward traders who already have a setup framework in place. If you're building your watchlist after the catalyst fires, you're already behind.
Third, multi-timeframe context matters more in futures than in most equity setups. A 5-minute breakout signal on NQ that aligns with a bullish Daily trend is a very different trade from the same 5-minute signal firing against a bearish Weekly structure. Scanning without that context is how traders get chopped up on technically valid-looking entries that go nowhere.
Most retail screeners don't address any of this. They're static, equity-focused, and don't explain what a signal means or whether it has historically worked. That's the gap a systematic futures scanning workflow is designed to fill.
1. Know Your Universe: The 11 US Futures ChartMath Covers
ChartMath covers 11 US futures contracts. That's a curated set, not the entire futures market — and that's intentional. The goal is signal quality, not signal volume.
The 11 contracts span the major categories a retail day trader actually uses:
- Equity index futures: ES (S&P 500), NQ (Nasdaq-100), YM (Dow Jones), RTY (Russell 2000)
- Energy: CL (Crude Oil), NG (Natural Gas)
- Metals: GC (Gold), SI (Silver)
- Rates and bonds: ZB (30-Year Treasury Bond), ZN (10-Year Treasury Note)
- Agricultural/other: ZC (Corn) or similar depending on current coverage
All session references in ChartMath align to Eastern Time, consistent with NYSE and Nasdaq hours. If you're trading ES or NQ, the intraday setups you'll see are framed around the regular session open at 9:30 AM ET and the key intraday windows that follow.
Why 11 and not more? Because every screen in ChartMath has been backtested before it ships. Running backtests across a curated, verified universe produces more reliable historical data than scanning thousands of thinly traded contracts. The 11 US futures covered are the ones retail day traders actually trade, with enough historical data to produce meaningful Win Rate and Average Return figures.
ChartMath is US-first: the primary universe is 500+ US equities, plus 100 crypto pairs and 11 US futures. The futures coverage is real and live, but it's part of a broader platform built around US equities for the systematic retail trader.
2. Pick the Right Timeframe for Your Session
ChartMath scans across 7 timeframes: 1m, 5m, 15m, 1h, Daily, Weekly, and Monthly. For futures day trading, the timeframe you choose determines what kind of setup you're hunting and how much noise you're willing to tolerate.
Intraday entry timeframes
The 1-minute chart is the fastest signal available. It's useful for scalpers who want to catch the first few minutes of a breakout move, but it generates a lot of noise. Most day traders using a systematic approach find the 5-minute and 15-minute timeframes more reliable for entries. They filter out the micro-noise while still giving you enough resolution to time an entry within a reasonable range of the setup trigger.
Context timeframes
The 1-hour and Daily charts are where you check the macro trend before committing to an intraday signal. If ES is in a clear Daily downtrend and you're getting a 5-minute bullish breakout signal, that's a lower-conviction setup than the same signal firing in a Daily uptrend. Using the higher timeframes as a filter, not as an entry trigger, is one of the simplest ways to improve the quality of your intraday trades.
For a deeper look at how multi-timeframe confirmation works in practice, the VWAP Trading guide covers how to layer timeframes around a key intraday level.
The practical approach
A workable day-trading timeframe stack for futures looks like this: check the Daily chart for trend direction before the session, use the 15-minute chart to identify the key levels and structure for the day, and watch for 5-minute alerts to fire at those levels. That's three timeframes, each doing a specific job, without requiring you to stare at charts all morning.
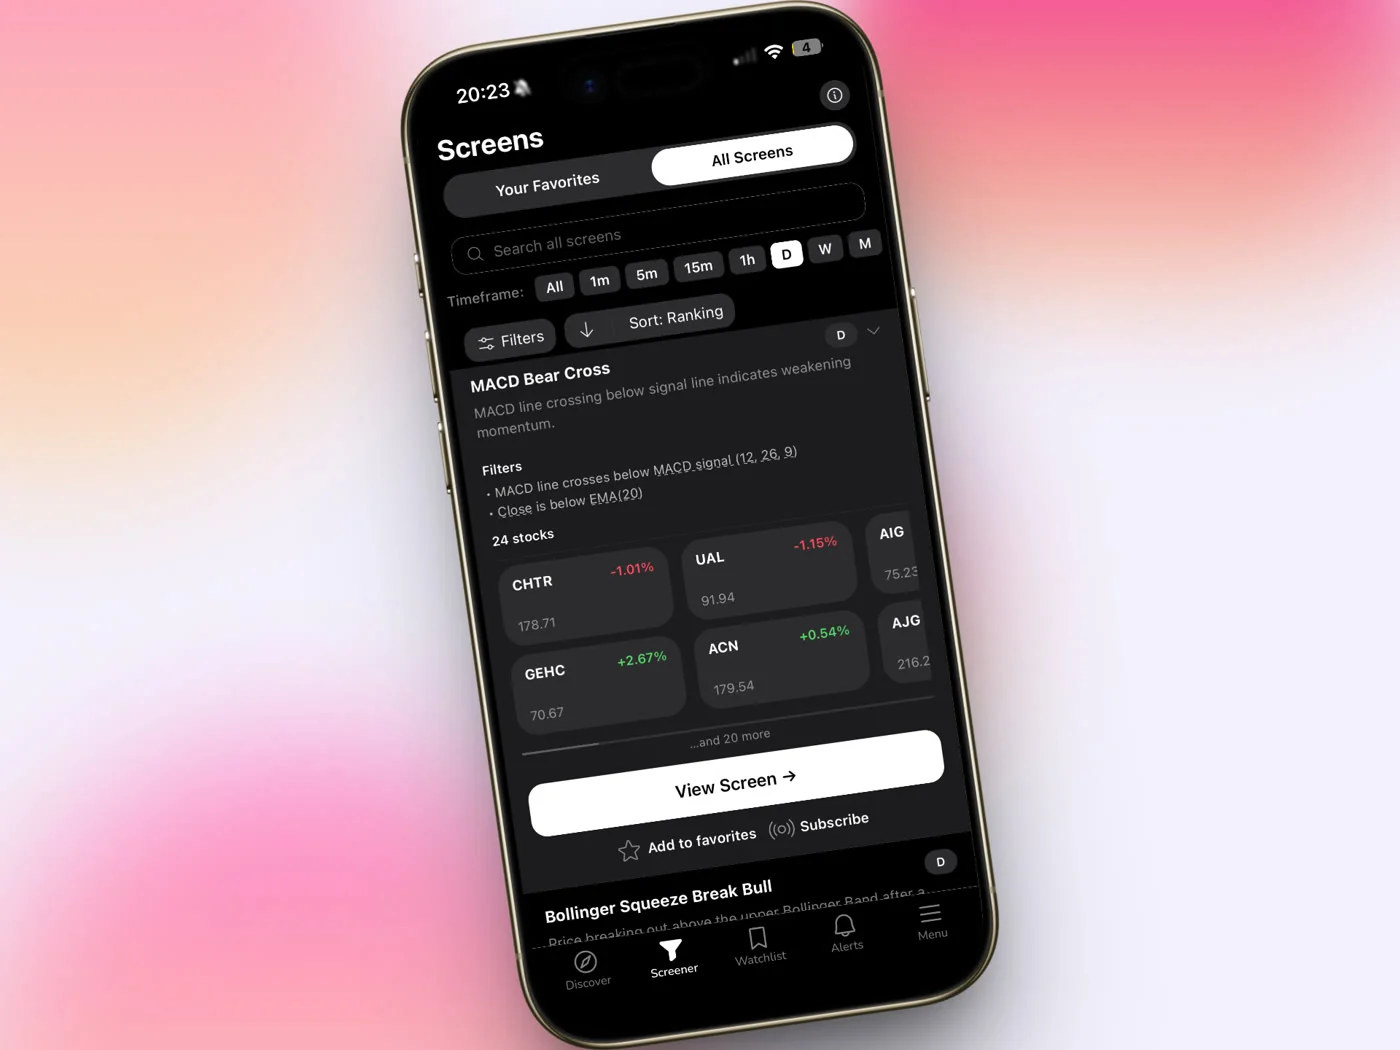
3. Choose Screens That Match Futures Behavior
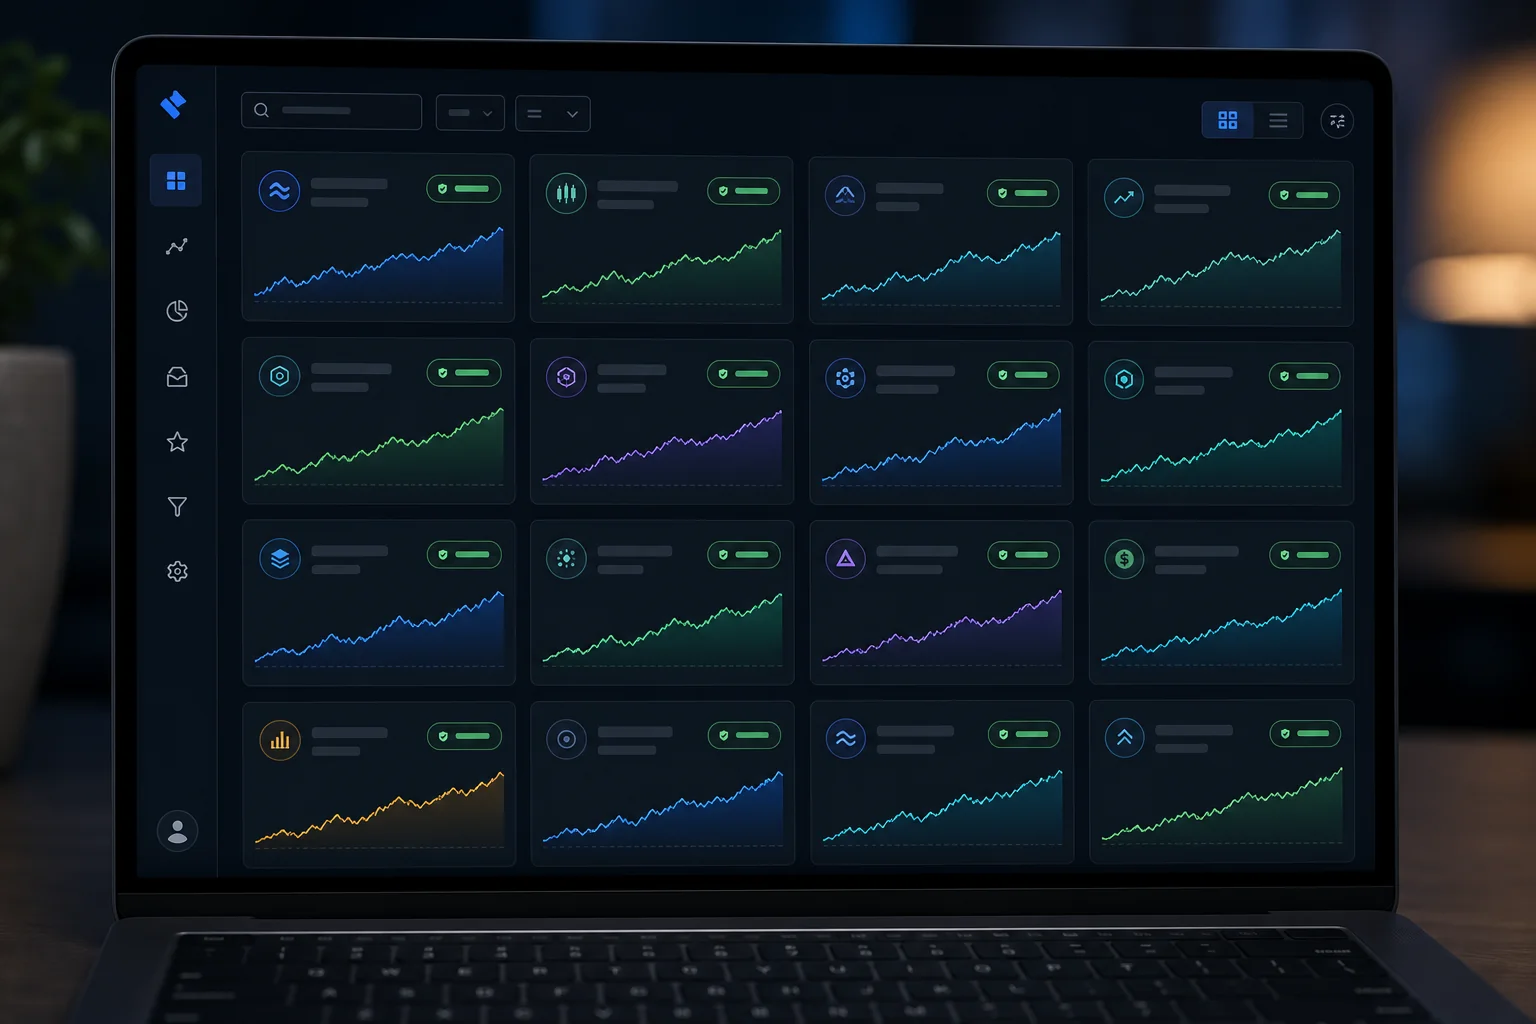
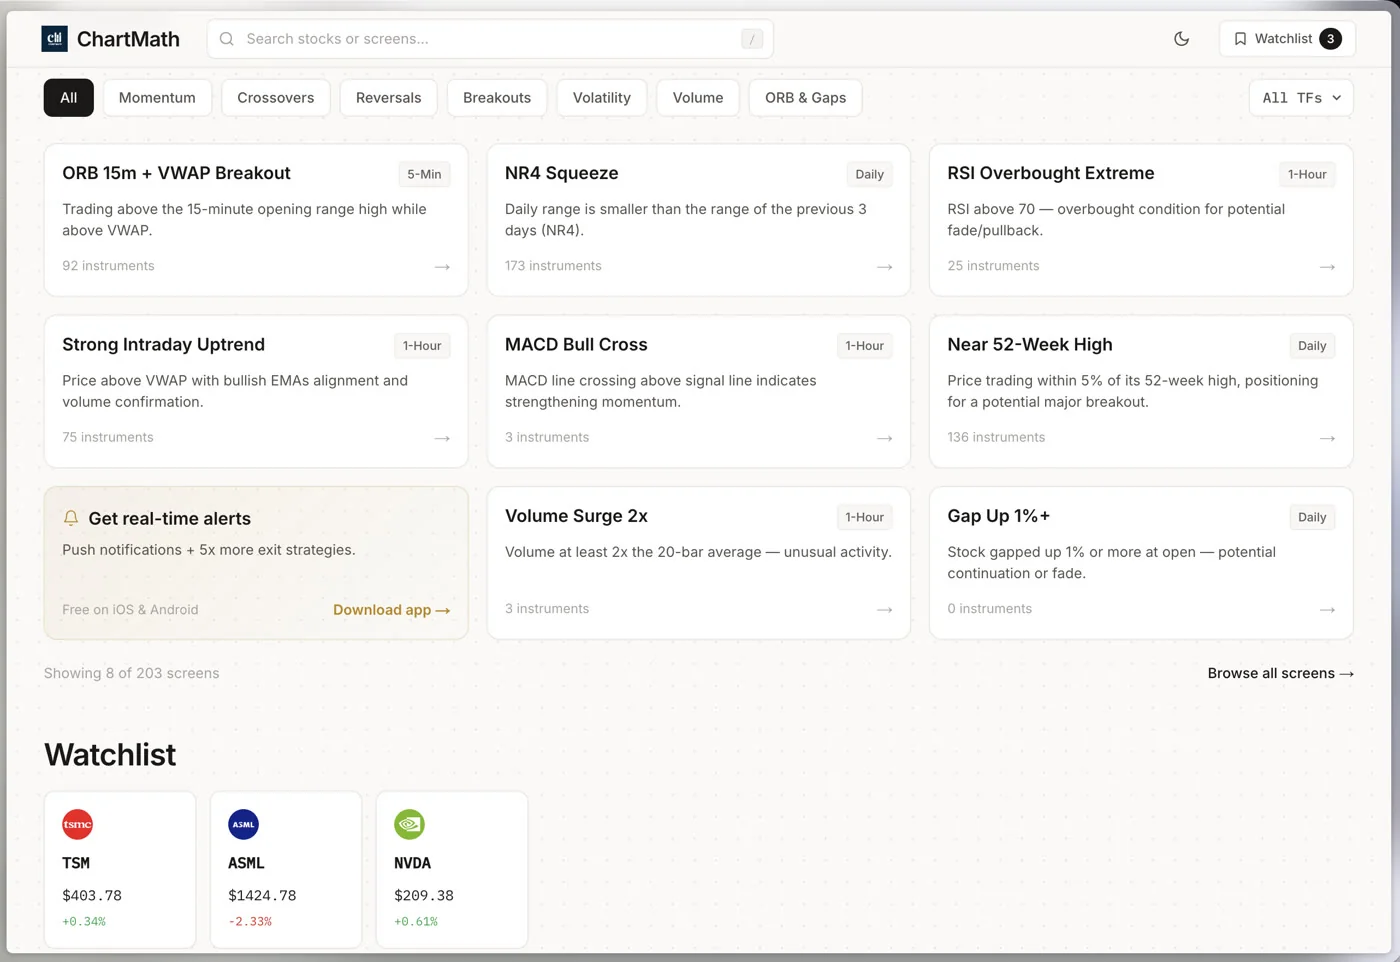
ChartMath has 200+ curated, read-only, backtested screens. You don't build them. You don't write Pine Script. You browse them, pick the ones that match your trading style, and let the scanner watch them for you.
For futures day trading specifically, the screen categories that tend to produce the most relevant setups are:
Opening Range Breakout (ORB)
The ORB is one of the most widely traded intraday setups across equity index futures. Price establishes a range in the first 5 or 15 minutes of the session, and a breakout above or below that range signals directional momentum. ChartMath's ORB screens run on the 5m and 15m timeframes, which are the standard windows for this setup. For more on how ORB setups work in a scanner workflow, see the Premarket Trading strategies guide.
VWAP Reclaim
VWAP (Volume Weighted Average Price) is the intraday benchmark that institutional traders use to evaluate execution quality. When a futures contract drops below VWAP and then reclaims it with volume, that's a setup that day traders watch closely. ChartMath's VWAP Reclaim screen identifies this pattern across the covered futures contracts and timeframes, with a historical Win Rate and Average Return attached to every signal.
Momentum Breakout and RVOL
Momentum breakout screens look for contracts that are breaking out of consolidation with expanding volume. Relative volume (RVOL) screens flag contracts where current volume is significantly above the historical average for that time of day, a sign that something is happening beyond normal market noise. Both are useful for catching the early stages of a directional move in CL, GC, or the equity index futures.
Low Volatility Compression
Before a big move, price often compresses into a tight range. Low volatility compression screens identify this coiling pattern before the breakout happens, giving you a heads-up to watch a contract before it moves rather than after.
Every one of these screens shows its historical Win Rate and Average Return, a verifiable track record based on backtested data, not a forecast. You can browse the full screen library at chartmath.com/screens before you even download the app.
For traders coming from TradingView who are used to building their own indicators, the read-only model takes some adjustment. But the tradeoff is real: instead of spending hours writing and debugging a Pine Script strategy, you get 200+ screens that have already been backtested and validated. The Stock Scanner Without Pine Script guide covers this shift in more detail.
4. Set Up Alerts So the Setup Finds You
The whole point of a futures scanner is that you shouldn't have to watch charts to catch setups. ChartMath's alert system is built around that premise.
Here's how alerts work for futures:
Screen-enter alerts
When you favorite a screen in ChartMath, you get a push notification the moment any instrument in the covered universe, including the 11 US futures, enters that screen. The alert payload includes the ticker (e.g., ES), the timeframe (e.g., 5m), the screen name (e.g., VWAP Reclaim), the screen's filter rules in plain English, a timestamp, and a deep link back into the app.
Alerts are delivered via push notification and in-app. That's it. No SMS, no email. The push notification fires on your phone the moment the setup triggers, which is exactly what you need when you're away from your desk and a futures contract is moving.
Notification hygiene
Alert fatigue is a real problem with most screeners. ChartMath addresses it with built-in de-duplication (the same setup on the same instrument doesn't fire multiple times in a row), throttling, a per-bar cap, and timezone-aware quiet hours. You get alerted when something new happens, not every time the scanner re-runs.
For traders who've dealt with noisy Discord signal groups or unfiltered screener alerts, this matters. The goal is to surface the setups worth looking at, not to flood your lock screen with noise. The Stock Screeners for Day Trading guide has more on how to think about alert quality vs. alert volume.
Symbol-level alerts
Beyond screen-enter alerts, you can also set alerts at the symbol level. If you want to be notified any time ES enters any of the 200+ screens, you can set that up directly from the Search tab. This is useful when you have a specific futures contract you're watching and want to know the moment any backtested setup fires on it.
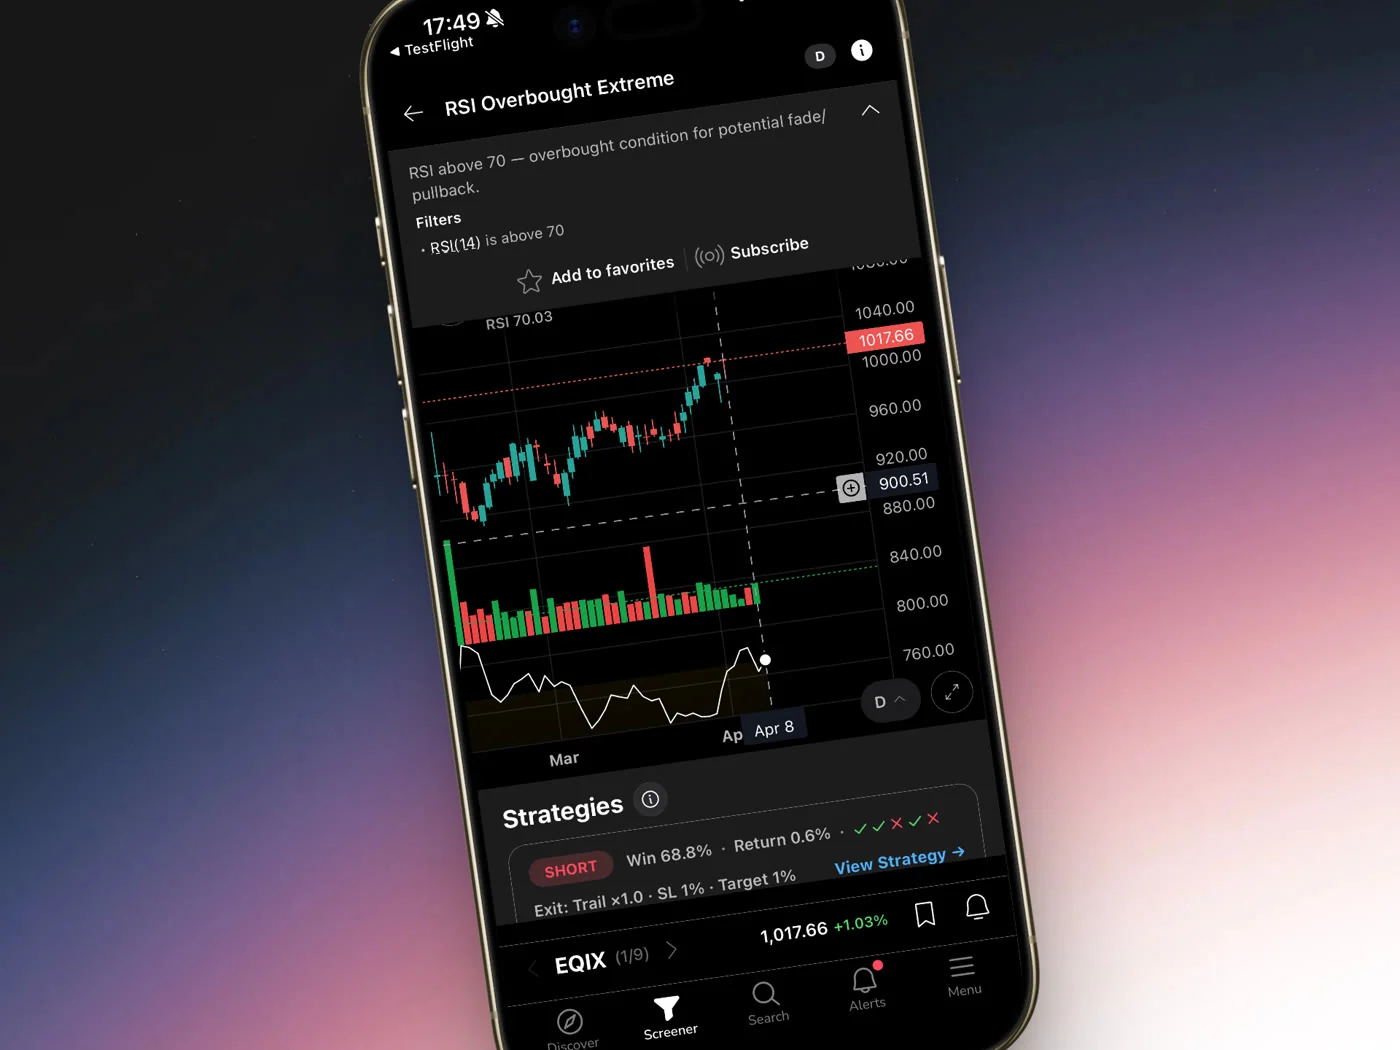
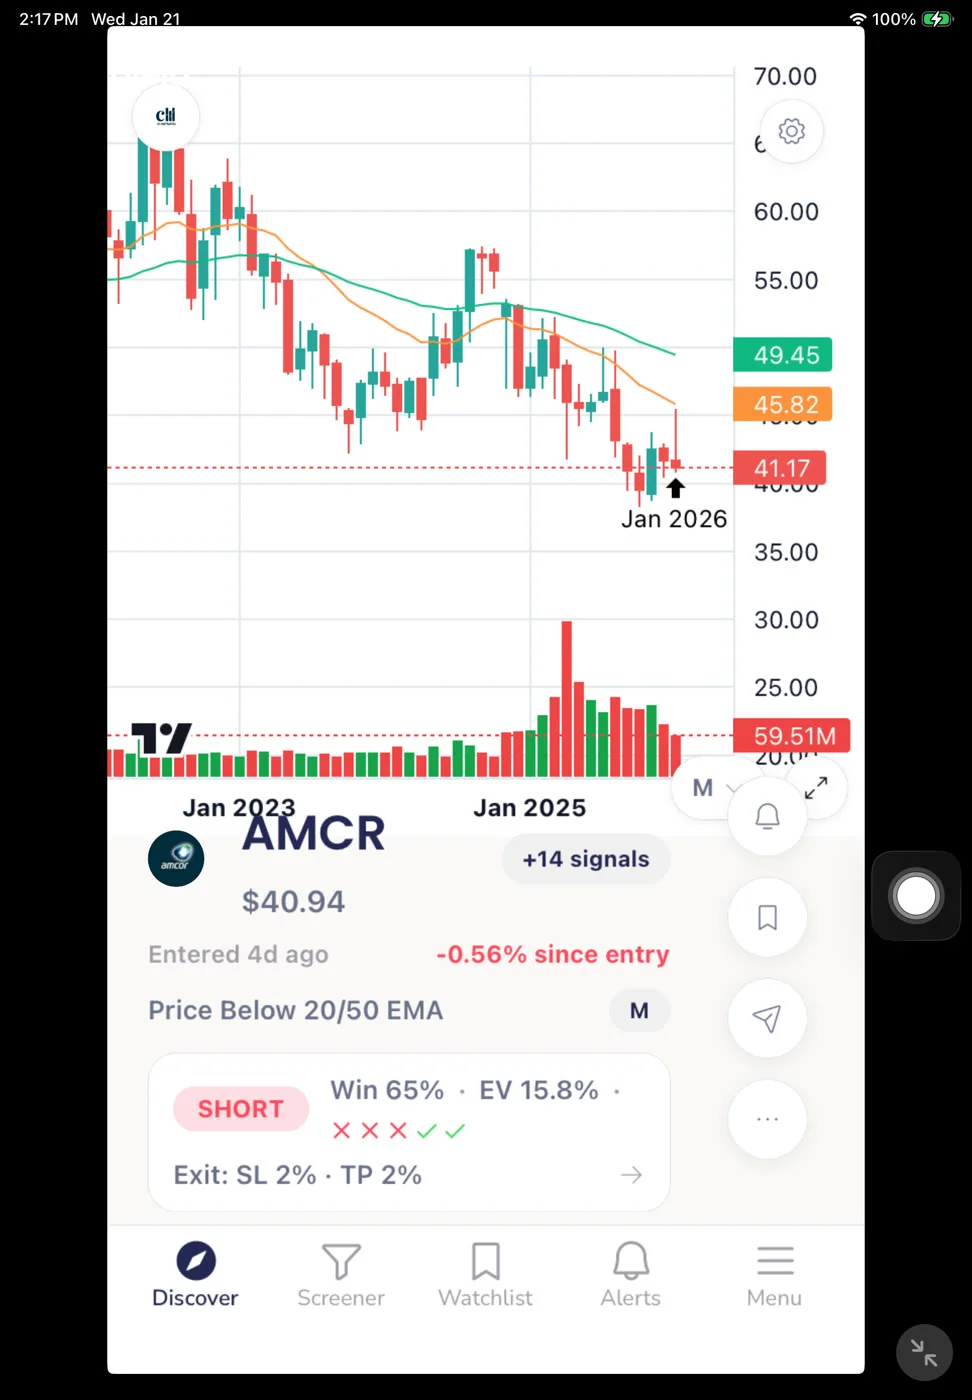
5. Read the Backtest Data Before You Trade
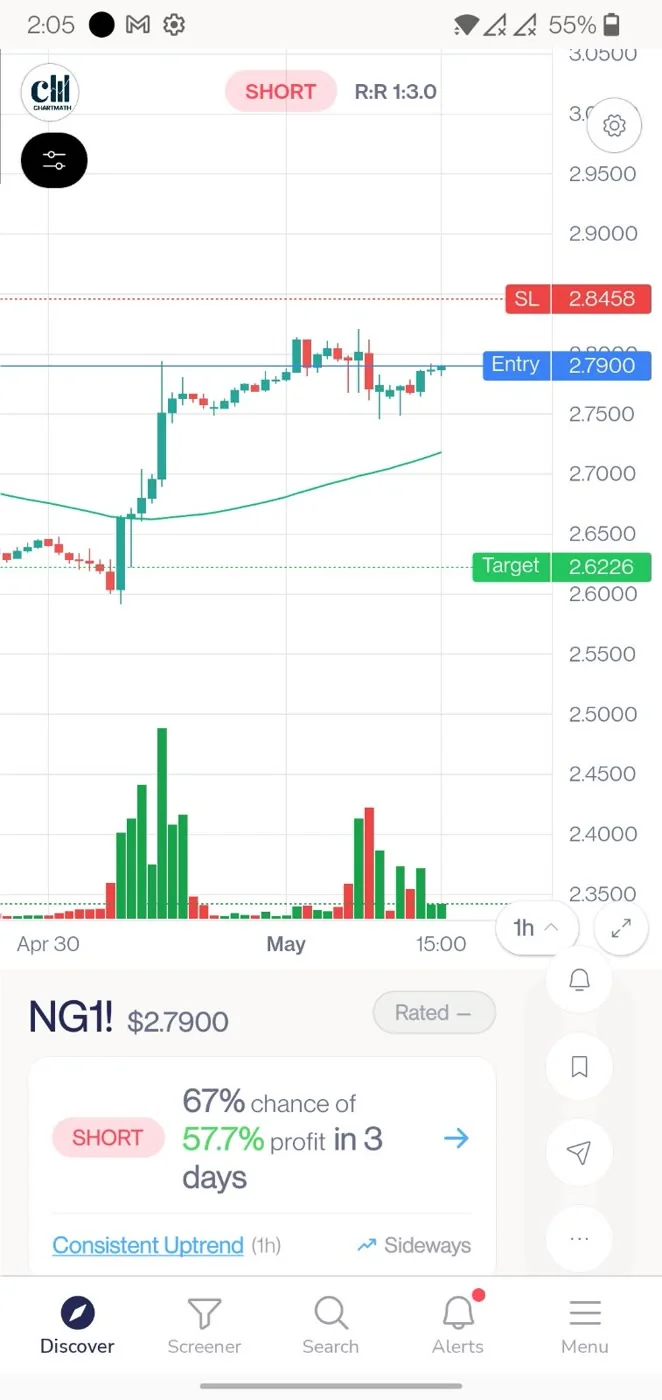
Every screen in ChartMath comes with backtest data: Win Rate, Average Return, EV (expected value), and sample size. These are the numbers you should look at before deciding whether a setup is worth trading.
A few things to understand about how to read this data correctly:
Win Rate is not "Accuracy"
The metric is Win Rate. Not accuracy, not success rate, not hit rate. Win Rate tells you the percentage of historical instances where the setup produced a positive return based on the defined exit conditions. A 60% Win Rate means 6 out of 10 historical instances were winners under those exit rules.
Win Rate and Average Return work together
A high Win Rate with a small Average Return can still be a positive EV setup. A lower Win Rate with a large Average Return can also be positive EV. The EV figure combines both, giving you a single number that reflects the expected value per trade based on historical data. Look at all three together, not just the Win Rate in isolation.
Backtests have limits
ChartMath's backtests use bar-close entries with no look-ahead bias. They do not model commissions, slippage, or spread. For futures specifically, spread and slippage can be meaningful on fast-moving contracts like CL or NQ during high-volatility periods. The backtest data is evidence of historical edge, it is not a guarantee of future results, and it doesn't account for your specific execution costs.
Historical performance is a starting point for evaluating a setup, not a promise. Use it to filter for screens with a documented edge, then apply your own judgment about market conditions, position sizing, and risk management before you execute. For a deeper look at how to use backtest data in your decision process, the Backtesting Strategies guide is worth reading.
The backtest tells you whether a setup has historically worked. The chart tells you whether conditions are right today. You need both before you risk capital.
6. Apply the Copilot Model: Alert Fires, You Decide
ChartMath is a copilot, not an autopilot. It surfaces the setup. You make the call.
There is no broker connection. There is no auto-trading. ChartMath does not place orders, adjust stops, or manage positions. When an alert fires on a 5-minute VWAP Reclaim on NQ, the app has done its job: it found the setup, showed you the historical Win Rate and Average Return, and put the information in front of you. What happens next is entirely your decision.
This is the right model for retail day traders, for a few reasons:
- Context matters. A technically valid setup can still be a bad trade if there's a Fed speaker at 10:00 AM, if the broader market is in a risk-off session, or if the contract is approaching a major resistance level. The scanner can't know your full context. You can.
- Execution is personal. Your position size, your stop placement, your target, these depend on your account size, your risk tolerance, and your current exposure. No automated system can make those decisions for you without knowing all of that.
- You keep control. Automated trading systems can and do malfunction. A copilot model means the worst case is a missed trade, not an unintended position.
The practical workflow looks like this: alert fires on your phone, you open the app to see the screen details and backtest data, you open your charting platform to check the current chart and context, you size the trade based on your risk rules, and you execute in your own brokerage. ChartMath handles the scanning. You handle the trading.
For traders who are still building out the rest of their workflow around this model, the How to Trade Without Watching Charts All Day guide covers the full setup.
Putting It All Together: A Sample Futures Scanning Workflow
Here's what a practical futures scanning day looks like using ChartMath:
Before the session (pre-9:30 AM ET)
Open the Screener tab and browse the Daily and Weekly screens for ES, NQ, and CL. You're not looking for entries here, you're building context. Is ES in a Daily uptrend or downtrend? Is CL compressing near a key level? This takes 5-10 minutes and gives you the macro backdrop for the session.
Session open (9:30-10:30 AM ET)
This is when ORB and VWAP Reclaim alerts are most likely to fire. You've already favorited those screens, so push notifications will come to your phone the moment a futures contract enters one of them. You don't need to watch charts. When the alert fires, you open the app, check the Win Rate and Average Return on that screen, then open your charting platform to confirm the setup looks clean in context.
Midday (10:30 AM - 2:00 PM ET)
Futures often chop during the midday session. Momentum Breakout and Low Volatility Compression screens are more relevant here, they flag contracts that are coiling for a potential afternoon move. If an alert fires, apply the same process: check the backtest data, check the chart, decide.
Afternoon session (2:00 PM - 4:00 PM ET)
The last two hours of the regular session often see a pickup in volume and directional movement, especially in equity index futures. VWAP-related screens and momentum screens are worth watching again here. Any alerts that fired during the day are logged in the Alerts tab, so you can review what fired and what the outcome was.
End of day review
Spend 5 minutes in the Alerts tab reviewing what fired during the session. Which screens triggered? What were the Win Rates on those screens? Did the setups follow through? This is how you build a feedback loop between the scanner's historical data and your own live trading results.
The entire workflow runs on the iOS or Android app. You can also browse screens on the web at chartmath.com/screens, but the alerts and the Discover feed are mobile-first. Get the app at chartmath.com/app.
Frequently Asked Questions
Which US futures does ChartMath cover?
ChartMath covers 11 US futures contracts, including equity index futures (ES, NQ, YM, RTY), energy (CL, NG), metals (GC, SI), and rates/bonds (ZB, ZN). All sessions are referenced in Eastern Time.
Can I build my own futures screen?
No. ChartMath's 200+ screens are curated and read-only. There is no screen builder and no Pine Script. The curation is the point: every screen has been backtested before it ships, so you're working with setups that have a verified historical track record rather than building from scratch.
How are futures alerts delivered?
Alerts are delivered via push notification and in-app. There is no SMS and no email. When a futures contract enters a screen you've favorited, you get a push notification with the ticker, timeframe, screen name, filter rules, timestamp, and a deep link back into the app.
Do the backtests account for futures-specific costs like rollover or commissions?
No. ChartMath's backtests use bar-close entries with no look-ahead bias, but they do not model commissions, slippage, spread, or futures-specific costs like rollover. The Win Rate and Average Return figures are pre-cost. Factor in your own execution costs when evaluating whether a setup's historical edge is sufficient for your trading.
Is ChartMath free to use?
ChartMath is a paid product with a 14-day free trial (no card required to start). After the trial it's $24.99/month founding pricing (locked for 12 months) or $149/year.
Start Scanning Futures Systematically
Futures day trading rewards preparation. The traders who catch the ES ORB at 9:35 AM or the NQ VWAP Reclaim at 10:15 AM aren't watching charts every minute, they've built a system that watches for them. ChartMath's 11 US futures, 200+ backtested screens, and push alert system are the infrastructure for that system.
You don't need to code it. You don't need to build it from scratch. You need to pick the right screens, set up alerts on the setups that match your style, and let the scanner surface the opportunities while you focus on the decision and the execution.
Browse the full screen library at chartmath.com/screens to see which setups are available for futures. When you're ready to get alerts on your phone, download the app at chartmath.com/app. Start with a 14-day free trial, then $24.99/mo founding (locked 12 months) or $149/yr — no card to start.

Ankush Jindal
LinkedInSee these setups live in ChartMath
200+ curated screens with backtest data. 14-day free trial.