How to Trade Futures Without Watching Charts All Day

Futures don't care about your calendar. The ES can gap 20 points overnight. Crude oil can spike during a 10 AM meeting. NQ can set up a clean breakout at 2:15 PM while you're on a call. If you've tried to trade US futures with a day job, you already know the core problem: the market doesn't pause, and you can't watch.
Most retail traders respond to this by either giving up on futures entirely or by trying to scalp 1-minute charts during lunch, which is a recipe for stress and bad decisions. There's a third option that most people overlook: use a backtested scanner with push alerts so the market watches itself, and you only look when something worth looking at has already formed.
This guide walks through exactly how to do that, using the 11 US futures ChartMath covers as the practical example.
Why Futures Are Hard to Trade With a Day Job
The standard advice for futures trading assumes you're sitting at a desk with multiple monitors, watching tick charts, and ready to act within seconds. That's the professional day trader setup. For the 25-to-45-year-old with a full-time job, that setup doesn't exist between 9 AM and 5 PM.
Futures aren't inherently untradable for part-time traders. The real problem is that most retail tools are built for screen-watchers. Static screeners like Finviz don't cover futures at all. Charting platforms like TradingView let you build alerts, but you still have to know which setup to watch for, on which instrument, at which timeframe, and whether that setup has ever actually worked historically.
The result: most part-time traders either skip futures entirely or take setups they can't evaluate. Neither is a good outcome.
ChartMath covers 11 US futures across 200+ curated, backtested technical screens and 7 timeframes. The same method that lets a day-job trader catch equity setups without screen-watching applies directly to those futures instruments. The scanner runs continuously. When a futures instrument enters a screen you've favorited, you get a push alert. You check the setup card on your phone. You decide. You execute in your own broker.
That's the workflow. The rest of this guide breaks it into six concrete steps.
1. Understand What You're Actually Trying to Catch
Before setting up any scanner, it helps to be clear about what kind of futures trade fits a day-job schedule. There are two very different approaches, and only one of them is realistic without constant screen time.
Scalping vs. Swing-Style Futures Entries
Scalping futures on 1-minute or 5-minute charts requires you to be present, focused, and ready to act in seconds. That's not compatible with a meeting schedule. If you miss the entry by three minutes, the setup is gone. This style of trading is essentially off the table for anyone who can't dedicate full sessions to the screen.
Swing-style futures entries are different. You're looking for setups that form over hours or days, where the entry window is measured in hours rather than seconds. A Daily-timeframe breakout on the ES, for example, gives you time to see the alert, check the setup card during a break, and place the order before the close. The setup doesn't evaporate in 90 seconds.
This distinction matters because it determines which timeframes you should be scanning. For part-time traders, the Daily and 1-hour timeframes are where most of the actionable futures setups live. The 1-minute and 5-minute timeframes are still available in ChartMath, and they're useful if you can check your phone during a break, but they shouldn't be your primary focus if you can't act quickly.
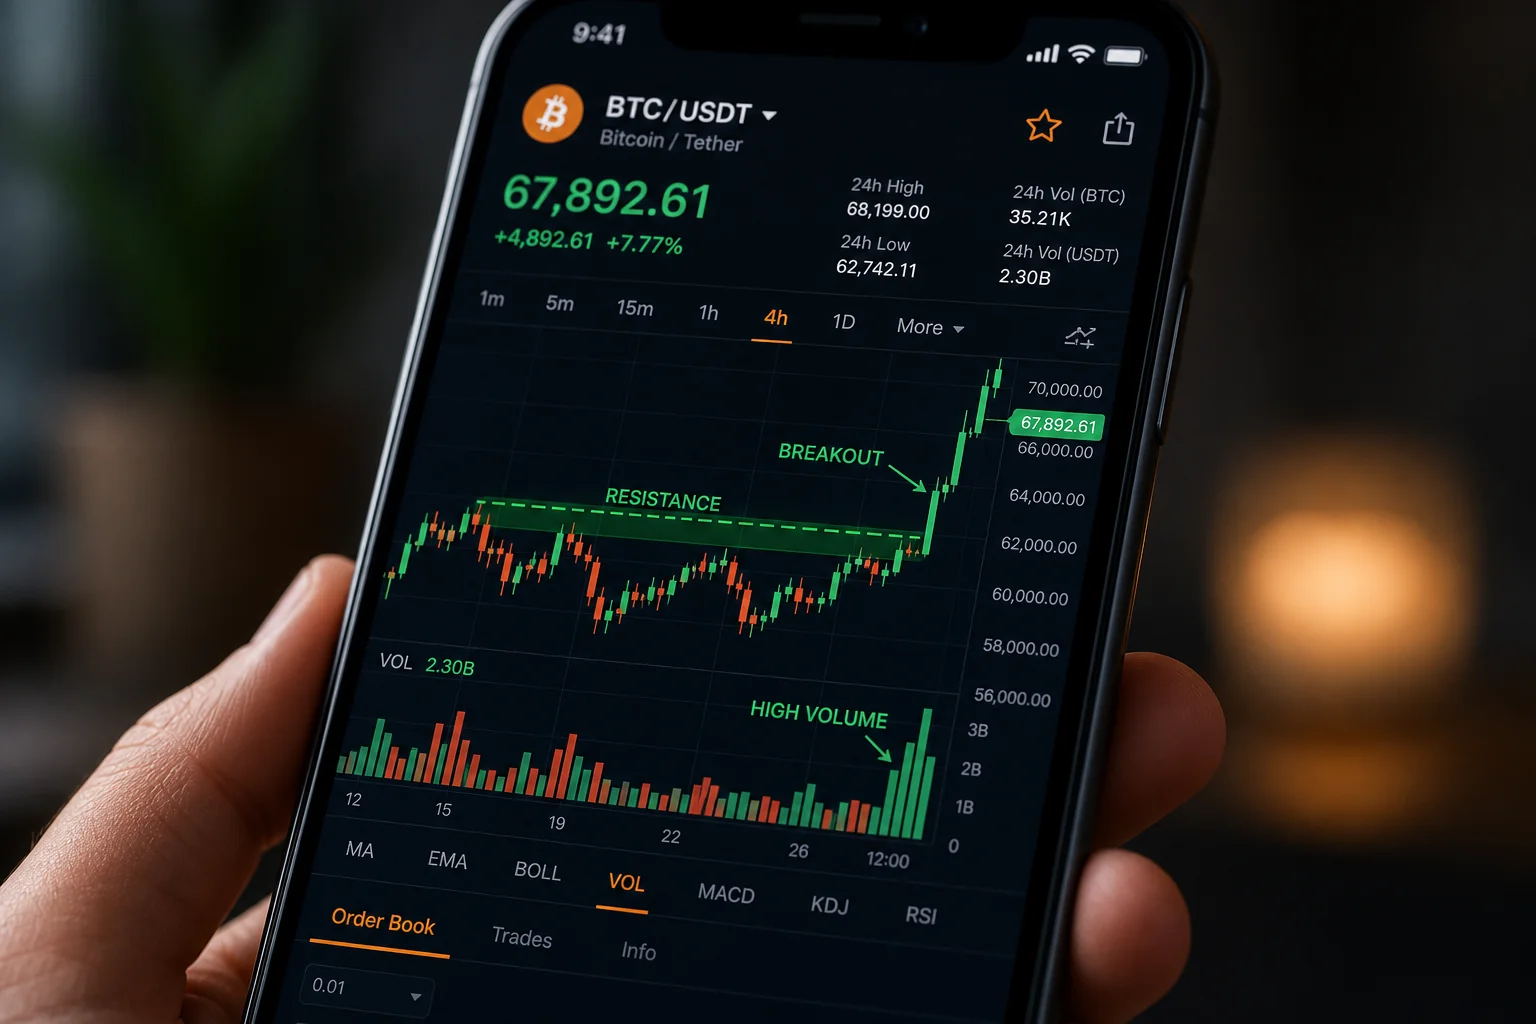
Why Pattern-Based Setups Can Be Screened
Futures setups based on technical patterns, such as breakouts, VWAP reclaims, momentum signals, and volatility compressions, are rule-based. If a setup has a defined set of conditions, a scanner can check those conditions continuously and alert you the moment they're met. You don't need to watch the chart. The scanner watches it for you.
This is the core insight behind using a backtested screener for futures. The setup either meets the rules or it doesn't. When it does, you get a push notification. You review the historical track record on that screen. You decide whether to act. That entire process can happen in under two minutes on your phone.
For a deeper look at how this applies to equity setups, see How to Trade Stocks Without Watching Screen All Day, which covers the same method for the 500+ US equities ChartMath scans.
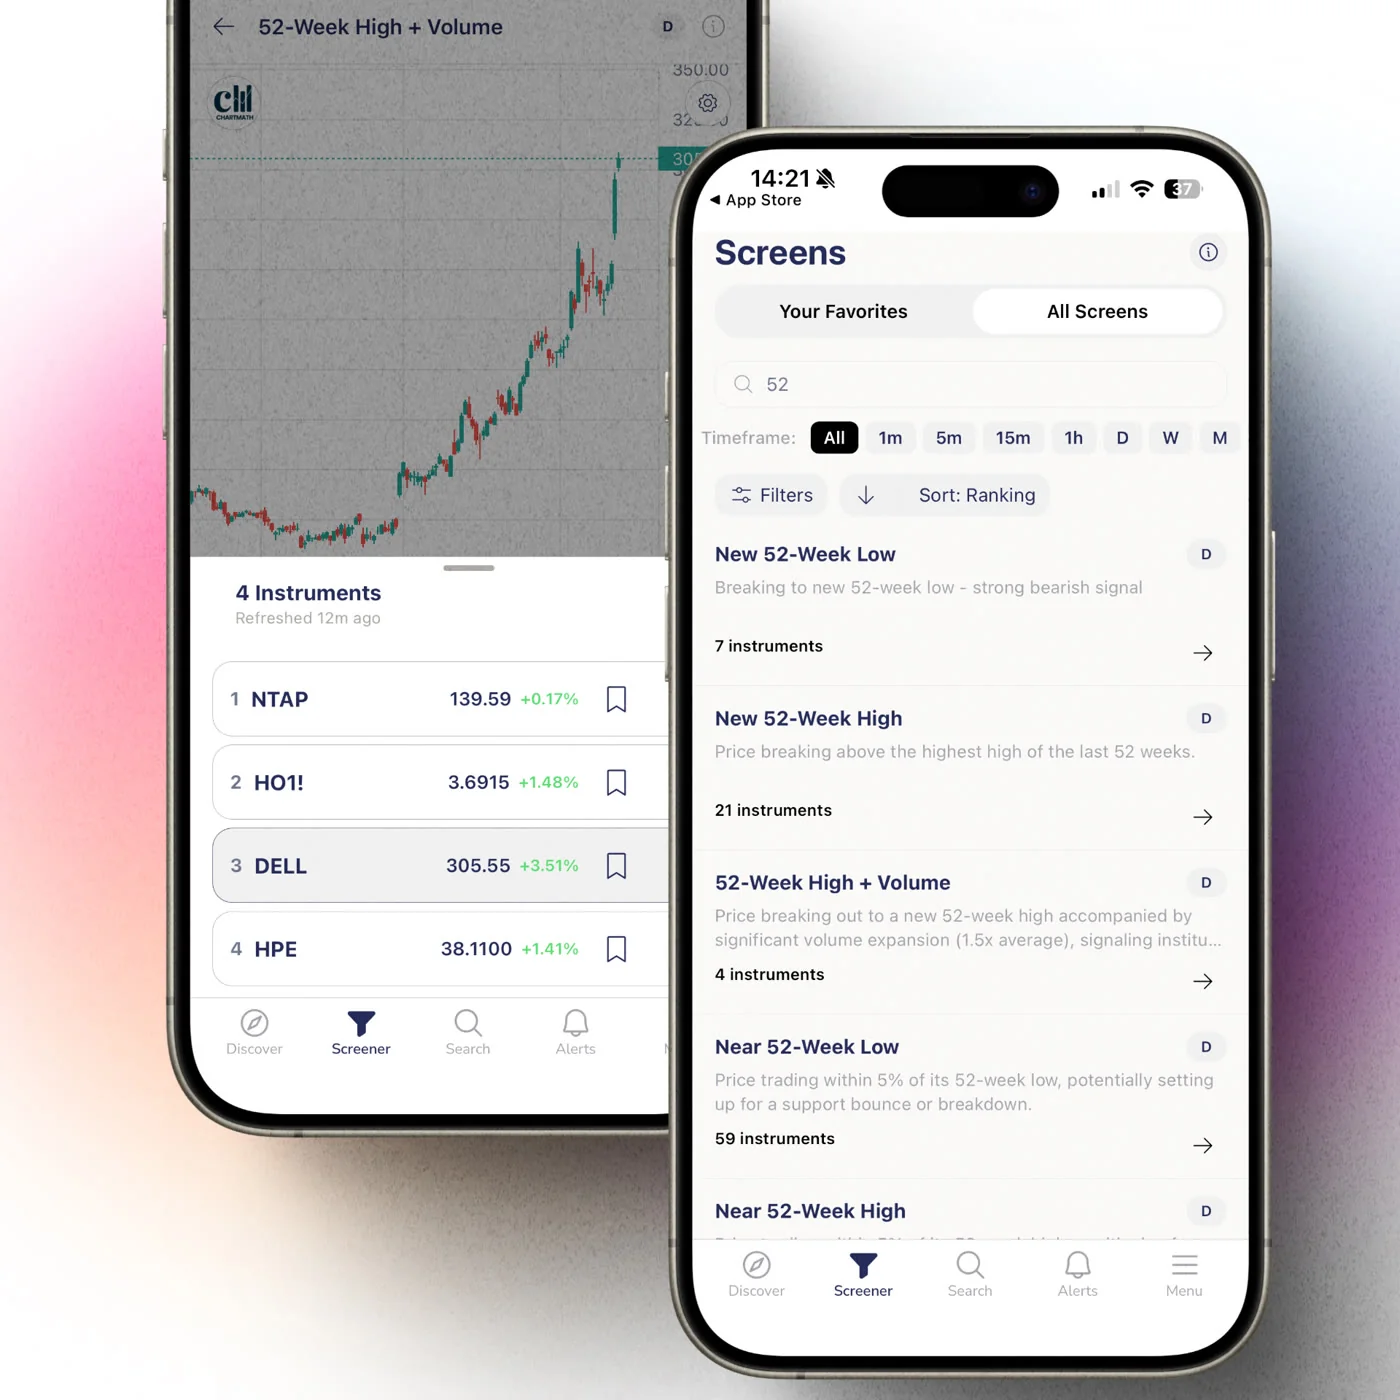
2. Pick Setups With a Documented Track Record
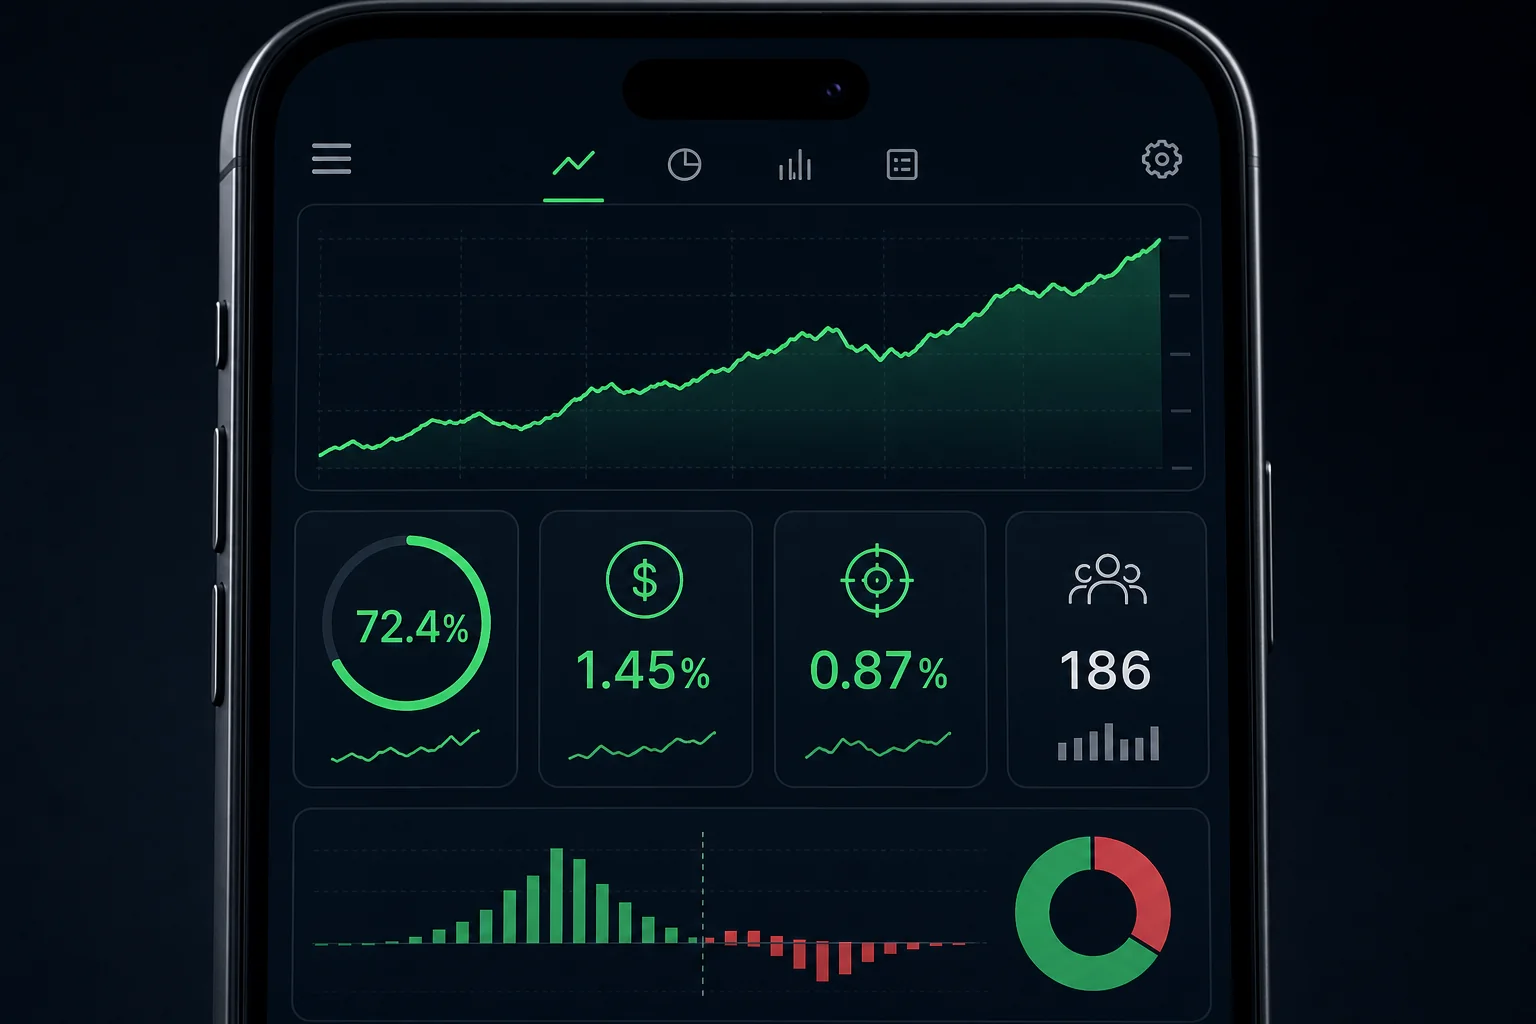
Trading a futures setup without knowing whether it has historically worked is just gambling with extra steps. Before you risk capital on any setup, you need to know two things: how often it has worked in the past (Win Rate) and what the average outcome looked like when it did (Average Return).
ChartMath's 200+ curated screens each carry a backtested track record. Every screen shows its historical Win Rate, Average Return, expected value (EV), and sample size. These are the same metrics for every instrument that enters the screen, including the 11 US futures ChartMath covers. You're not guessing whether the setup has edge. You're reading a documented history.
What the Metrics Actually Mean
Win Rate tells you the percentage of historical instances where the setup produced a positive outcome. A 60% win rate means six out of ten historical occurrences moved in the expected direction.
Average Return tells you the average gain across winning trades. A high win rate with a low average return is a different risk profile than a lower win rate with a high average return. Both numbers together, along with EV, give you a complete picture of the setup's historical behavior.
Sample size matters too. A 70% win rate across 12 occurrences is much less meaningful than a 65% win rate across 200 occurrences. ChartMath shows the sample size on every screen card so you can judge the statistical weight behind the number.
One important note: these are historical backtested figures, not forecasts or guarantees. Past performance on a screen does not predict future results. What it does give you is a rational basis for deciding whether a setup is worth your attention, which is more than most retail tools offer.
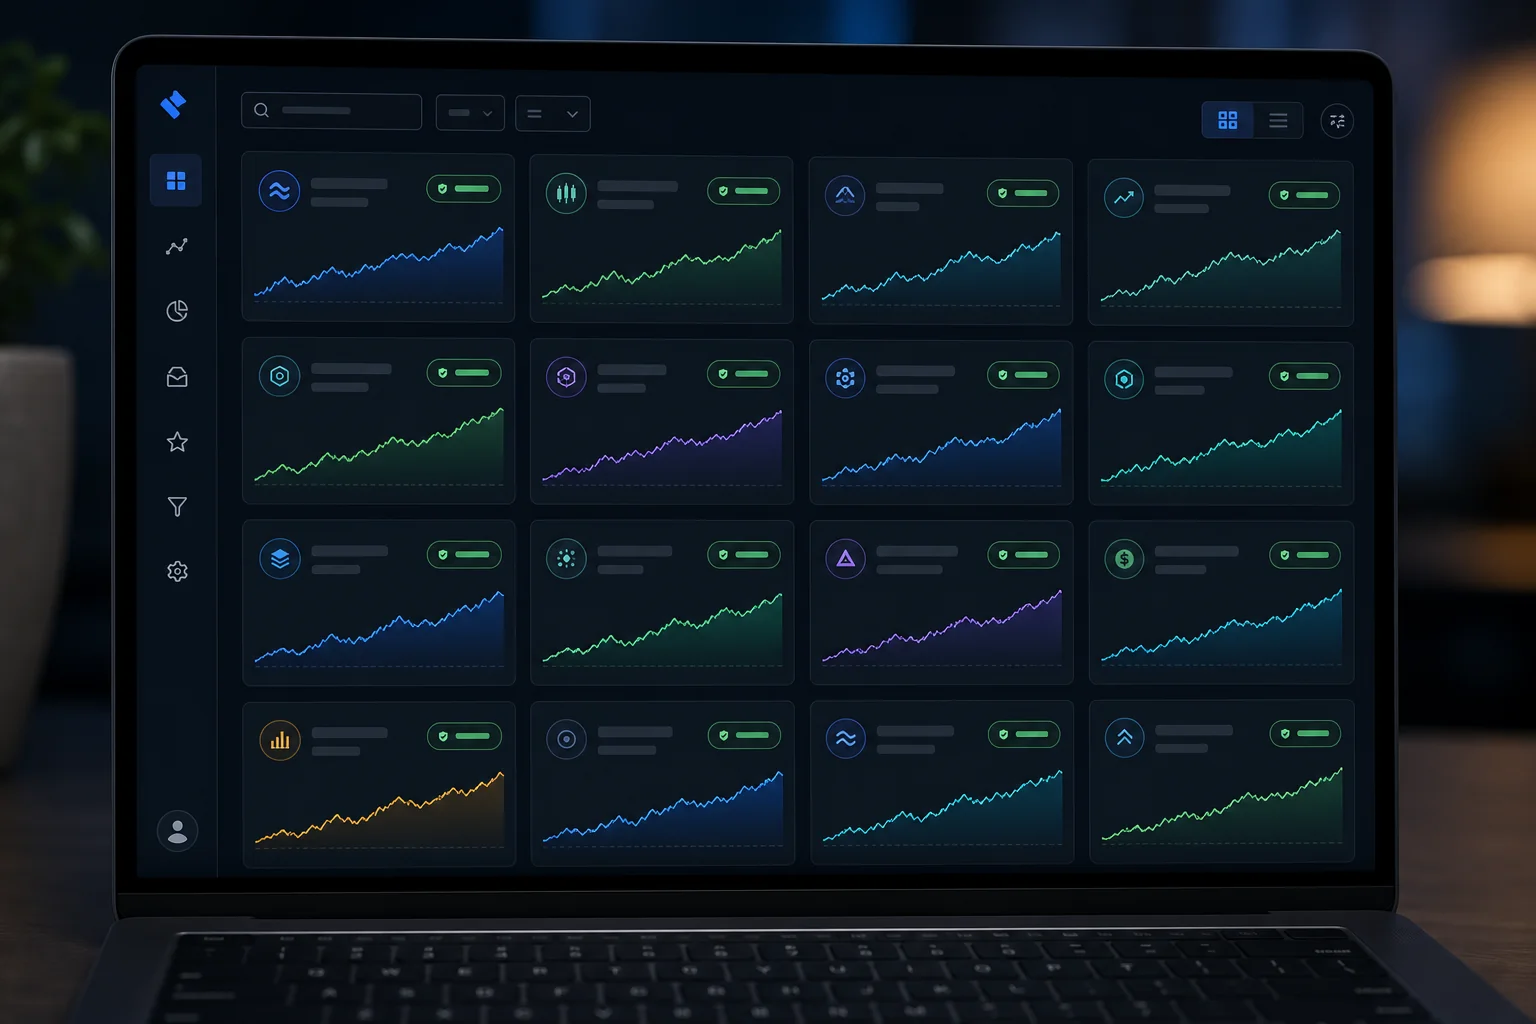
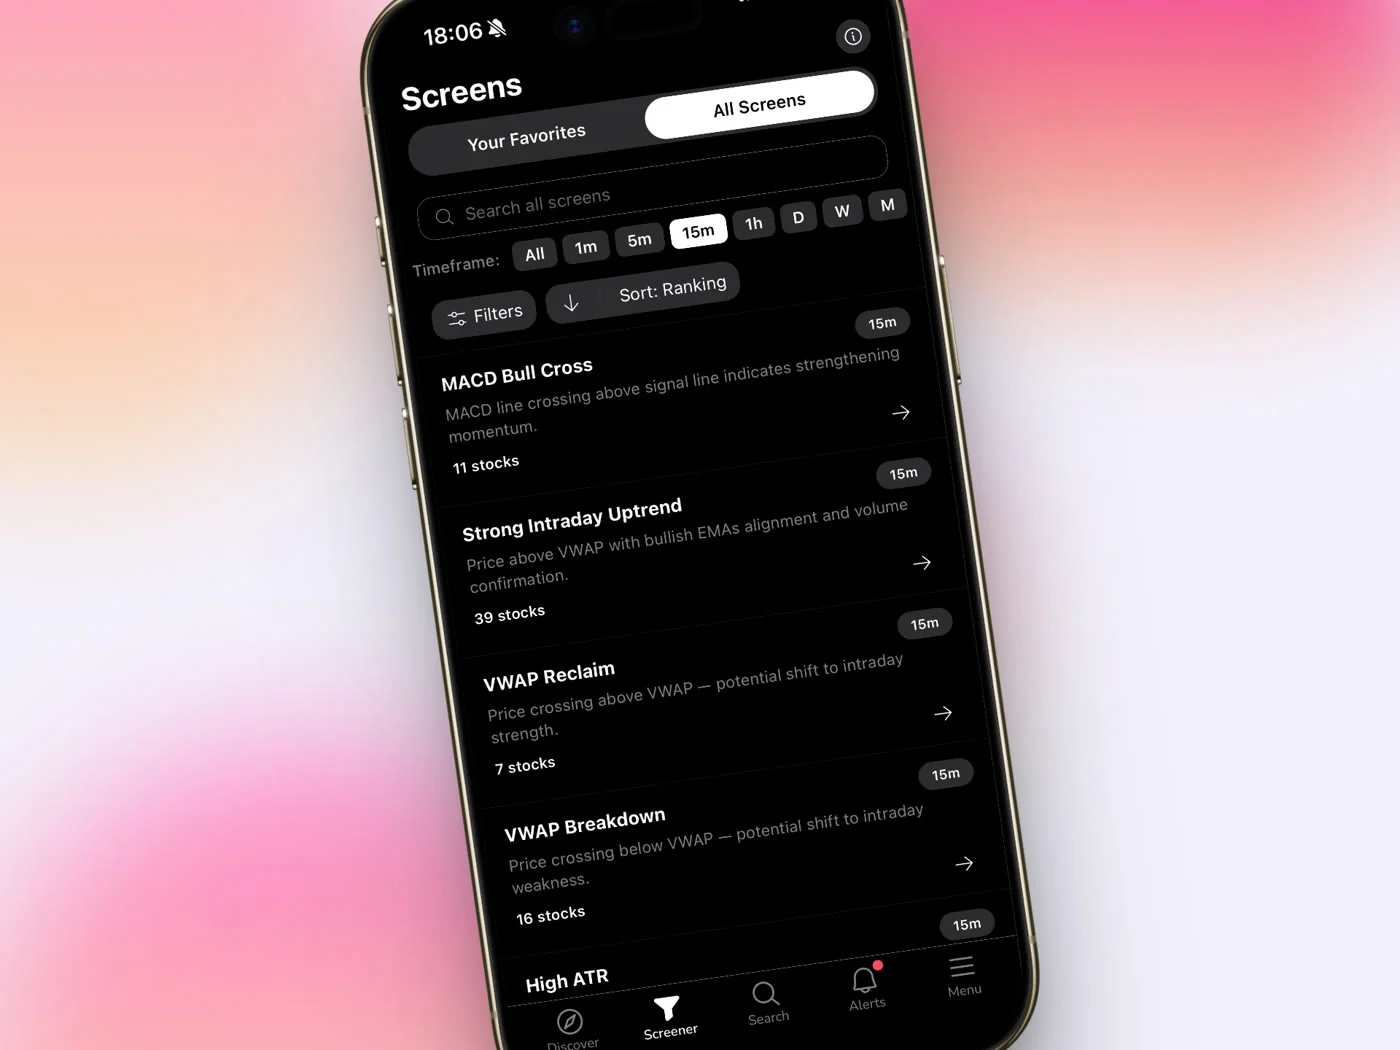
No Pine Script, No Coding Required
ChartMath's screens are pre-built and curated. You don't write code, build filters, or configure anything from scratch. There's no Pine Script, no custom formula editor, no screen builder. You browse 200+ ready-made screens, favorite the ones relevant to your strategy, and the scanner does the rest. For a full look at how that works, see Stock Scanner Without Pine Script: 200+ Ready-Made Screens.
3. Choose the Right Timeframe for Your Schedule
ChartMath scans across 7 timeframes: 1m, 5m, 15m, 1h, Daily, Weekly, and Monthly. For futures trading with a day job, timeframe selection is one of the most important decisions you'll make, because it directly determines how much lead time you have between the alert and the entry window.
Daily and Weekly: The Part-Time Trader's Home Base
A setup that forms on the Daily timeframe gives you hours to act. If an alert fires at 11 AM on a Daily-timeframe breakout, you can check the setup card at lunch, evaluate the historical edge, and place the order before the close. The entry window is measured in hours, not seconds.
Weekly timeframes are even more forgiving. A setup forming on the Weekly chart gives you days to evaluate and act. These setups tend to have larger average moves and require less precision on entry timing, which suits a trader who can only check their phone a few times a day.
1-Hour: The Middle Ground
The 1-hour timeframe is a practical middle ground for futures traders with a day job. Setups form over several bars, the entry window is typically 30 to 90 minutes wide, and you can often act during a break without rushing. Many of the most reliable futures setups, including momentum breakouts and VWAP-based entries, show up cleanly on the 1-hour chart.
For more on how VWAP setups work across timeframes, see VWAP Trading: How to Use Volume-Weighted Average Price.
Intraday Timeframes: Use With Caution
The 1-minute, 5-minute, and 15-minute timeframes are available and useful, but they require faster action. A 5-minute setup alert that fires at 10:15 AM may have a valid entry window of 15 to 30 minutes. If you're in a meeting, that window closes before you see the notification. Use intraday timeframes only if you can realistically check your phone within 20 minutes of an alert firing.
4. Set Up Push Alerts So the Scanner Watches for You
This is the step that makes the whole system work for a day-job trader. Instead of watching charts, you let ChartMath watch them for you and notify you when something worth looking at has formed.
How the Alert System Works
ChartMath sends alerts via push notification and in-app. When you favorite a screen in the app, you're telling ChartMath to watch that screen continuously and notify you the moment any instrument in the covered universe, including the 11 US futures, enters that screen.
The alert payload tells you the instrument, the timeframe, and the screen name. You tap the notification, it deep-links directly to the setup card, and you can evaluate the historical edge right there on your phone. No logging in, no searching, no navigating. The alert takes you straight to the relevant information.
Alert Hygiene: Why You Won't Get Spammed
One of the legitimate concerns with any alert system is noise. If every minor signal triggers a push notification, you'll start ignoring all of them, which defeats the purpose. ChartMath addresses this with built-in alert hygiene: de-duplication prevents the same setup from firing multiple times in a short window, throttling limits the rate of alerts per instrument, and timezone-aware quiet hours mean you're not getting pinged at 3 AM.
The result is a notification that actually means something when it arrives. For a broader look at how to manage alert noise, see How to Avoid Alert Fatigue From Stock Screeners.
Copilot, Not Autopilot
ChartMath does not place trades. It has no broker connection and no order-execution capability. When an alert fires, you get the information. You decide whether the setup meets your criteria. You execute in your own brokerage. That's the copilot model: the scanner surfaces the setup, the trader keeps the call.
This matters for futures specifically, because futures positions carry leverage and require active risk management. No tool should be making those decisions for you automatically.
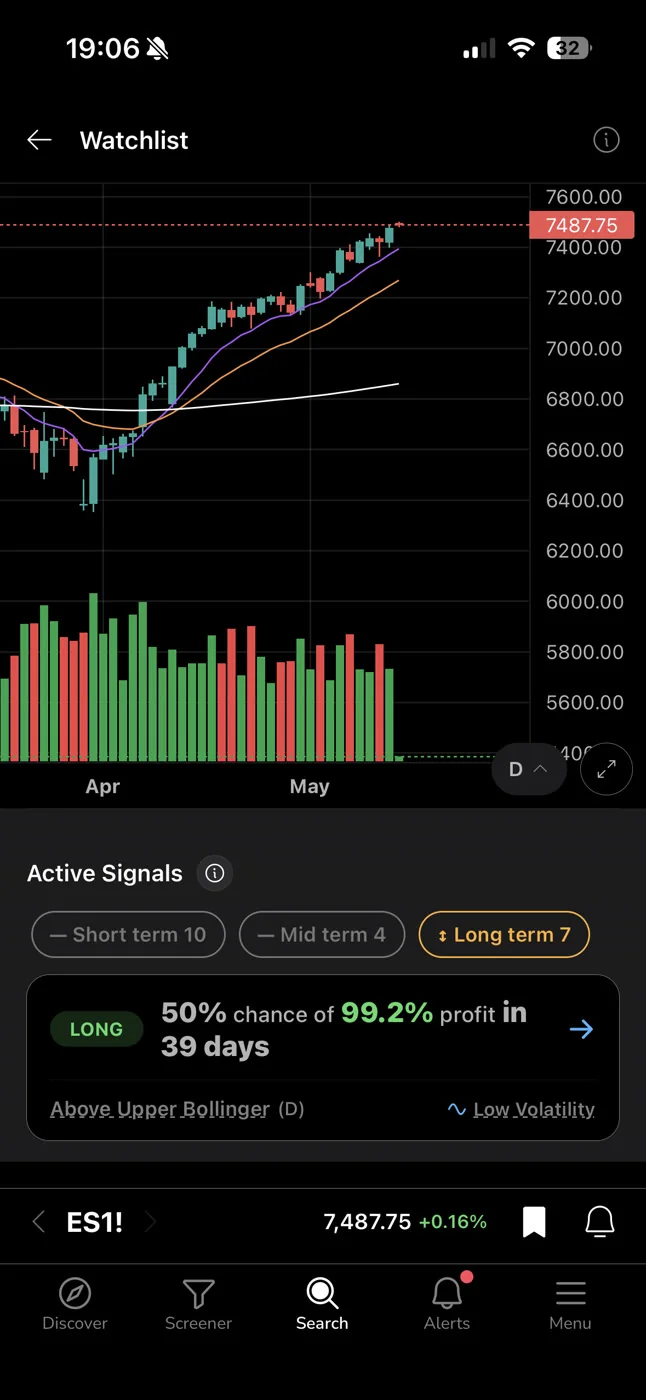
5. Read the Setup Card Before You Act
Getting the alert is step one. Evaluating the setup before you act is step two. This is where most traders either skip the process entirely (and trade on impulse) or get overwhelmed and do nothing. The setup card in ChartMath is designed to give you everything you need to make a fast, informed decision.
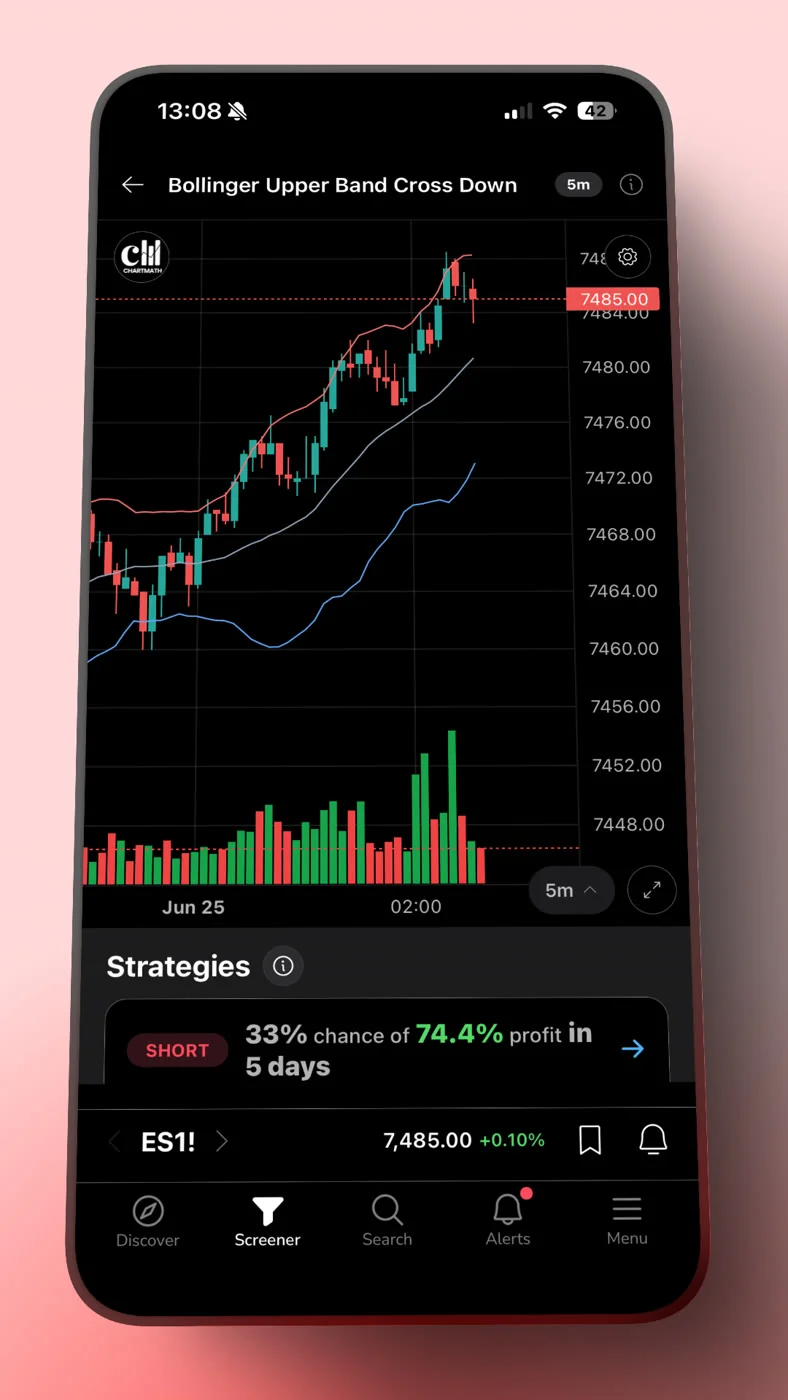
What the Setup Card Shows
Each setup card displays the screen's filter rules in plain English, so you can see exactly what conditions the instrument met to trigger the alert. It's not a black box. You can read the rules, understand the logic, and decide whether the setup aligns with your own criteria.
Alongside the rules, the card shows the screen's historical Win Rate, Average Return, EV, and sample size. These are the same backtested figures for every instrument that enters the screen. You're not seeing a personalized prediction for this specific instrument. You're seeing the historical track record of the screen itself, which tells you how setups matching these rules have performed in the past.
The card also shows a freshness stamp, so you know how recently the setup formed. A setup that fired 48 minutes ago on a Daily timeframe is still actionable. A setup that fired 6 hours ago on a 15-minute timeframe probably isn't.
A Quick Evaluation Framework
When you open a setup card after an alert, run through these four questions before acting:
- Does the Win Rate and sample size justify the trade? A screen with a strong historical win rate across a meaningful sample size gives you a rational basis for the entry. A screen with 8 historical occurrences does not.
- Is the setup still fresh? Check the freshness stamp. If the entry window has passed, skip it and wait for the next one.
- Does the timeframe match your schedule? A 1-minute setup that fired 25 minutes ago may already be resolved. A Daily setup that fired this morning is still in play.
- Do the screen rules make sense to you? You should be able to read the filter conditions and understand why this instrument qualified. If you can't, that's a signal to learn more about the setup before trading it.
For a deeper look at how to evaluate backtested win rates before risking capital, see How to Build Winning Backtesting Strategies: A Complete Guide.
6. Build a Repeatable Futures Workflow in Under 30 Minutes a Day
The goal of this entire system is to make futures trading compatible with a full-time job. That means the active time you spend on trading should be short, focused, and predictable. Here's what a realistic daily workflow looks like.
Morning (5 Minutes)
Before you start your workday, open the Discover feed in ChartMath. Swipe through the setup cards that fired overnight or in the premarket session. Focus on Daily and Weekly timeframe setups on the 11 US futures. These are the setups with the longest entry windows, so you have time to act during the day if they look compelling. Note the ones worth watching and move on.
During the Day (Passive)
You don't watch charts. Push alerts handle this. If a setup forms on a screen you've favorited, your phone notifies you. You check the alert during a break, evaluate the setup card in 60 to 90 seconds, and decide whether to act. If the entry window is still open and the historical edge justifies the trade, you place the order in your broker. If not, you dismiss the alert and get back to work.
This is the core value of the alert system for futures trading. The market doesn't stop moving because you're in a meeting. The scanner doesn't stop watching because you're unavailable. The alert bridges the gap.
Evening (15 to 20 Minutes)
After the session closes, spend 15 to 20 minutes reviewing the day. Open the Alerts tab to see what fired. Check the Screener tab to browse screens that are currently showing strong historical edge on futures instruments. Build your watchlist for tomorrow's session. This is the planning window where you decide which screens to favorite and which timeframes to prioritize.
For a structured approach to this kind of end-of-day review, see Swing Trading with a Full-Time Job: A Real System, which covers the same workflow applied to equities.
Weekend (Optional, 20 Minutes)
Once a week, browse the full screen library at chartmath.com/screens. Look at which screens have the strongest historical edge across the futures instruments you trade. Adjust your favorited screens based on what you find. This is the maintenance step that keeps your alert system calibrated to setups with genuine historical backing.
Frequently Asked Questions
Which US futures does ChartMath cover?
ChartMath covers 11 US futures. These are scanned across the same 200+ curated technical screens and 7 timeframes as the 500+ US equities and 100 crypto pairs in the covered universe. The full universe is: 500+ US equities, 100 crypto pairs, and 11 US futures, across 7 timeframes from 1-minute to monthly.
Do I need to watch charts all day to trade futures with ChartMath?
No. The scanner runs continuously and sends push alerts when a futures instrument enters a screen you've favorited. You check the alert when you're available, evaluate the setup card, and decide whether to act. For Daily and 1-hour timeframe setups, the entry window is wide enough that you can act during a break without rushing.
What timeframes work best for part-time futures traders?
Daily and 1-hour timeframes give you the most lead time between the alert and the entry window. Weekly timeframes are even more forgiving. Intraday timeframes (1m, 5m, 15m) are available but require faster action, so they're best used only when you can check your phone within 20 minutes of an alert.
Does ChartMath place trades automatically?
No. ChartMath is a copilot, not an autopilot. It surfaces setups and sends alerts. You decide whether to act and execute in your own brokerage. There is no broker connection and no auto-trading capability.
Is ChartMath free to use?
ChartMath is a paid product with a 14-day free trial (no card to start). After the trial it's $24.99/month founding pricing (locked for 12 months) or $149/year.
Start Catching Futures Setups Without the Screen Time
Trading US futures with a day job is a solvable problem. The solution isn't a better charting setup or a faster internet connection. It's a scanner that watches the market for you, a backtested track record on every setup it surfaces, and a push alert that reaches you the moment something worth looking at has formed.
ChartMath covers 11 US futures alongside 500+ US equities and 100 crypto pairs, all scanned across 200+ curated, backtested screens. No Pine Script. No coding. No screen-watching required.
Get the app at chartmath.com/app (iOS and Android), or browse the full screen library at chartmath.com/screens to see which setups have the strongest historical edge before you favorite a single screen.
Start with a 14-day free trial, then $24.99/mo founding (locked 12 months) or $149/yr — no card to start.

Ankush Jindal
LinkedInSee these setups live in ChartMath
200+ curated screens with backtest data. 14-day free trial.