How to Validate a Swing Trade Setup Before You Risk Capital
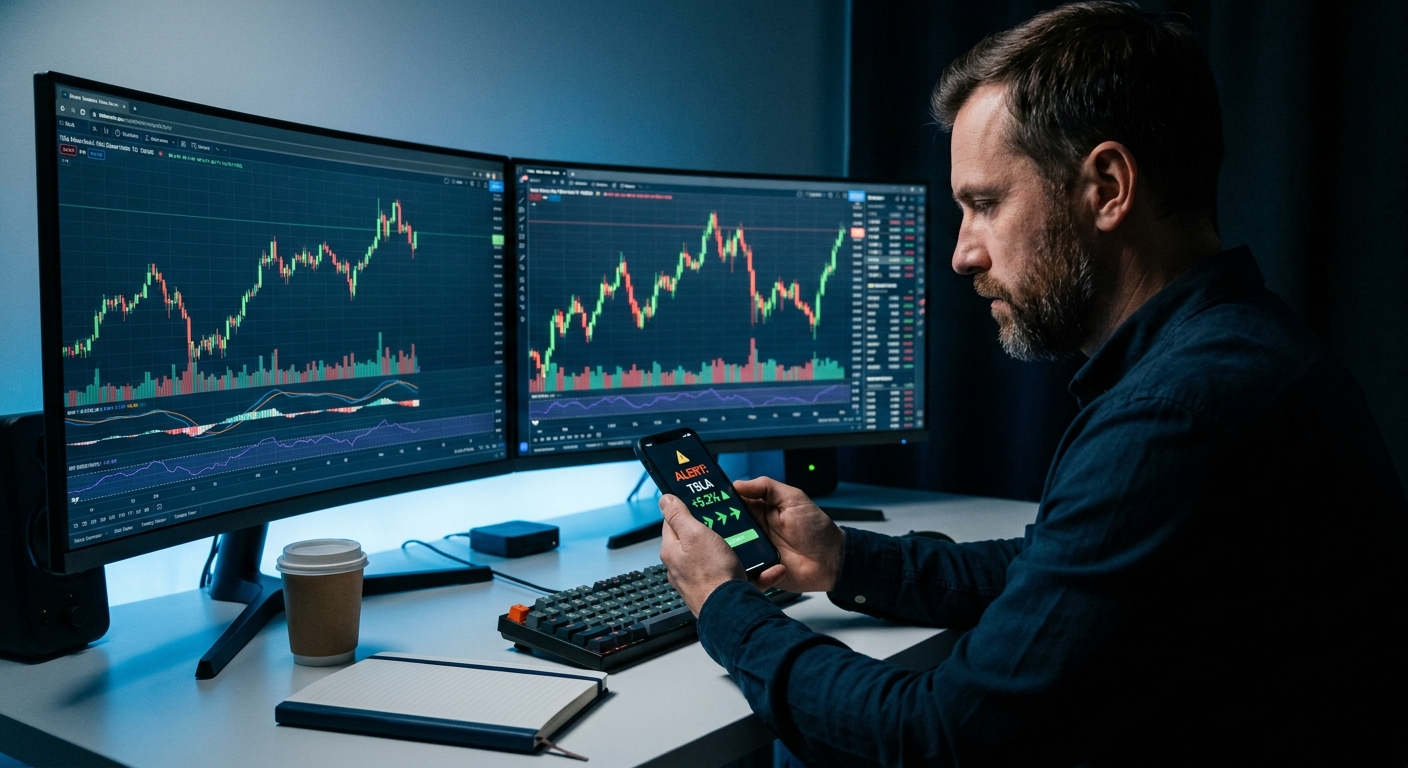
Most traders have a setup they love. Maybe it's a clean daily chart breakout above a multi-week base. Maybe it's a VWAP reclaim on elevated volume. Whatever it is, there's a moment — right before you hit the buy button — where you either have a real reason to be in the trade, or you're just hoping the chart does what you want it to do.
That gap between "the chart looks good" and "I have evidence this setup works" is where most trading accounts quietly bleed out. Not in one catastrophic blow-up, but in a slow accumulation of low-conviction trades that never had a real edge behind them.
This post lays out a five-step validation framework you can apply to any technical setup before risking capital. We'll also show how an end of day swing trade scanner with embedded backtest data can compress this entire process from 45 minutes of manual work to about 90 seconds on your phone.
Why Most Traders Skip Validation (And Pay for It)
Here's the uncomfortable truth: most retail traders don't have a validation process. They have a feeling. The chart looks clean. The setup "reminds them" of a winner from three months ago. A Discord alert fired and everyone seems excited. So they enter.
This isn't a character flaw, it's a workflow problem. Proper setup validation, done manually, takes time most traders don't have. If you're a swing trader with a day job, you're doing your chart review at 9 PM after dinner. You've got maybe 30-45 minutes before you need to sleep. Spending 20 of those minutes validating a single setup means you're only reviewing two or three tickers per night, which means you're missing most of the market.
So traders cut corners. They skip the backtest check. They eyeball the volume. They assume the daily chart is enough without checking the hourly. And then they wonder why their win rate is inconsistent.
The fix isn't to spend more time. It's to build a faster, more systematic process. Here's what that looks like across five concrete steps.
1. Check Historical Win Rate for the Specific Setup
Win rate is the most misunderstood metric in retail trading. Traders either obsess over it ("I need to be right 70% of the time") or dismiss it entirely ("win rate doesn't matter, only R:R does"). Both extremes miss the point.
What actually matters is setup-specific win rate, not your overall win rate across all trades, but the historical performance of this exact pattern, on this type of stock, in this timeframe. A 55% win rate on a clean daily breakout above a 10-week base is very different from a 55% win rate across a mix of random trades you took because the chart "looked good."
What to Look For in Backtest Data
When you're evaluating a setup's historical win rate, you want to see at minimum:
- Sample size: At least 30-50 historical instances. Fewer than that and the win rate is statistically meaningless.
- Timeframe specificity: A setup that works on the daily chart may have a completely different win rate on the 15-minute chart. They're different setups.
- Ticker context: Large-cap liquid stocks behave differently from small-cap momentum names. Win rates should reflect the type of stock you're actually trading.
- Average return per winner vs. average loss per loser: Win rate without this context tells you nothing about profitability.
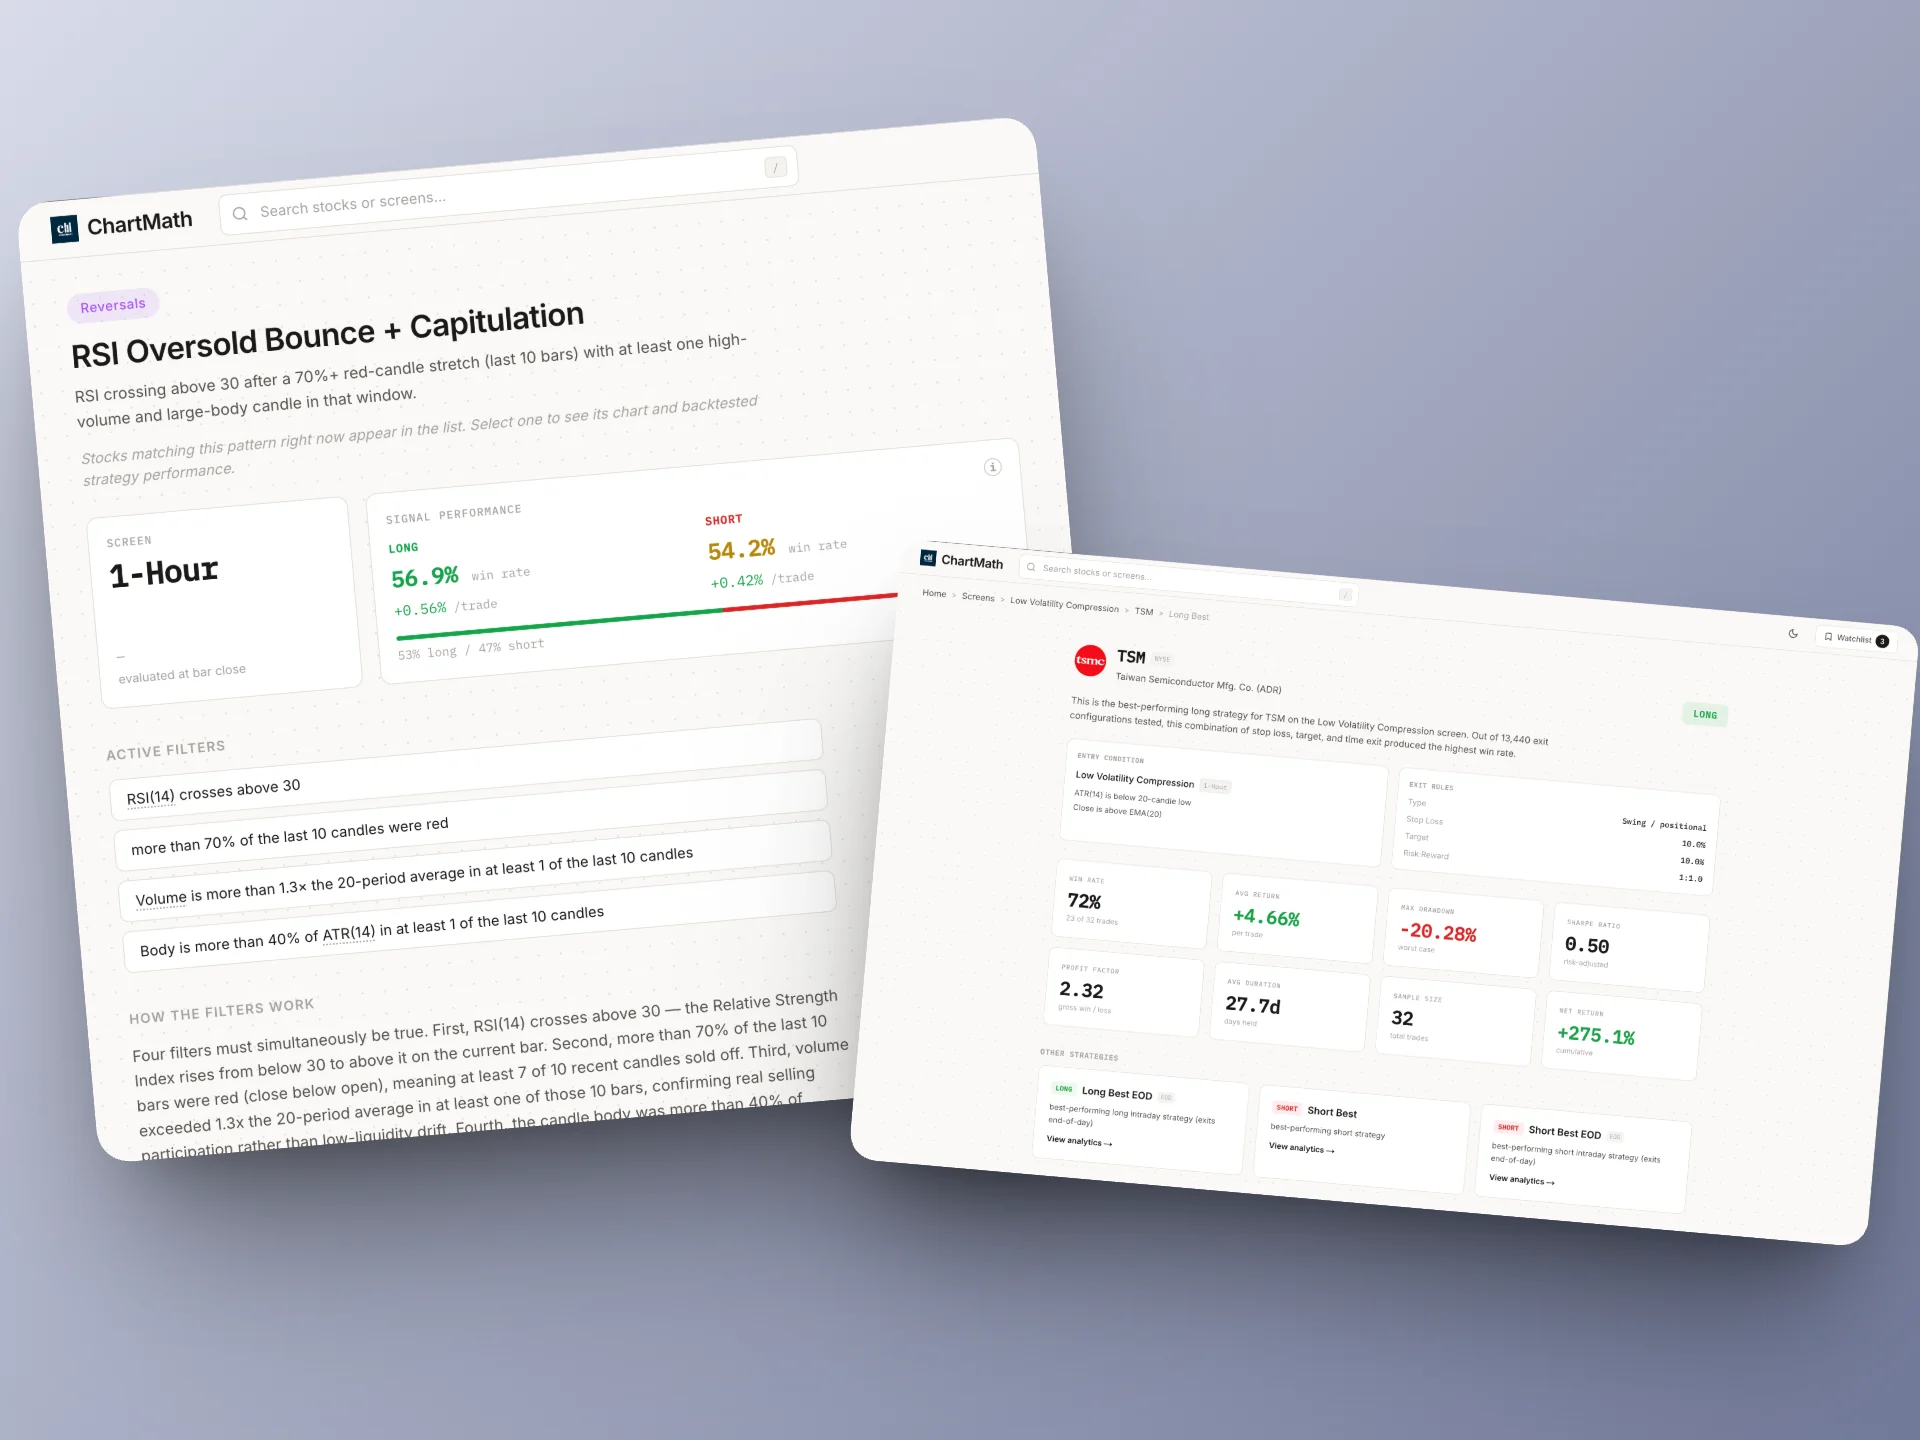
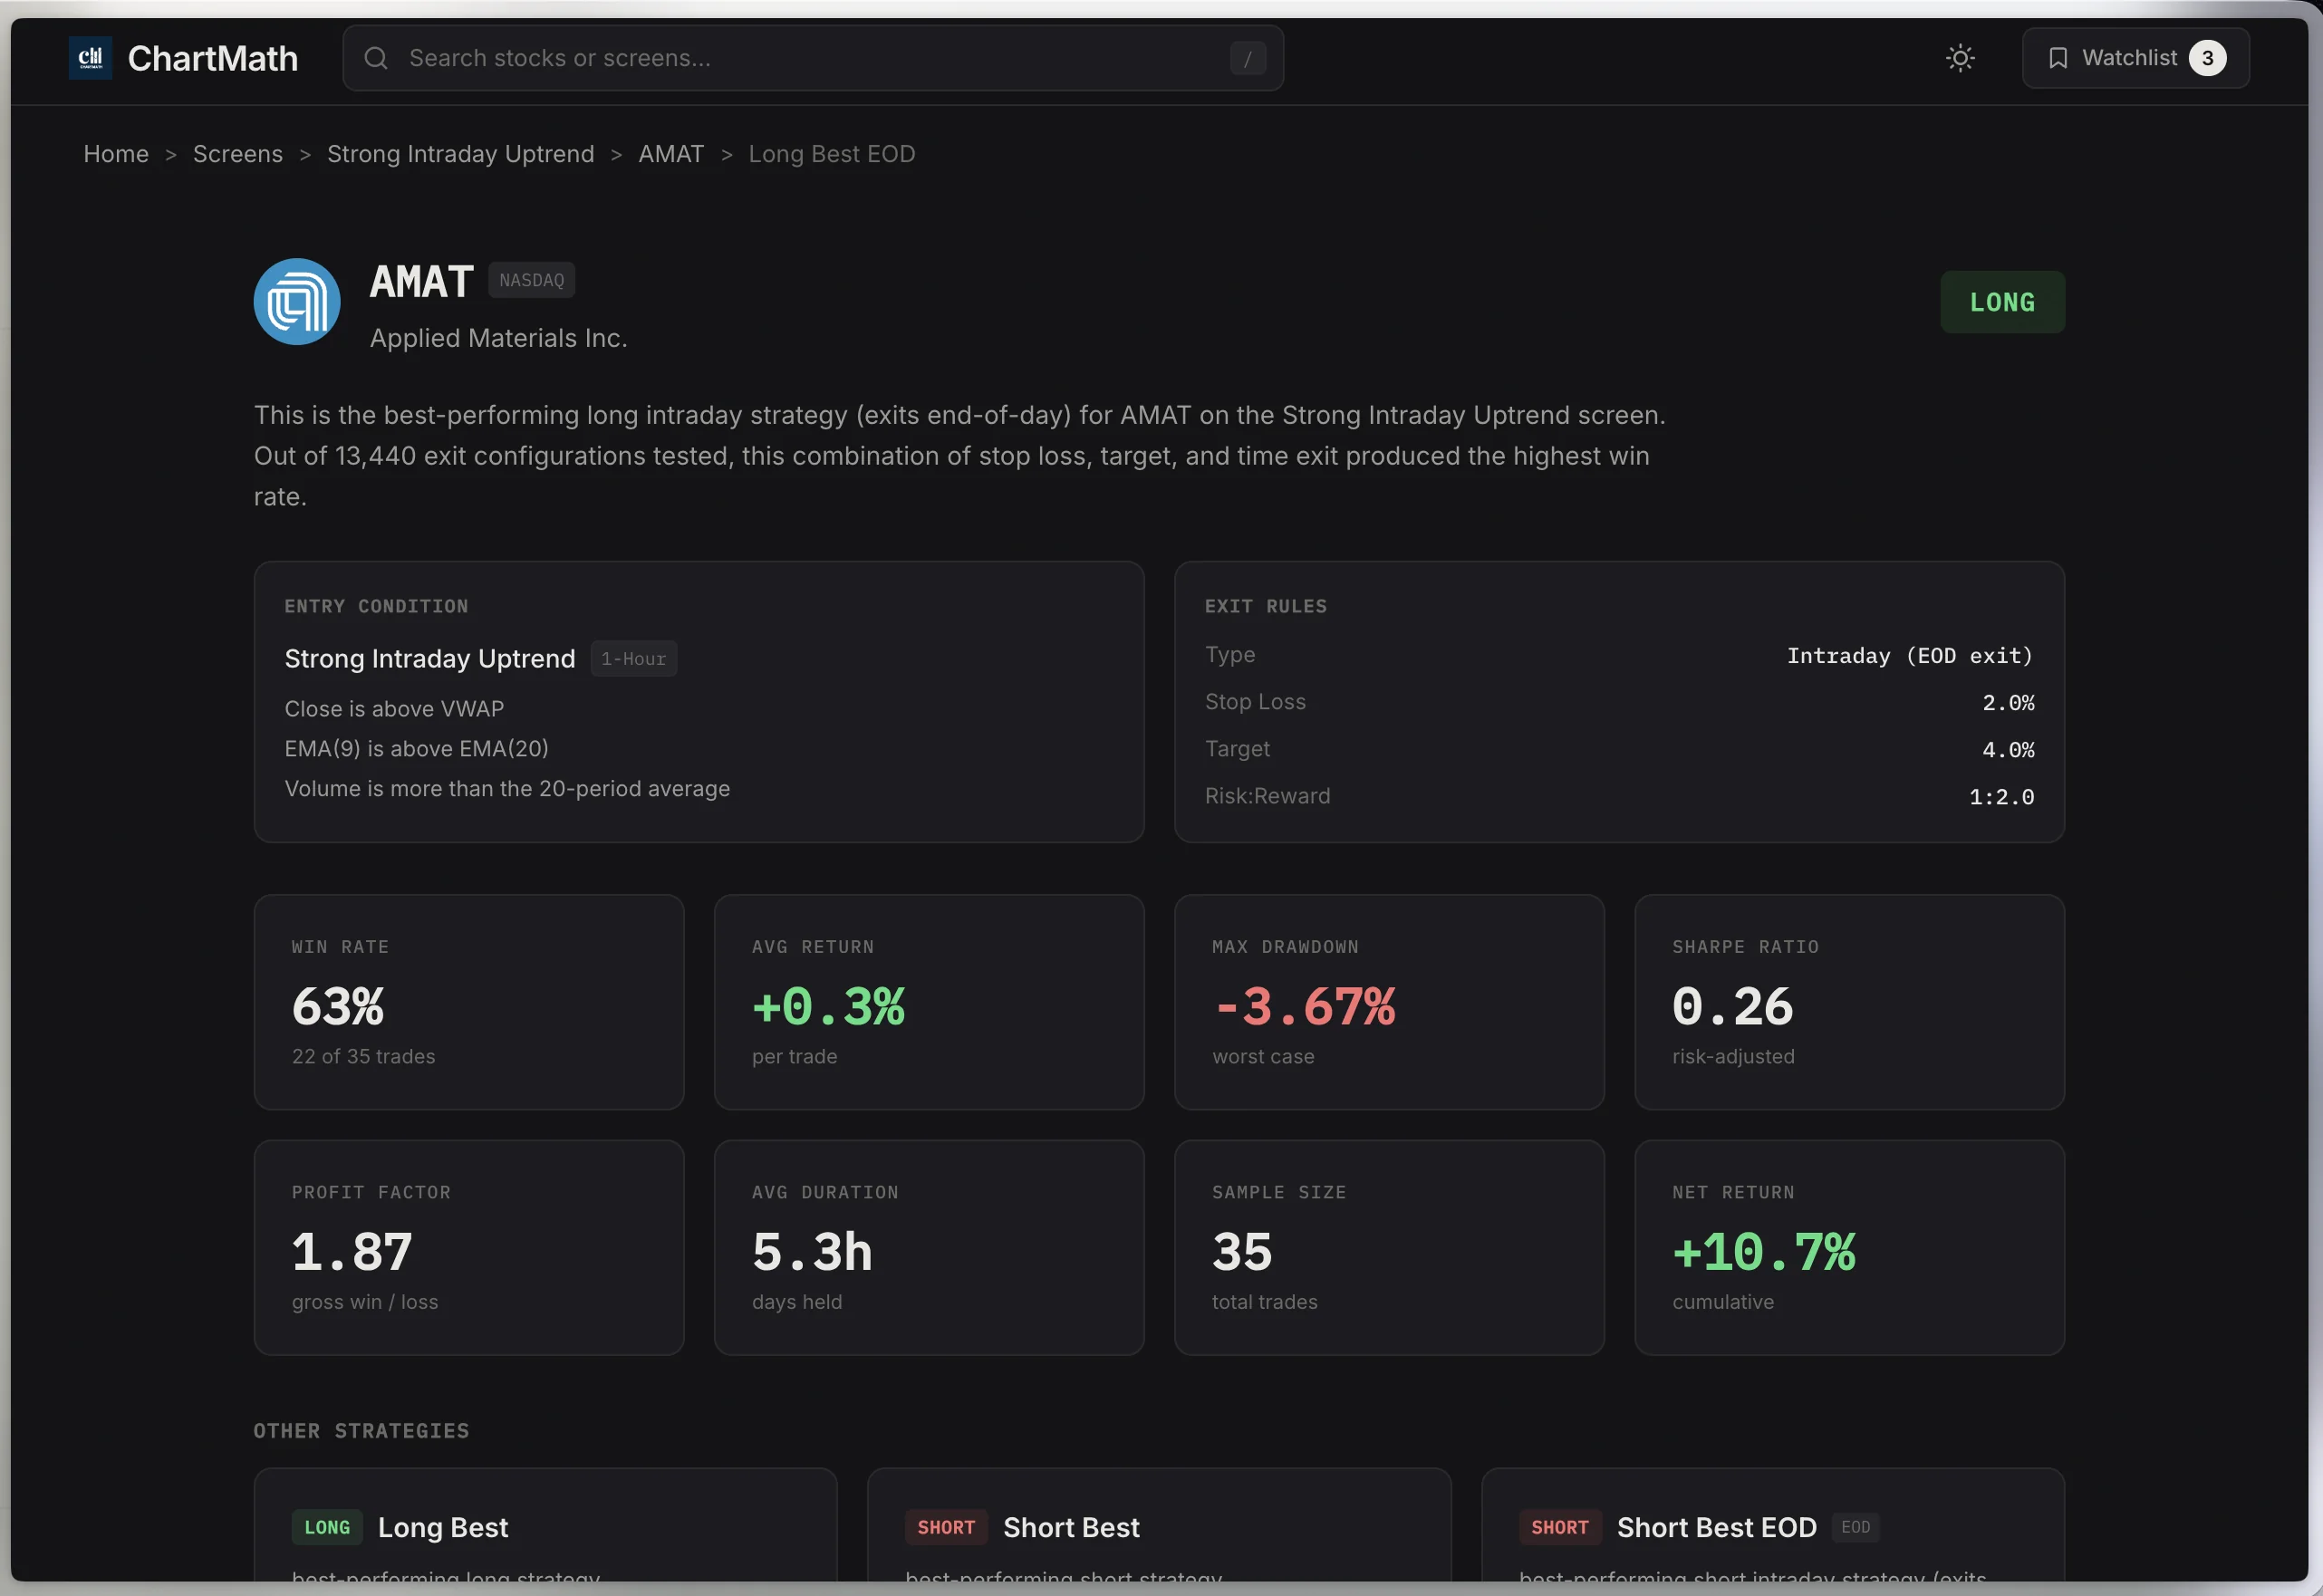
This is exactly the kind of data ChartMath surfaces for every screen in the app. Take the Strong Intraday Downtrend (15m) screen tested on AAPL as a concrete example. The URL itself tells you the full validation context:
- Screen name (
strong-intraday-downtrend-15m): The specific technical pattern being tested, in this case, a strong intraday downtrend identified on the 15-minute timeframe. - Ticker (
AAPL): The backtest is run against Apple's actual historical price data, not a generic market average. - Direction (
long): This shows the trade direction being evaluated, going long (buying) when this pattern appears, which is a counter-trend or mean-reversion angle on a downtrend setup. - Sort (
best): The results are sorted to surface the highest-performing historical instances of this pattern first, so you can see what the setup looks like when it works, and calibrate your entry criteria accordingly.
That level of specificity is what separates real validation from guesswork. You're not asking "does this pattern work in general?" You're asking "does this pattern work on this stock, in this direction, on this timeframe?" Those are very different questions with very different answers.
For a deeper dive into building a backtesting process from scratch, the complete guide to winning backtesting strategies covers the methodology in detail.
2. Evaluate the Risk-Reward Ratio Before Entry
Once you know a setup has a real historical edge, the next question is: does this specific trade instance offer a good enough reward relative to the risk you're taking?
The math here is straightforward. Before entering any trade, you need three numbers:
- Entry price: Where you're getting in.
- Stop loss: The price level where the setup is invalidated, where you're wrong.
- Target: A realistic price objective based on the chart structure (next resistance, measured move, prior high).
Your risk-reward ratio is simply the distance from entry to target divided by the distance from entry to stop. A trade where you risk $1 to make $2 is a 1:2 R:R. For swing trades, a minimum of 1:2 is the standard baseline. Many experienced swing traders won't touch anything below 1:2.5.
Why Win Rate and R:R Work Together
Here's the counterintuitive part that trips up newer traders: a 40% win rate can be highly profitable if your average winner is 2.5x your average loser. Conversely, a 65% win rate can be a losing strategy if your average loss is bigger than your average win.
This is why backtest data that shows both win rate and average return per trade is so much more useful than win rate alone. When ChartMath's strategy analytics show you a screen's historical performance, you're seeing the full picture, not just how often it wins, but how much it wins when it's right and how much it loses when it's wrong. That combination tells you whether the setup has a genuine positive expectancy.
3. Confirm Volume, The Setup's Lie Detector
A chart pattern without volume confirmation is a rumor, not a signal. This is especially true for breakout and momentum setups, where the entire thesis depends on institutional participation driving price through a key level.
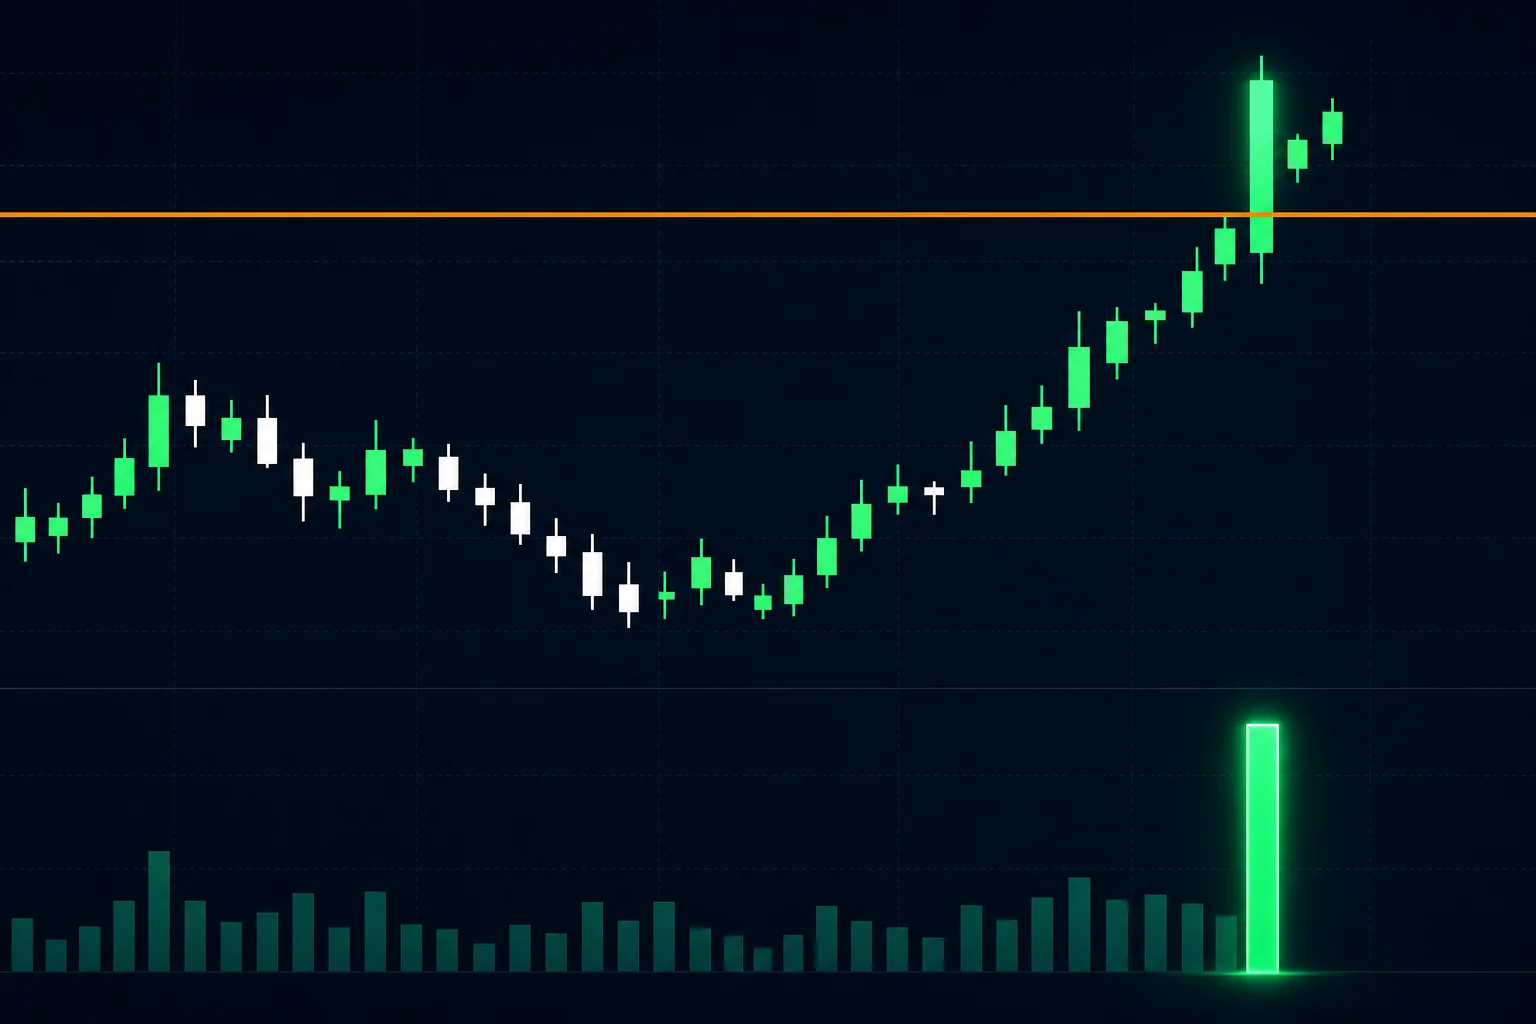
The metric you want here is RVOL (Relative Volume), current volume compared to the average volume for that time of day. An RVOL of 1.0 means volume is exactly average. An RVOL of 2.0 means twice the normal volume is trading. For breakout setups, you generally want to see:
- RVOL 1.5x or higher for a setup to be worth considering
- RVOL 2x or higher for high-conviction breakout entries
- RVOL 3x+ for momentum plays where you're chasing a move already in progress
Volume Confirmation by Setup Type
Different setups have different volume requirements. A daily chart breakout above a 10-week base needs strong volume on the breakout candle itself, that's the institutional buying signal. A VWAP reclaim on the 15-minute chart needs volume to confirm the reclaim is holding, not just a brief spike above the line. A momentum continuation play needs sustained above-average volume throughout the move, not just at the initial trigger.
Understanding which volume pattern validates which setup type is one of the most practical skills in technical trading. The guide to RVOL and volume spikes breaks down exactly how to read volume for different trade types. And for VWAP-specific setups, the VWAP trading guide covers the volume confirmation patterns that matter most.
4. Align Timeframes, Daily, Hourly, and Intraday
Timeframe alignment is the validation step most traders either skip entirely or do incorrectly. The principle is simple: your higher timeframe sets the directional bias, and your lower timeframe gives you the entry timing. When those two are in conflict, the setup is weak regardless of how clean it looks on either chart individually.
The Three-Timeframe Stack for Swing Traders
For swing traders, a practical timeframe stack looks like this:
- Daily chart: Sets the primary trend and identifies the key level you're trading around (breakout level, support/resistance, moving average). This is your "should I be long or short this stock?" answer.
- 1-hour chart: Confirms the setup is forming cleanly at the right level and gives you a tighter entry window. This is your "is the setup actually developing?" check.
- 15-minute chart: Provides the precise entry trigger, the candle pattern, the volume spike, the level break that tells you to pull the trigger.
A setup where all three timeframes agree is a high-conviction trade. A setup where the daily is bullish but the hourly is in a downtrend is a low-conviction trade, you're fighting the intermediate trend to catch a daily-chart move, and the odds are against you.
What Timeframe Conflict Looks Like
The most common timeframe conflict for swing traders: a stock is in a clear daily uptrend, but the 1-hour chart has been making lower highs for three days. The daily chart looks great. The hourly chart says the stock is in a short-term distribution phase. Entering on the daily signal alone means you're buying into near-term selling pressure, and your stop will likely get hit before the daily trend reasserts itself.
ChartMath's multi-timeframe screens are built specifically to surface setups where the timeframes are aligned, not conflicting. The 15-minute screen that triggered on AAPL in the example above is evaluated in the context of the broader trend, so you're not getting a 15-minute signal that's fighting the daily chart direction.
For a complete breakdown of how to stack timeframes for both day trading and swing trading, the VWAP vs RVOL vs ORB comparison covers how each indicator behaves across different timeframes.
5. Cross-Check Market Context
The same setup that works beautifully in a trending market can fail repeatedly in a choppy, range-bound environment. This isn't a flaw in the setup, it's a feature of how markets work. Breakout strategies need trending conditions to deliver their historical win rates. Mean-reversion strategies work better when the market is oscillating. Momentum plays need broad market participation to sustain moves.
Three Context Checks Before Any Trade
Before entering a setup that passes the first four validation steps, run these three quick context checks:
- Broad market trend: Is the S&P 500 or Nasdaq in a clear trend, or is it chopping between support and resistance? Breakout setups in a choppy broad market have significantly lower win rates than the same setups in a trending market.
- Sector strength: Is the stock's sector showing relative strength or weakness? A bullish setup in a stock from a sector that's been underperforming for two weeks is fighting a headwind. The same setup in a leading sector has a tailwind.
- Upcoming catalysts: Earnings dates, Fed announcements, and major economic data releases can invalidate a technical setup entirely. A clean breakout two days before earnings is a different trade than the same breakout in a quiet news environment.
None of these checks require hours of research. A 60-second scan of the major index charts and a quick check of the stock's earnings date is enough to either confirm or disqualify a setup based on context. The premarket trading strategy guide covers how to incorporate market context into your morning routine efficiently.
How an End of Day Swing Trade Scanner Compresses This to Seconds
Walk through the five validation steps above manually for a single setup and you're looking at 10-15 minutes of work. Do that for 20 tickers on your watchlist and you've just spent your entire evening on research, with nothing left for actual trade planning or position sizing.
This is the core problem an end of day swing trade scanner with embedded backtest data solves. Instead of running each validation step manually, the scanner does the filtering work for you and surfaces only the setups that already pass the key criteria.
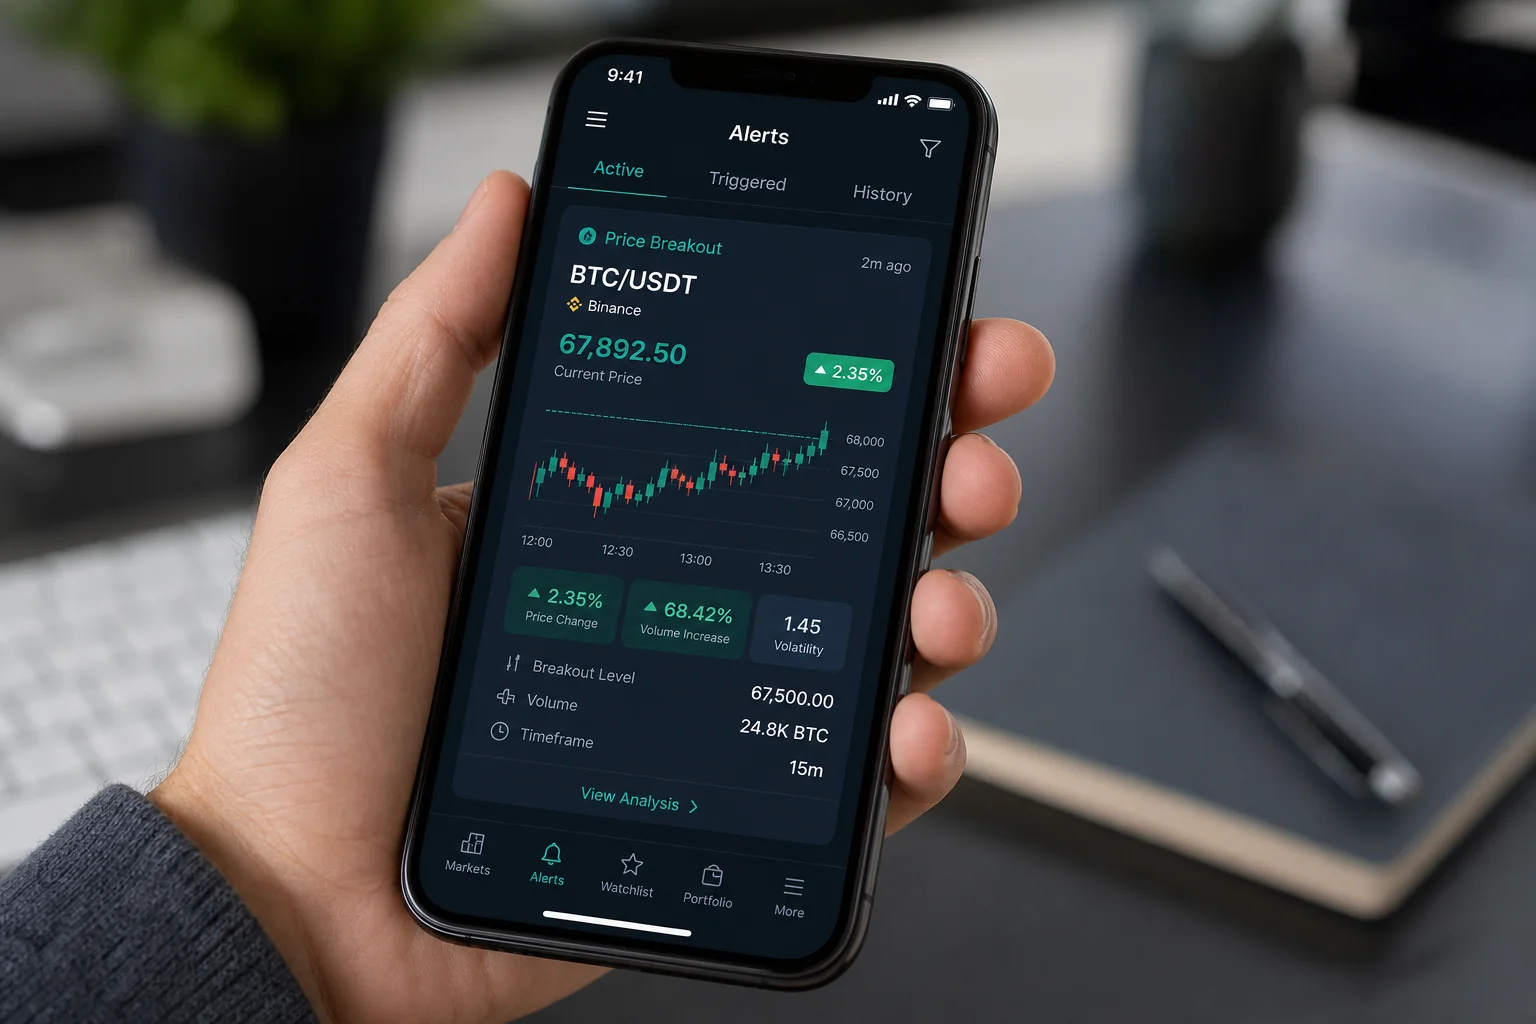
What Explainable, Backtested Alerts Actually Look Like
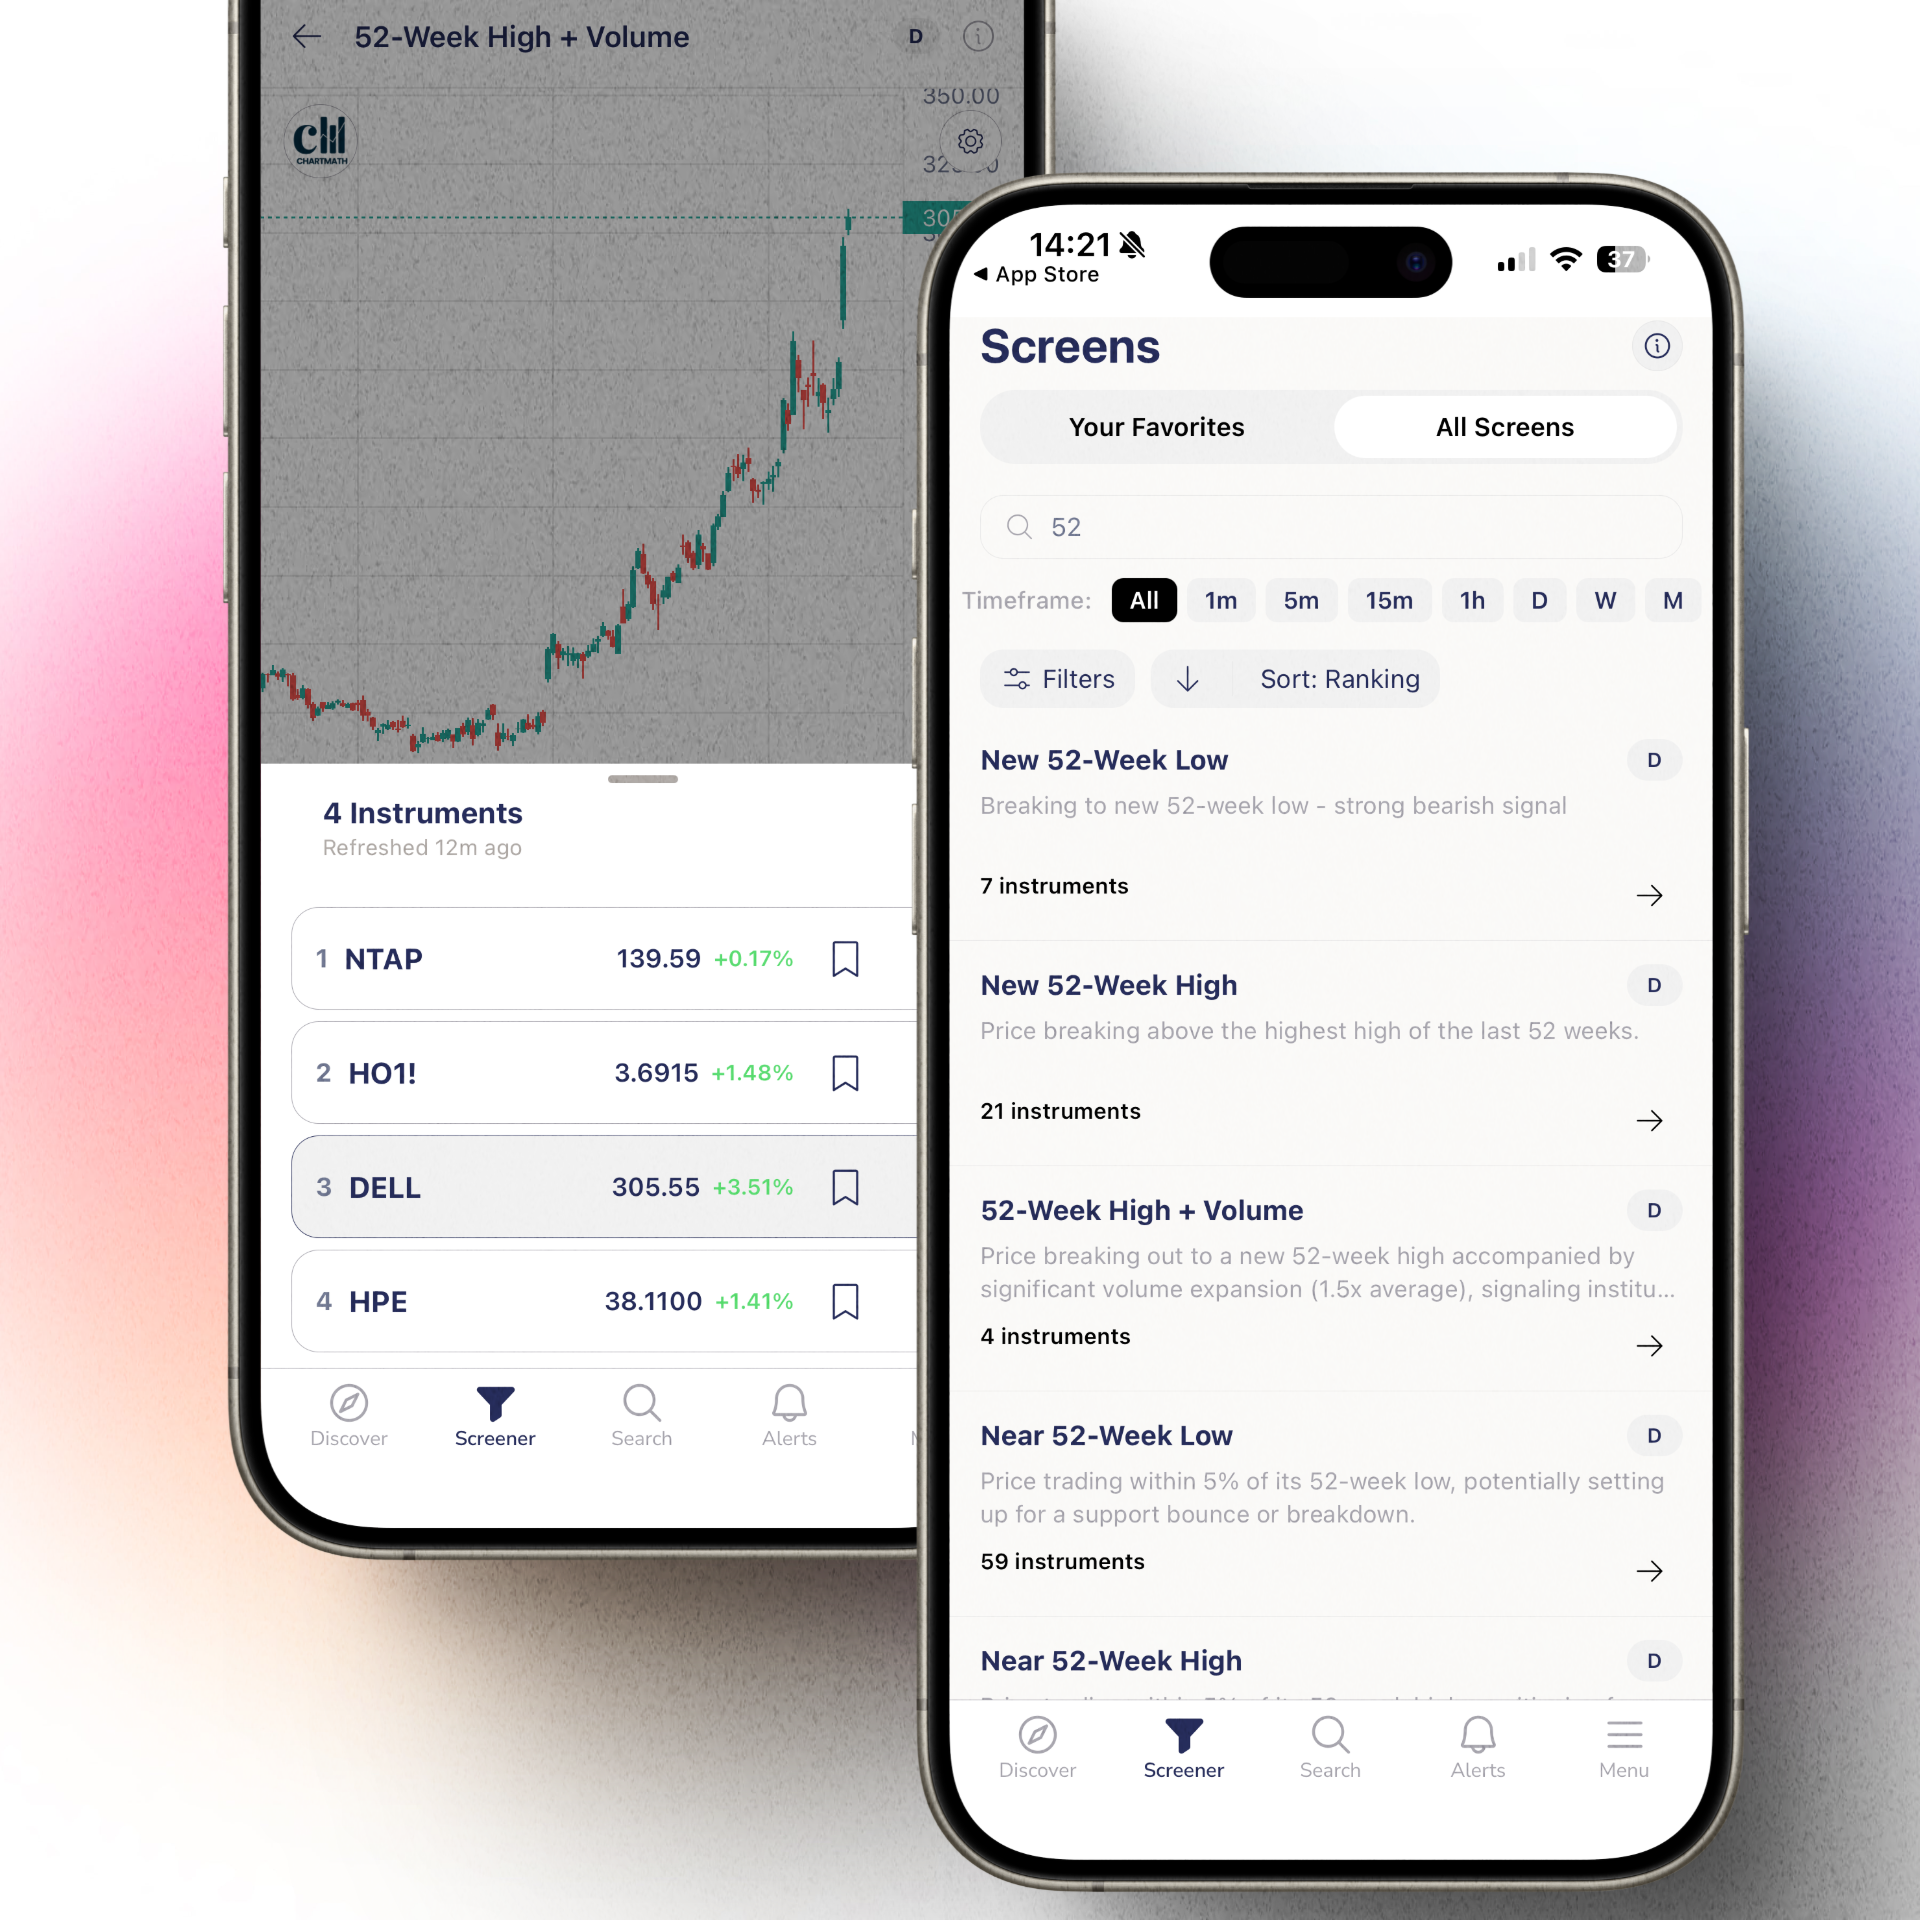
ChartMath's alerts aren't just "stock X crossed above its 20-day moving average." Each alert tells you:
- Which specific screen triggered, the exact technical pattern, not a vague description
- Why it triggered, the specific conditions that were met, in plain English
- Historical win rate for this screen, how often this setup has worked in the past on similar stocks
- Average return per trade, not just win rate, but the magnitude of wins and losses
- RVOL at trigger, volume confirmation built into the alert, not something you have to check separately
That's steps 1, 3, and part of step 2 from the validation framework above, delivered automatically in a single push notification to your phone while you're at work.
The Workflow for Swing Traders With Day Jobs
Here's how this plays out in practice for a trader who can't watch charts during market hours:
- During the day: ChartMath scans 200+ technical screens across the market in real time. When a setup triggers that matches your criteria, you get a push alert on your phone, even if you're in a meeting.
- After market close: You open the app and review the day's alerts using the swipe interface. Each card shows the setup, the chart, and the backtest stats. You swipe through in 5-10 minutes instead of manually scanning 40 tickers.
- Premarket next morning: You've already done your validation the night before. You know which setups you're watching and at what levels. You set your alerts and go to work.
The 30-minute daily guide for busy swing traders maps out exactly how to structure this workflow around a full-time job schedule.
For traders already using TradingView or TrendSpider for charting, ChartMath works as a discovery layer alongside those platforms, it finds the setups you'd never pull up on your own, then you do your deeper chart analysis in the tool you already know. The guide to integrating trading alerts with your charting platform covers how to connect the two workflows.
Putting It All Together: A Real Validation Checklist
Before entering any trade, run through these five checks. With practice, this takes under two minutes per setup.
- Win rate check: Does this specific setup have a documented historical win rate on similar stocks and timeframes? Is the sample size large enough to be meaningful (30+ instances)?
- Risk-reward check: Is the R:R at least 1:2 based on your stop placement and realistic target? Does the backtest data show positive expectancy (average winner larger than average loser)?
- Volume confirmation: Is RVOL at or above 1.5x for the setup type? Is the volume pattern consistent with what the backtest data shows for winning instances of this setup?
- Timeframe alignment: Do the daily, hourly, and 15-minute charts all point in the same direction? Is there any timeframe conflict that would put your stop at risk before the trade has a chance to develop?
- Market context: Is the broad market trending or choppy? Is the sector showing relative strength? Are there any upcoming catalysts that could override the technical setup?
When to Pass on a Setup
A setup that fails two or more of these checks is a pass, regardless of how clean the chart looks. This is the hardest discipline in trading, not finding setups, but having the patience to skip the ones that don't fully qualify. The traders who build consistent results over time aren't the ones who take every setup that looks interesting. They're the ones who only take setups that pass their full validation process.
If a setup passes four of five checks but fails on market context (choppy broad market, weak sector), consider reducing position size rather than skipping entirely. The setup still has edge, it's just operating in a less favorable environment.
The goal isn't to find more trades. It's to find fewer, better trades, the ones where the evidence is stacked in your favor before you risk a dollar.
How ChartMath Builds This Checklist Into Every Alert
The validation framework above is exactly what ChartMath's 200+ pre-built screens are designed to surface. Each screen is a specific technical setup with defined entry criteria, and each alert comes with the backtest data that tells you whether the setup has a real historical edge, not just on the market in general, but on the specific type of stock that triggered it.
You can explore how this works in practice by looking at the strategy analytics for the Strong Intraday Downtrend 15m screen on AAPL. The page shows you the historical instances of this pattern, sorted by best performance, with the full backtest stats, win rate, average return, drawdown, so you can evaluate the setup's edge before you ever look at a live chart.
That's the difference between trading with evidence and trading with hope.
6. Paper Trade It Before You Risk Real Capital
The five checks validate the setup; paper trading validates you. A backtest demonstrates that the rule carries an edge, whereas a paper trade demonstrates whether you can execute it under live conditions: taking the entry when it fires, holding the stop, and sizing consistently from trade to trade. Paper trading a vague idea teaches you very little, so the discipline is to trade the exact validated setup, using the same entry, stop, and target you backtested. Readiness should be judged by resolved trade count and process quality, meaning stops honored and sizing kept steady, rather than by a green simulated P&L or by however many calendar weeks have passed. When you're ready to move from theory to practice, you can paper trade backtested setups, using simulated money at live prices with the entry, stop, and target pre-filled, position size drawn from your account risk, and batch statistics that include whether stops were actually held.
If you're spending more than 30 minutes per night manually scanning charts and still missing setups during the day, it's worth seeing what a scanner built around this validation framework actually looks like in practice. Watch the ChartMath demo to see how backtested alerts work in real time, or download the app and run the validation framework on tonight's setups, without spending your whole evening doing it manually.
Your edge isn't in finding more setups. It's in validating the right ones faster than everyone else, and then having the discipline to prove to yourself, through paper trading, that you can actually execute them.

See these setups live in ChartMath
200+ curated screens with backtest data. Free. No credit card required.