Paper Trading vs Backtesting: Do Both
You have a rule that's worked 68% of the time over 200 historical instances. Great. Now open a live chart at 9:31 AM with real prices moving and try to take that exact trade in real time. It's a different exercise entirely, and most traders never notice the gap until they've already blown through a stop they swore they'd honor.
That gap is why paper trading vs backtesting keeps coming up as a debate, when it shouldn't be a debate at all. Backtesting proves a setup has an edge. Paper trading proves you can execute that edge when real prices are moving and your finger is on the trigger. They're not competing tools. They're sequential checkpoints, and skipping either one is how traders end up risking capital on rules they never actually tested, or on execution they never actually practiced.
This post breaks down what each method catches, what each one is blind to, and the order that keeps you from confusing "the setup works" with "I can trade it."
What Backtesting Actually Proves (And What It Can't)
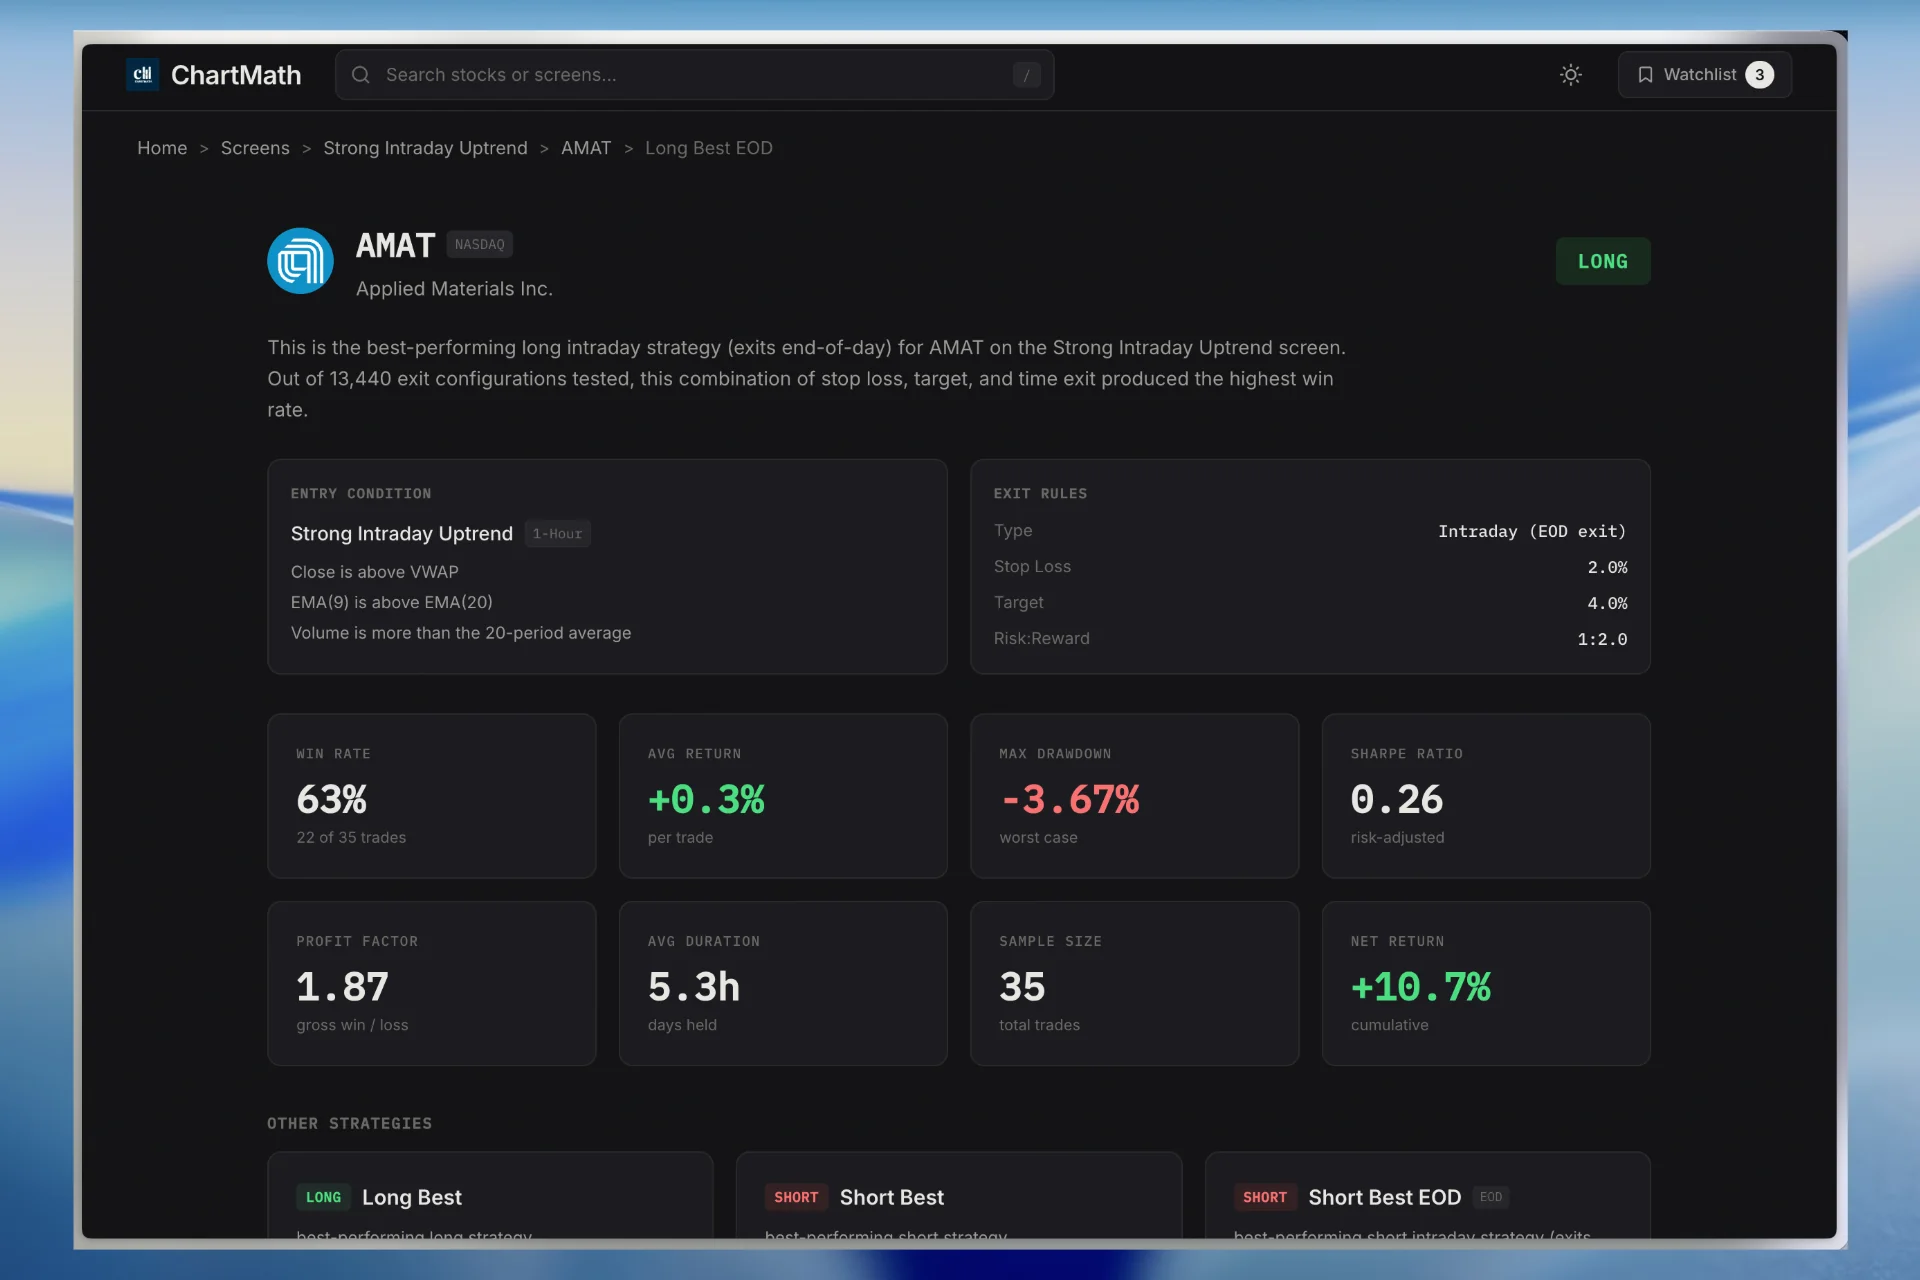
A backtest takes a fixed, deterministic rule and runs it against historical price data. No discretion, no "I felt like it was a good entry." Just: if condition X happens, buy; if condition Y happens, sell. Run that rule across months or years of data and you get a win rate, an average return, and a sample size large enough to mean something.
That's the entire job of a backtest: does this specific, repeatable rule have an edge across different market conditions? A trending market, a choppy range, a high-volatility stretch, an earnings season. Good backtests span all of it, because a rule that only works in one regime isn't a rule, it's a coincidence with a chart attached.
The output should be recomputable. If you can't rerun the same rule and get the same win rate, it isn't a real backtest, it's a story someone told you after the fact. Anyone reviewing the setup should be able to check the entry logic, the exit logic, and the sample size, and arrive at the same numbers you did. That's what separates a systematic setup from a hunch dressed up in chart screenshots.
Here's what a backtest cannot tell you, though: whether you, specifically, will take the trade when it fires. A backtest doesn't hesitate. It doesn't check Twitter first. It doesn't second-guess the stop because the stock "feels like it wants to bounce." It executes the rule instantly and perfectly, every single time, because it's math, not a person with a day job and a meeting in ten minutes. That's exactly where paper trading picks up the slack. For a deeper walkthrough of building rules that hold up across samples, see our guide on how to build winning backtesting strategies.
What Paper Trading Actually Proves (And What It Can't)
Paper trading takes that same rule and forces you to make real-time decisions against live prices, without risking actual money. The setup fires. You have to decide, right now, whether to take it, at what size, and whether you'll actually hold the stop when price starts moving against you three minutes later.
This is where a different kind of slippage shows up, the human kind. Not the few cents lost to a wide spread, but the seconds lost to hesitation. The entry you skipped because you got pulled into a call. The stop you moved because "it'll probably come back." The winner you closed at half the target because you got nervous watching it give back gains. None of that shows up in a backtest. All of it shows up in paper trading, because paper trading puts you, the actual decision-maker, back in the loop.
Here's the part traders get wrong constantly: paper trading only proves something if you're testing a fixed rule, not a vibe. If you paper trade "stocks that look strong to me" for two weeks, you haven't learned anything about your execution, because there's no rule to hold yourself to. You just generated 15 random outcomes and called it data. Paper trading a vague idea with no fixed entry, stop, and target is one of the most common ways traders waste weeks of practice and walk away with nothing usable.
Paper trading also cannot answer the question a backtest answers: does this setup have an edge at all? If you paper trade 12 trades and land 8 winners, that tells you almost nothing about the underlying edge. Twelve trades isn't a sample size, it's a coin-flip streak. That's a job for the backtest, which can chew through hundreds of historical instances in the time it takes you to make coffee. For more on separating a real edge from a lucky streak, our piece on how to validate a swing trade setup before you risk capital covers the sample-size trap in detail.
Paper Trading vs Backtesting: Side-by-Side Comparison
Laid out next to each other, the two methods stop looking like competitors and start looking like two different instruments measuring two different things.
| Attribute | Backtesting | Paper Trading |
|---|---|---|
| Question it answers | Does this rule have an edge? | Can I execute this rule in real time? |
| Data used | Historical price data, replayed | Live market prices, in real time |
| Speed to sample size | Hundreds of instances in minutes | One trade at a time, as setups form |
| What it measures | Win rate, average return, expectancy across market conditions | Entry discipline, stop discipline, exit timing under uncertainty |
| Main blind spot | Cannot test human hesitation or emotional overrides | Cannot prove the rule has an edge from a handful of trades |
| Common failure mode | Curve-fitting a rule to past data that won't repeat | Testing a vague idea instead of a fixed rule |
| Where it fits in the sequence | Step 1: prove the setup | Step 2: prove your execution |
Notice the pattern: every strength on one side is a blind spot on the other. That's not a coincidence, it's the whole reason you need both.
The Right Order: Backtest First, Paper Trade Second, Go Live Third
Order matters here more than most traders assume. Do these steps in sequence, and each one filters out a specific kind of failure before it costs you money.
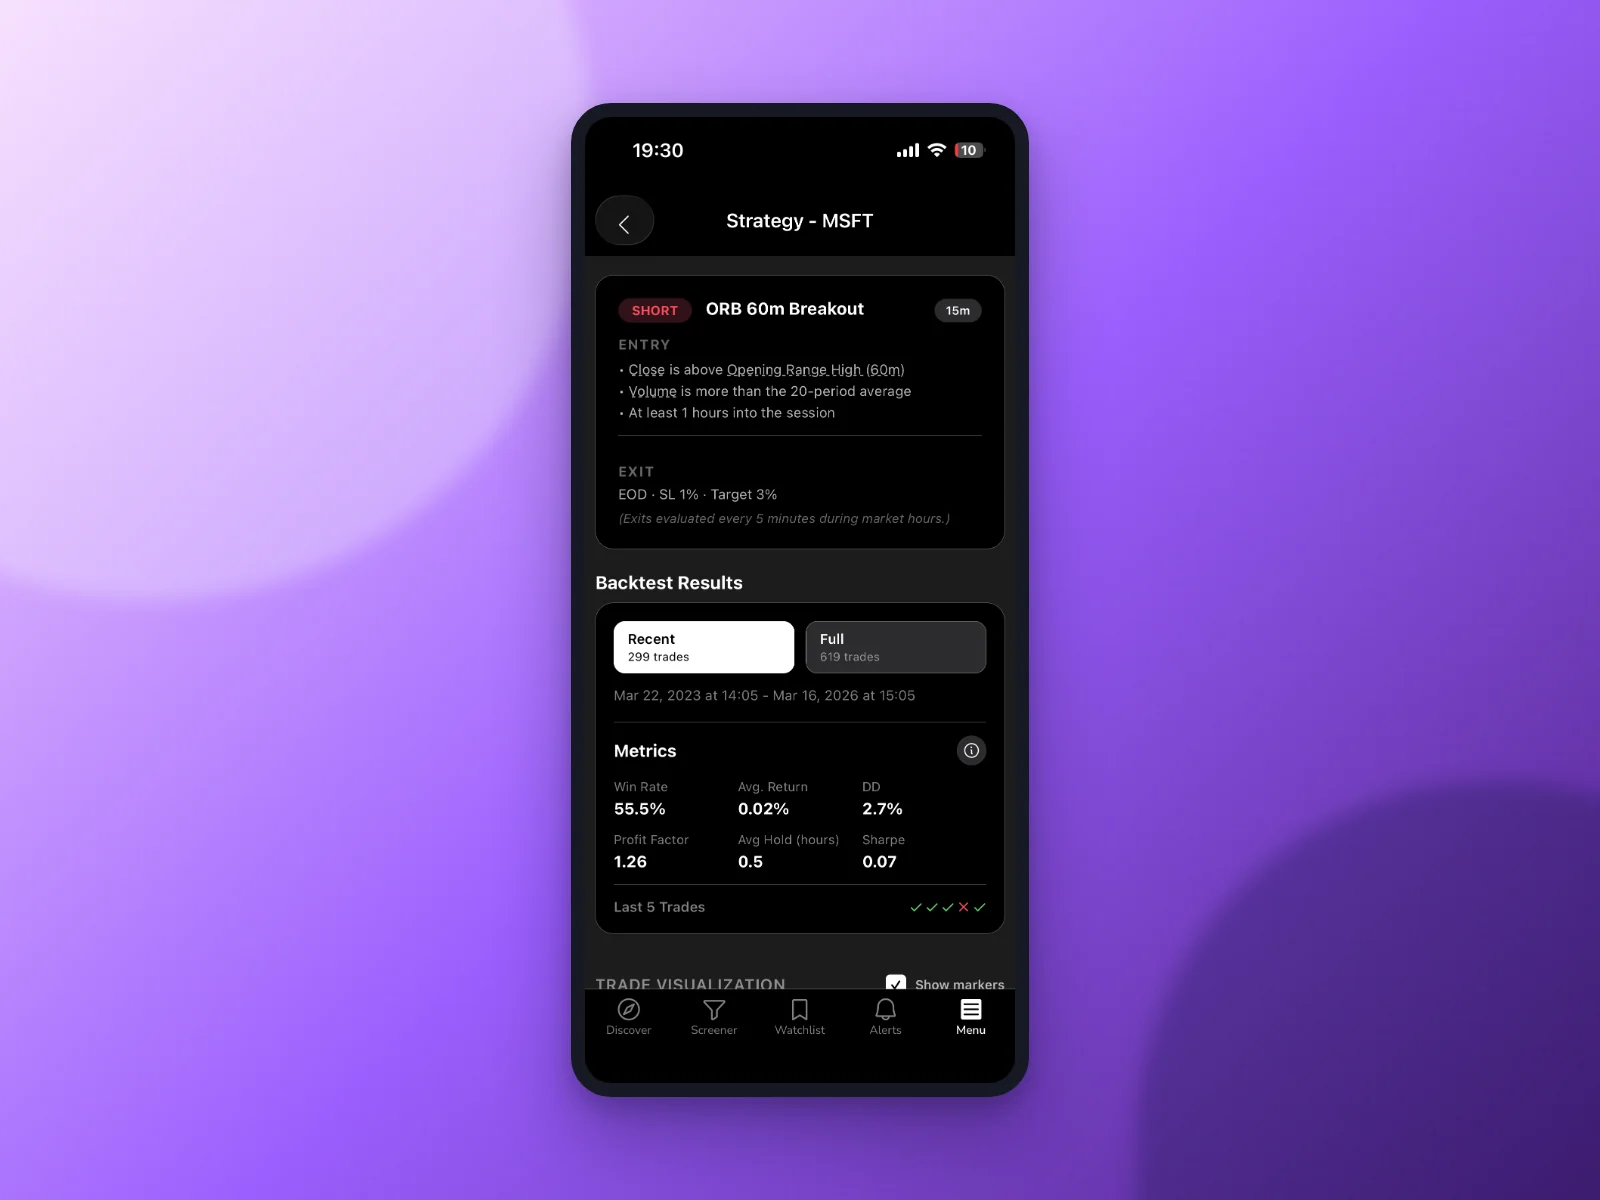
- Backtest the rule. Confirm it has a historical win rate and average return across different market conditions, not just the last three weeks. If the rule can't clear this bar, stop here. There's nothing to practice executing.
- Paper trade the same exact rule. Same entry trigger, same stop, same target, every single time. No discretionary tweaks mid-sample. This is where you find out if you can actually follow the rule when a real chart is moving in front of you.
- Go live, small, with sizing rules. Once your paper trading results show you can hold the rule with fidelity, take it live with a defined account risk per trade, typically 1-2%. Size up only after live results confirm the paper results weren't a fluke.
Skip step one and you're paper trading an idea nobody's proven has an edge, so a string of paper losses tells you nothing about whether the rule is broken or whether you're just executing it poorly. Skip step two and you're risking real capital on execution you've never practiced, which means your first live losses are teaching you lessons that should have been free. Our guide on building an efficient trading workflow walks through how to structure this pipeline end to end.
How to Paper Trade a Rule Properly (Not a Vibe)
Most paper trading fails for one reason: there's no rule being tested, just a feeling. Fix that and paper trading becomes genuinely useful. Here's how to do it right.
- Write the rule down before you start. Exact entry trigger, exact stop level, exact target, exact timeframe. If you can't write it in one sentence, it's not a rule yet.
- Use the same rule every time. No adjusting the entry because "this one looks different." The whole point of the sample is consistency. Change the rule mid-stream and you've got two half-samples instead of one real one.
- Track R-multiples, not just wins and losses. A win that hits half your target isn't the same as a win that hits full target. R-multiples (return relative to initial risk) let you compare trades of different sizes and durations on the same scale.
- Log whether you actually held the stop. This is the number that matters most. If you moved your stop three times out of ten trades, that's not a rule problem, that's an execution problem, and it's exactly what paper trading is supposed to surface.
- Review weekly, not after every single trade. Small samples lie. One bad trade doesn't invalidate a rule, and one good trade doesn't confirm you're ready to go live. Our weekly trading review framework gives you a repeatable structure for this.
Done this way, paper trading stops being a toy version of trading and starts being an actual diagnostic. You'll know, specifically, whether your problem is the setup or the way you execute it.
What Each Method Catches That the Other Misses
It helps to say this plainly, because the two methods really are testing different failure modes.
Backtesting catches: whether the rule has any edge at all, and how that edge holds up across years of data and different market regimes, all computed in minutes instead of months of live trading. It catches curve-fit rules that only worked on the exact data they were built from. It catches setups with a great win rate but a terrible average return, or vice versa.
Paper trading catches: the hesitation at the exact moment the entry trigger fires. The premature exit when a trade goes green and you take profit early "just in case." The skipped stop because the position "will probably come back." The trades you simply never took because you were in a meeting and didn't check your phone, which is itself useful information about whether this timeframe fits your schedule at all.
Neither catches: real-money psychology under actual capital at risk. Paper trading removes the sting of a real loss, so some traders execute flawlessly on paper and fall apart the moment their own cash is on the line. That's exactly why step three, small live size, exists. It's the final filter, and it's supposed to be small precisely because you're still learning something new at that stage.
Bring both together and you get something neither method delivers alone: a rule with a proven historical edge, paired with a trader who has demonstrated, on the record, that they can execute it with discipline.
Related reading on the discipline side of this: how to read a trading signal before you risk money covers the five checks worth running between an alert firing and an order going in.
How ChartMath Fits Into This Workflow
Most of the friction in this process comes from doing steps one and two with different, disconnected tools. You backtest a rule in one platform, then manually recreate it in a separate paper trading simulator, and by the time you're done, you're not even sure it's the same rule anymore.
ChartMath is built around this exact sequence. Every one of its 200+ screens is a fixed, deterministic rule that's already been backtested across a curated universe of 500+ US equities, so the "does this setup have an edge" question is already answered before you ever look at it. Each screen carries a Win Rate and Avg. Return you can inspect, not a vague promise.
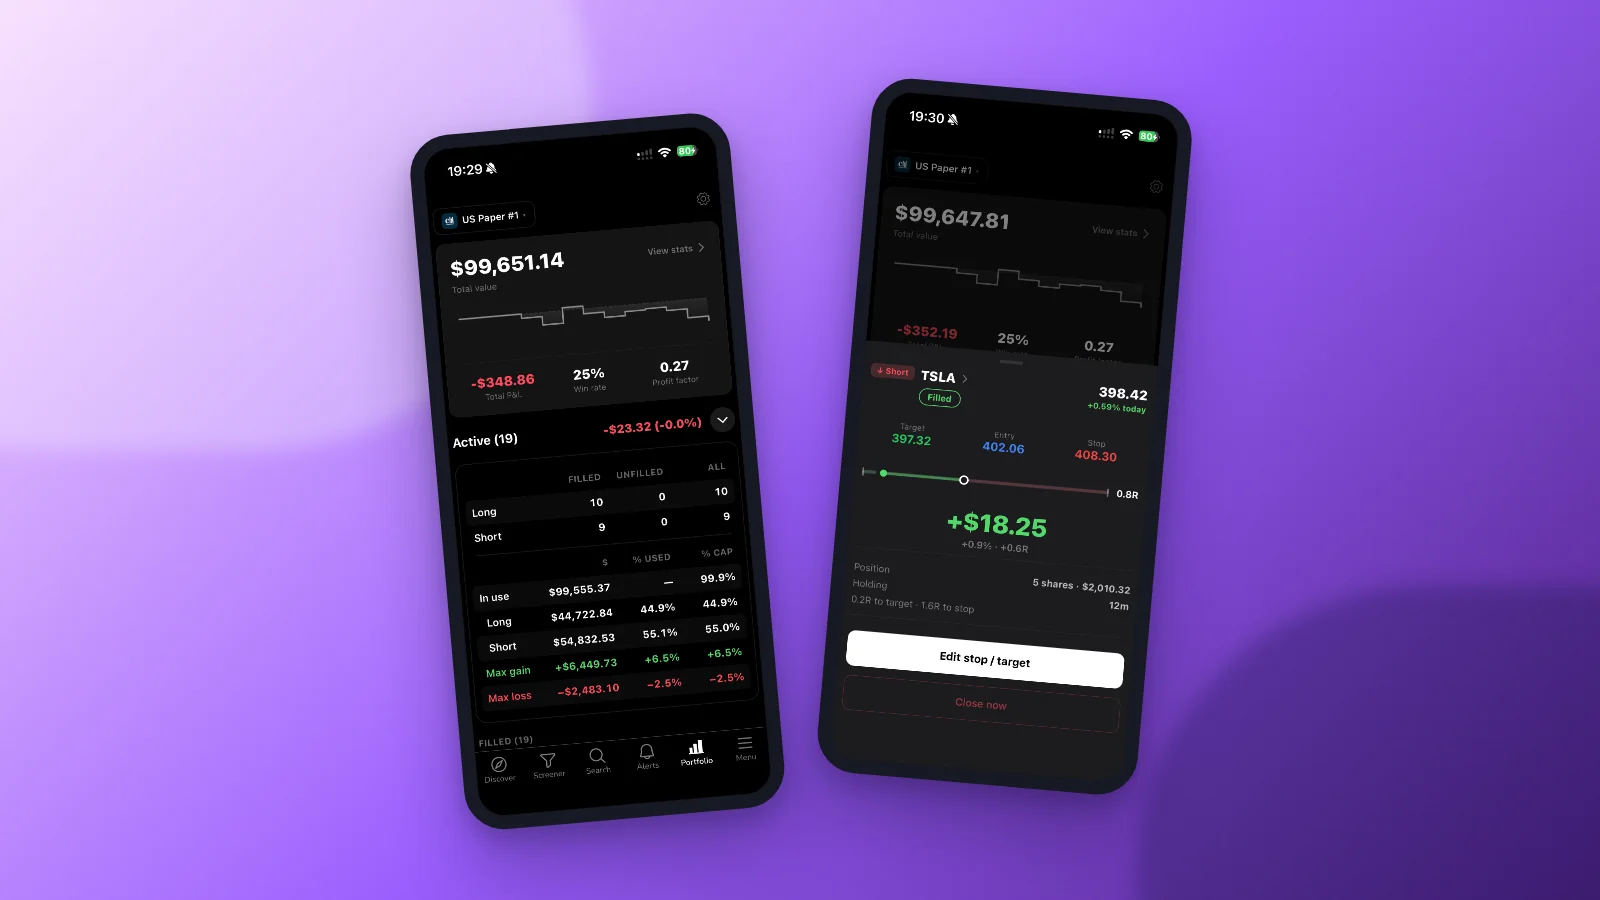
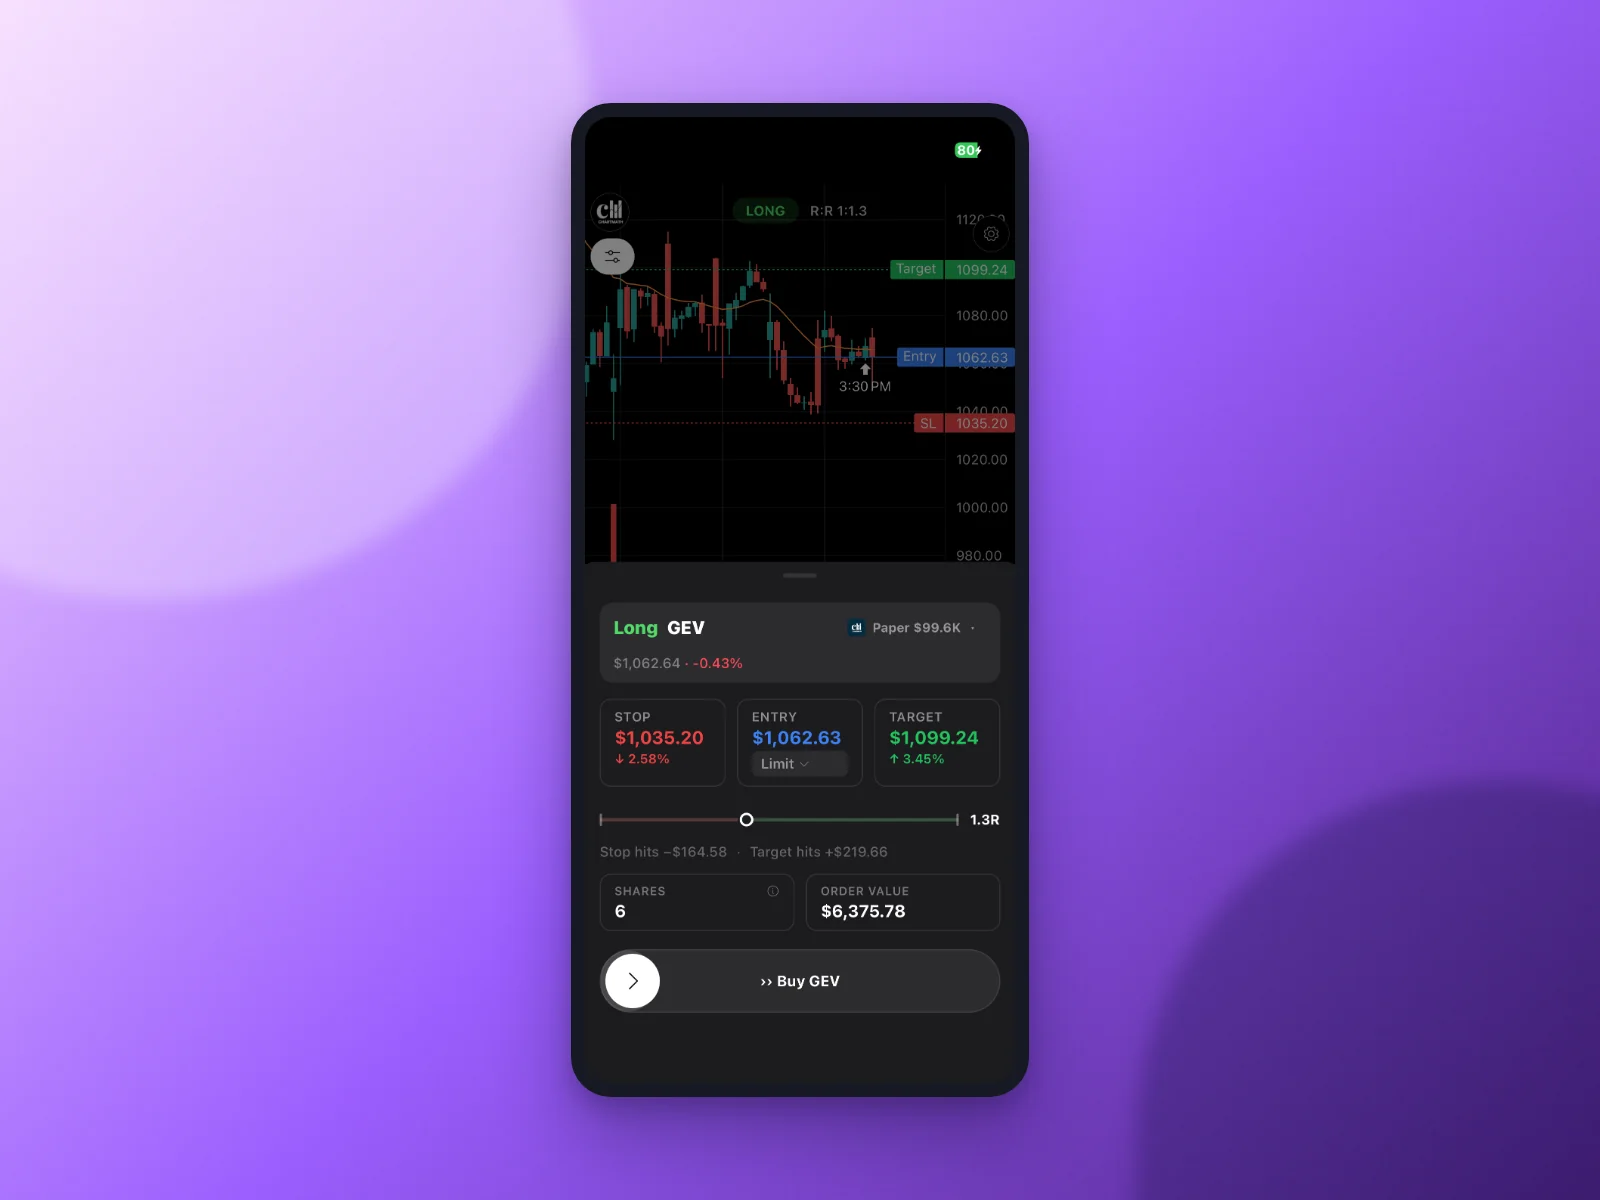
From there, ChartMath's paper trading lets you take that same backtested rule and simulate it at live market prices, with entry, stop, and target pre-filled from the screen's own logic, so you're testing the exact rule that was backtested, not a rough approximation of it. Position size is computed automatically from the account risk you choose, which means you're practicing sizing discipline from the very first simulated trade, not bolting it on later.
After a run of simulated trades, ChartMath rolls up batch stats: win rate, expectancy, and, importantly, whether you actually held your stops. That last number is the one most paper trading tools never show you, and it's usually the one that explains why a proven setup isn't translating into results. It's copilot, not autopilot: ChartMath surfaces the backtested setup and simulates the trade, but you're still the one deciding and, eventually, executing in your own brokerage account.
If you're scanning for setups to feed into this process, our stock scanner without Pine Script post walks through how the 200+ pre-built screens work, and the VWAP trading guide is a good example of a single rule you could run through backtest, then paper trade, then live.
You can browse the full library of backtested screens on the web-based screener, or see the whole discover-to-decide flow in action with a quick demo before you commit to a workflow.
Frequently Asked Questions
How long should you paper trade before going live?
There's no fixed number of days, but there is a fixed number of trades that matters more: you want enough simulated trades to see the rule play out across a few different price conditions, not just one lucky stretch. Watch for consistency in your execution (holding stops, taking the exact entry) rather than watching for a specific win rate. If you're still moving stops or skipping entries after a few weeks, you're not ready to size up yet, regardless of the calendar.
Can backtesting replace paper trading?
No. A backtest proves the rule works on paper, in the mathematical sense, but it assumes perfect, instant execution. Paper trading is the only way to find out whether you, personally, can follow that same rule when a live chart is moving and a decision has to happen in real time. Skipping paper trading means your first real test of execution happens with actual money on the line.
Does paper trading work if the rule isn't backtested?
Not really. If you paper trade an idea that hasn't been tested for an edge, a string of losses or wins tells you nothing, because you don't know if the underlying rule is even sound. You'd be practicing execution on a setup that might not have any edge to execute. Backtest first, then paper trade the same fixed rule.
How many paper trades count as a valid sample?
More than most traders think. A handful of trades can look great or terrible purely by chance. Aim to paper trade a rule across enough occurrences, and ideally across more than one type of market condition, before drawing conclusions about your own execution. Reviewing in batches, weekly, rather than trade by trade, helps avoid overreacting to any single outcome.
Put the Sequence to Work
Paper trading vs backtesting was never really a contest. A backtest tells you the setup has a pulse. Paper trading tells you whether you can keep that pulse steady when real prices are moving and the decision is yours to make. Run them in order, backtest first, paper trade second, small live size third, and you'll stop confusing a good rule with good execution, and stop blaming the setup for what was actually a discipline problem.
ChartMath is built to run that exact sequence without switching tools. Backtested screens across 500+ US equities, 100 crypto pairs, and 11 US futures give you a rule with a recomputable track record, one you can verify rather than take on faith. From there, you can paper trade backtested setups, which puts simulated money against live market prices with entry, stop, and target pre-filled and position size computed from your chosen account risk, giving you the execution evidence to match. Download the app and start building that evidence on a rule with data behind it, before any real capital is involved.

See these setups live in ChartMath
200+ curated screens with backtest data. Free. No credit card required.