Paper Trade by Sample Size, Not Calendar Days
Search "how long should you paper trade before going live" and you'll get the same three answers on every forum: 30 days. 90 days. Six months if you're being cautious. Somebody always chimes in with "just trade until you feel ready." None of these answers hold up, and here's why: calendar time has nothing to do with statistical validity.
A trader who paper trades a daily-chart swing setup for 30 days might close four trades. A trader running an intraday setup on 5-minute charts across a wide watchlist might close 40 trades in the same 30 days. Same calendar. Wildly different amounts of evidence. One of them has a coin-flip sample. The other has something you can actually learn from.
This post makes the case for a different unit entirely: resolved trade count plus rule adherence, not weeks on a calendar. If you're a swing trader with a day job trying to figure out when to stop simulating and start risking real money, this is the framework that actually answers the question.
The Wrong Question Everyone Asks on Reddit
Every trading subreddit has the same thread on repeat: "how long should I paper trade?" The top comment usually picks a round number. Thirty days feels responsible. Three months feels thorough. Six months feels bulletproof. None of these numbers reference how many trades you actually took, whether you followed your own rules, or whether your setup even produces enough signals to test in that window.
Here's the problem in plain terms. Time passing doesn't generate evidence. Trades resolving does. If your paper trading plan is "I'll go live after 60 days," you've picked a deadline that's completely disconnected from whether you have enough data to trust your own numbers. You could hit day 60 with 6 trades or 60 trades, and the calendar treats both outcomes identically.
The honest reframe is this: you're not paper trading to fill a calendar square. You're paper trading to build a sample large enough that your win rate and expectancy estimate stop bouncing around every time a new trade closes. That's a statistics problem, not a scheduling problem. And it comes with a second, equally important half: are you actually running your rules, or are you narrating a story about your rules after the fact?
Why Calendar Days Are the Wrong Unit of Measurement
Think about what a trade sample is actually for. You're trying to estimate two numbers: how often the setup wins, and how much you make when it wins versus how much you lose when it doesn't. Those two numbers combine into expectancy, the average result you can expect per trade over time. A single trade, or even four or five, tells you almost nothing about that number. Flip a coin four times and get three heads. That doesn't mean the coin is biased. It means four flips isn't enough to know anything.

The same logic applies to your paper trading log. Ten trades with 7 winners could easily be variance dressed up as skill. Thirty trades with a consistent pattern of wins and losses starts to say something. The exact number where an estimate "stabilizes" depends on the setup's own win rate and payoff structure, but the direction is clear: more resolved trades tightens your estimate, more elapsed weeks does not.
Now layer on the timeframe problem. A swing setup built around VWAP reclaims on daily charts might only trigger a handful of times a month across a small watchlist. An intraday opening-range setup on 5-minute charts can trigger multiple times a week per ticker. Thirty calendar days gives the swing trader a tiny handful of trades and gives the intraday trader dozens. If both traders use "30 days" as their readiness bar, one of them is making a decision with real evidence and the other is guessing.
This is exactly why the calendar-based advice on forums falls apart. It doesn't account for setup frequency, timeframe, or the size of the universe you're scanning. If you're only watching five stocks, you'll wait far longer for a meaningful sample than if you're scanning a bounded universe of 500+ US equities for the same setup pattern. The math changes completely, and no fixed number of weeks captures that.
1. Fix One Rule-Based Setup Before You Start the Clock
Before you log a single paper trade, you need a setup you can actually describe in one sentence, with a defined entry trigger, a defined stop, and a defined target. Not "I buy when it looks strong." Not "I sell when I get nervous." A rule you could hand to another trader and have them take the same trade you would.
This matters more than people admit. If your paper trading period is a loose mix of gut calls, breakout guesses, and the occasional indicator crossover, you're not building one sample. You're building five overlapping half-samples that never get large enough to mean anything individually. Every trade needs to belong to the same tested idea, or your trade count is an illusion.
Practical steps for locking in a setup before you start:
- Write the rule down first. Entry condition, stop placement, target or exit rule. Before the first paper trade, not after you've already taken a few and are rationalizing a pattern.
- Pick one setup, not three. You can test more later. Testing three at once during your first paper trading stretch just divides your sample size three ways.
- Use a setup that's already been backtested somewhere, even informally, so you're not paper trading a completely blind idea from scratch. Our guide on how to validate a swing trade setup before you risk capital walks through what that validation should look like before you ever open a position, paper or real.
- Define what "resolved" means in advance. Hit target, hit stop, or time-based exit. Decide the exit rule before entry, not while you're staring at an open position wondering what to do.
This is also where a pre-built, backtested screen earns its keep over a blank chart. Instead of eyeballing where a stop "feels right," a defined screen gives you the entry trigger and the stop and target levels already mapped out, so every paper trade you log is testing the same rule the same way. That consistency is what makes the sample worth anything at all.
2. Accumulate a Meaningful Batch of Resolved Trades, Not Weeks
Once your setup is locked, the only number worth watching is your resolved trade count. Not days elapsed. Not "it's been a month, I should probably go live soon." Trades closed, win or lose, following the exact rule you wrote down.
How many is "meaningful"? There's no magic single number that applies to every setup, because win rate and payoff ratio both affect how fast an estimate settles down. But the practical guidance traders and analysts generally use is this: a couple dozen resolved trades starts to give you a real read on whether the edge is there at all, and pushing toward several dozen tightens that read considerably. Four trades is a coin flip. Fifteen is a hint. Thirty-plus, following the same rule consistently, is a sample you can start trusting.
The fastest way to get there isn't to paper trade harder. It's to widen what you're watching. If you're staring at five tickers waiting for one setup to trigger, you'll be stuck at single digits for months. If you're scanning across a wider, bounded universe for the same setup pattern, you accumulate resolved trades far faster, because more instruments mean more occurrences of the same rule in the same stretch of time.
That's the practical difference between refreshing a handful of charts by hand and running a systematic scan across hundreds of names at once. Our post on how to trade stocks without watching the screen all day covers the mechanics of building that kind of watch coverage without needing to sit in front of six monitors.
A few practical notes on accumulating trades honestly:
- Only count trades where you actually followed the entry rule. A near-miss you talked yourself into isn't part of the sample.
- Log every trade, win or lose, immediately after it resolves. Delayed logging invites selective memory, and selective memory quietly inflates your win rate.
- Separate setups if you test more than one. A 90-trade log that mixes three different rules doesn't give you 90 trades of evidence on any single one of them.
3. Judge Readiness on Process Metrics, Not on Whether the Sim P&L Is Green
Here's where most paper trading plans quietly go off the rails. A trader hits a green month in the simulator and takes that as the signal to go live. But a green month over a small sample can be pure variance, no different from a lucky streak at a blackjack table. Readiness isn't about whether the number at the bottom of the page is positive. It's about whether you can prove you followed your own rules under the same conditions you'll face with real money.
The metrics that actually matter for a go/no-go decision:
- Percentage of stops honored. Out of every trade that hit your predefined stop level, how many did you actually exit at, versus moving the stop, adding to a loser, or just not clicking the button?
- Consistency of position sizing. Did you size every trade the same way relative to your account, or did size creep up after a couple of wins and shrink after a loss?
- Absence of revenge trades. After a stopped-out loss, did you wait for the next valid signal, or did you immediately jump into an off-plan trade to "get it back"?
- Rule-break count. Simple tally: how many of your resolved trades deviated from the written rule in any way, entry timing, stop distance, or exit discipline?
A trader who closes 30 trades with every stop honored and consistent sizing, even with a flat or slightly negative P&L, is in a far better position to go live than a trader who shows a green sim account built on three broken stops and a lucky bounce. The green number tells you what happened. The process metrics tell you whether it's likely to happen again on purpose.
A flat P&L with 100% of stops honored is a more useful signal than a green P&L with three broken stops. One tells you the process works. The other tells you variance was kind this month.
Build this tracking with a simple sheet: setup name, entry price, stop, target, outcome, and a single yes/no column for "rule broken." That last column is the one most traders never keep, and it's the one that actually predicts how you'll behave once real money is on the line. For a broader routine on turning this kind of log into a weekly habit, see our guide on how to run a weekly trading review in 20 minutes.
The Reddit Debate: 30 Days vs 90 Days vs 6 Months, Reframed
Every version of this debate assumes duration is the variable that matters. It isn't. What actually varies underneath each of those calendar answers is trade count and process evidence, and those can swing wildly depending on your setup and how widely you scan. Here's what those popular answers actually deliver in practice.
| Common Forum Answer | What It Assumes | Actual Trade Count (Narrow Watchlist) | Actual Trade Count (Wider Scan) | What It Actually Tells You |
|---|---|---|---|---|
| 30 days | A month is "enough time" to learn | 3 to 8 trades on a swing setup | 20 to 30+ trades scanning a wider universe | Almost nothing on a narrow watchlist; a starting read if you scanned wide |
| 90 days | A quarter feels thorough | 10 to 20 trades on a swing setup | 60 to 100+ trades scanning wide | A workable early sample on a narrow watchlist; a solid sample scanning wide |
| 6 months | Half a year proves discipline | 20 to 40 trades on a swing setup | Well past 150 trades scanning wide | Reasonable sample either way, but process discipline still has to be verified separately |
| "Until you feel ready" | Confidence signals competence | Unmeasured | Unmeasured | Nothing. Feelings are not a sample size, and confidence often peaks right before a losing streak |
The table makes the point visually: the same calendar answer can mean a barely-there sample or a genuinely solid one, depending entirely on how many instruments you're tracking and how often the setup fires. That's why "30 days" isn't wrong so much as incomplete. The missing half of the sentence is always "...and how many trades did that actually produce, and did you follow every rule along the way?"
4. Small Live Size Beats Endless Simulation Once Process Is Clean
Here's the part traders don't want to hear: paper trading cannot simulate the emotion of real capital sitting in a real position. You can paper trade a setup for a year and still flinch the first time a real stop-loss order actually fires and takes real money out of your account. That flinch is data too, and it only shows up once you're live.
Once you've hit a real sample, thirty-plus resolved trades on one clearly defined setup, and your process metrics check out (stops honored consistently, sizing steady, no revenge trades), continuing to paper trade past that point isn't caution. It's avoidance. The next step isn't more simulation. It's small live size.
Small size does two things at once. It exposes you to the real psychological pressure that paper trading can never fully replicate, the actual pull to move a stop or the actual urge to skip a signal because you're nervous. And it caps the real financial damage while you find out how you behave under that pressure. If your process holds up at small size the way it held up on paper, you scale gradually from there. If it doesn't, you've learned something paper trading couldn't have shown you, at a cost you could afford.
The traders who stay in paper trading for a year "just to be safe" are usually avoiding the one test that actually matters: does the discipline hold when the money is real? No amount of additional simulated weeks answers that question. Only small, real size does.
How ChartMath Helps You Track the Right Numbers
Everything in this framework depends on two things: a clearly defined setup with entry, stop, and target rules fixed in advance, and an honest log of resolved trades measured by count and process, not by calendar weeks. That's exactly the gap ChartMath's paper trading tools are built to close.
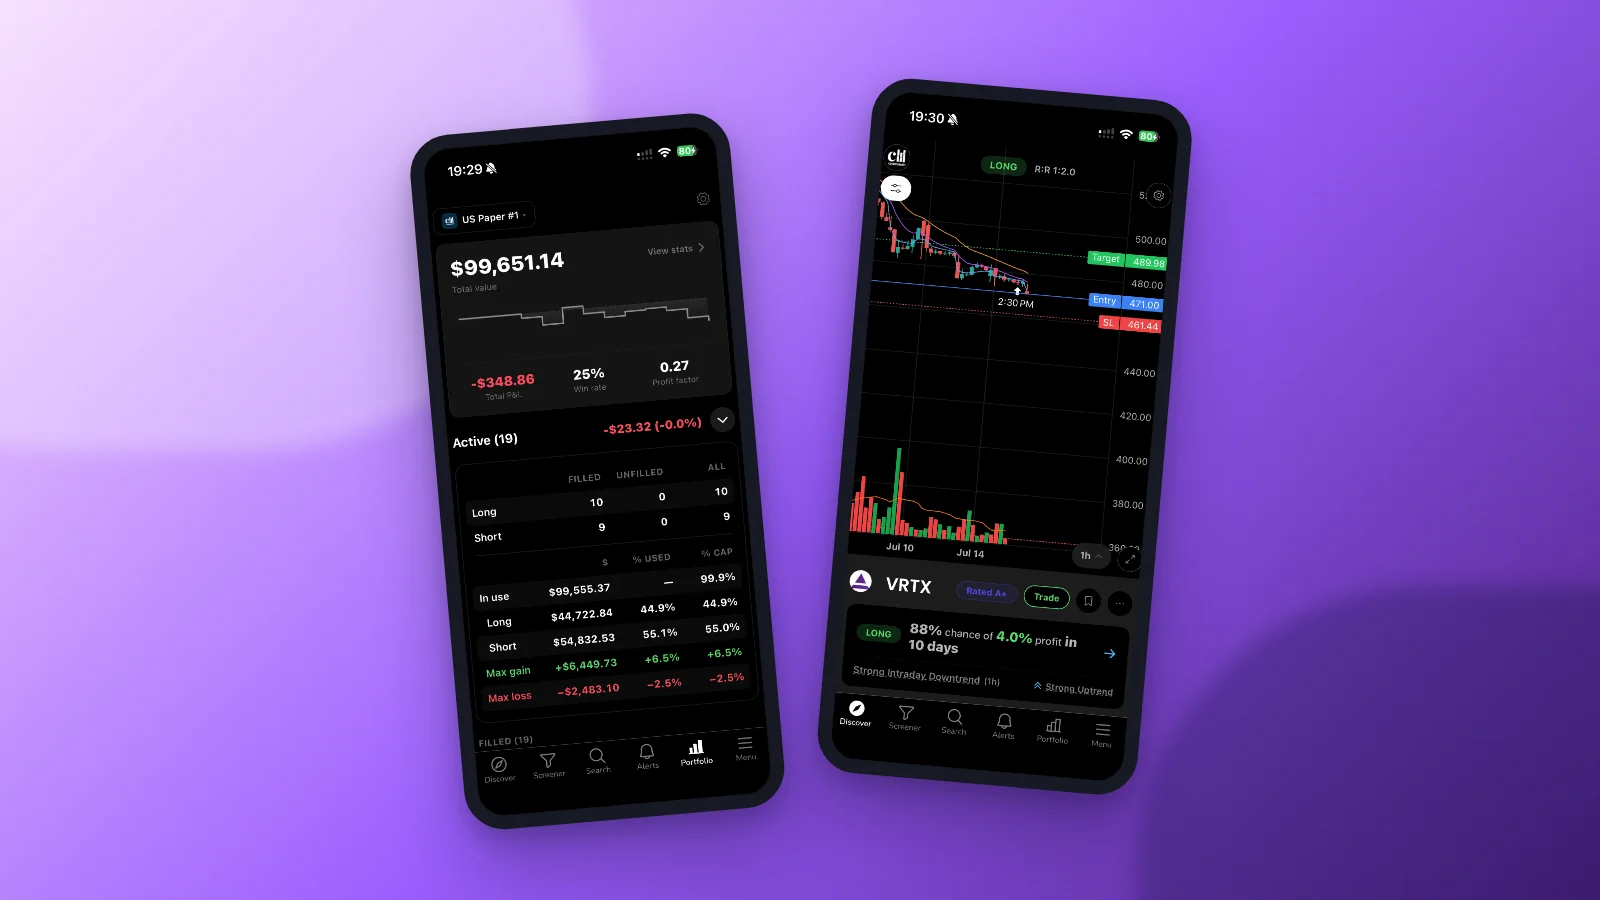
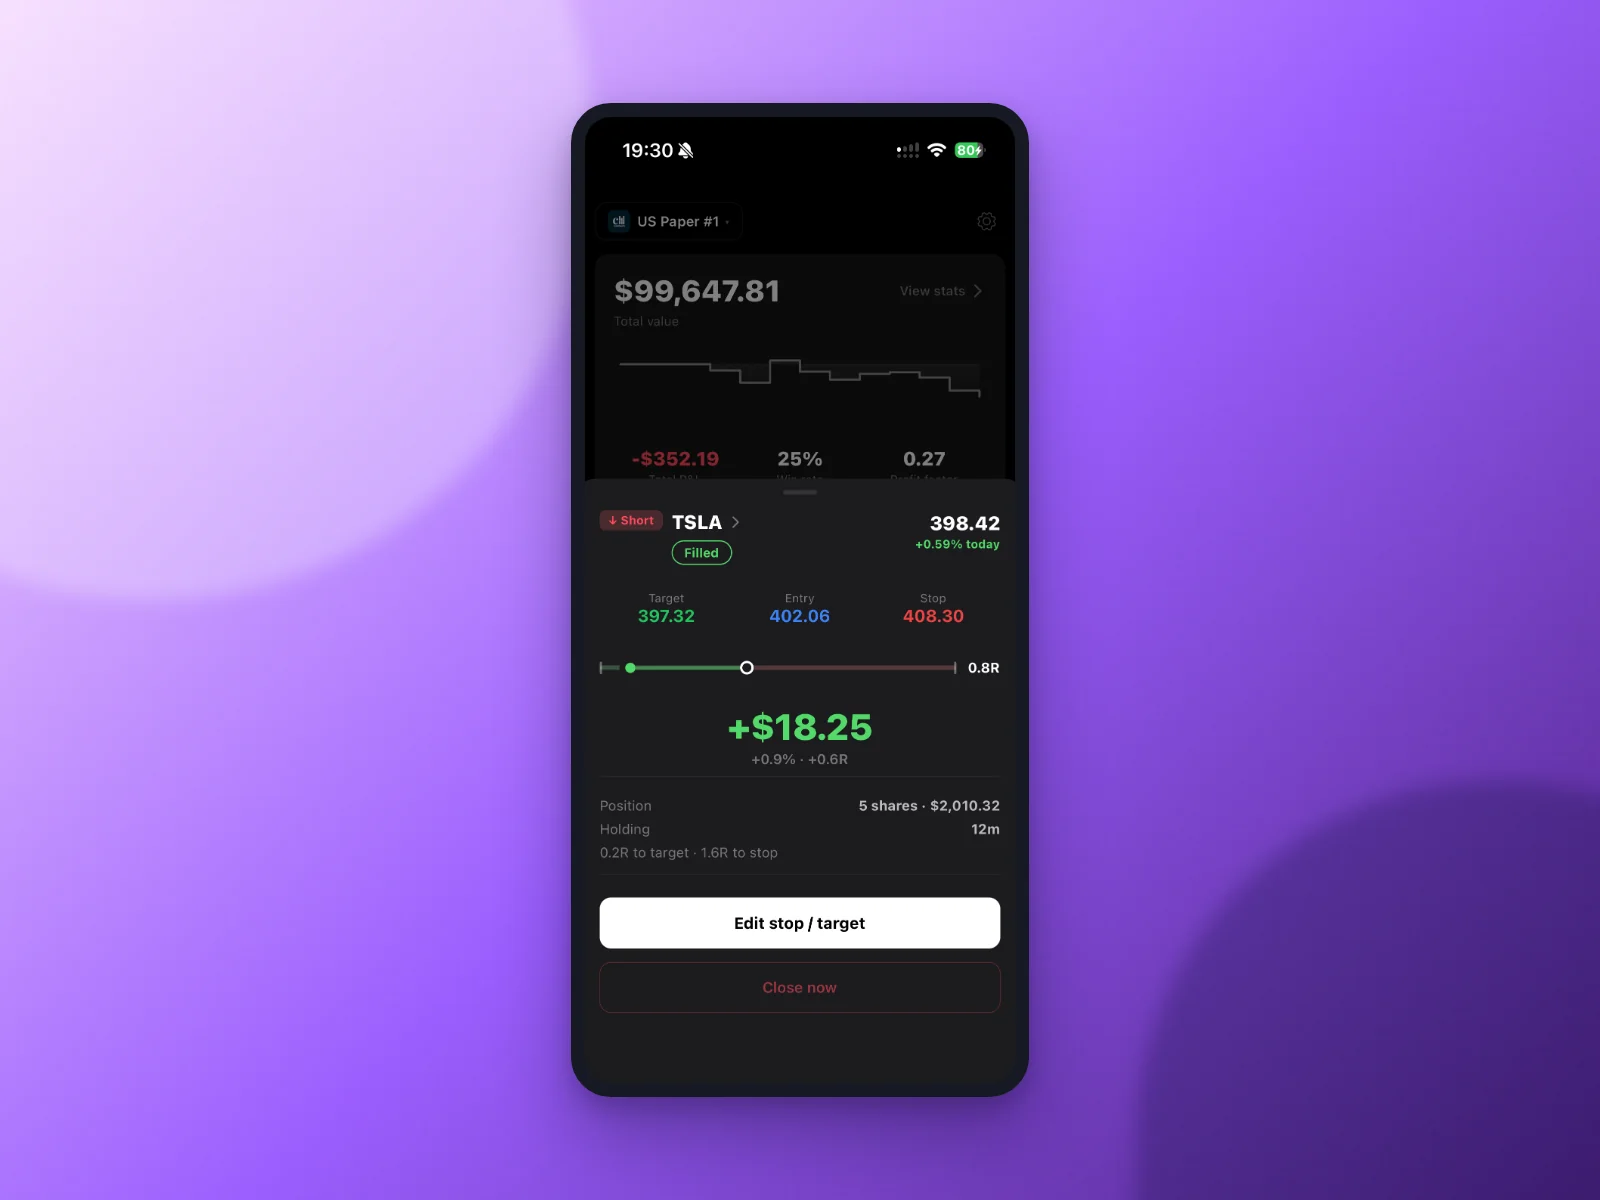
Instead of guessing where to place a stop or eyeballing a target on a chart, you paper trade backtested screens with entry, stop, and target levels already defined. That removes the single biggest source of noise in a self-built paper trading log: inconsistent rule application from one trade to the next. Every trade you log is testing the same defined setup, the same way, every time.
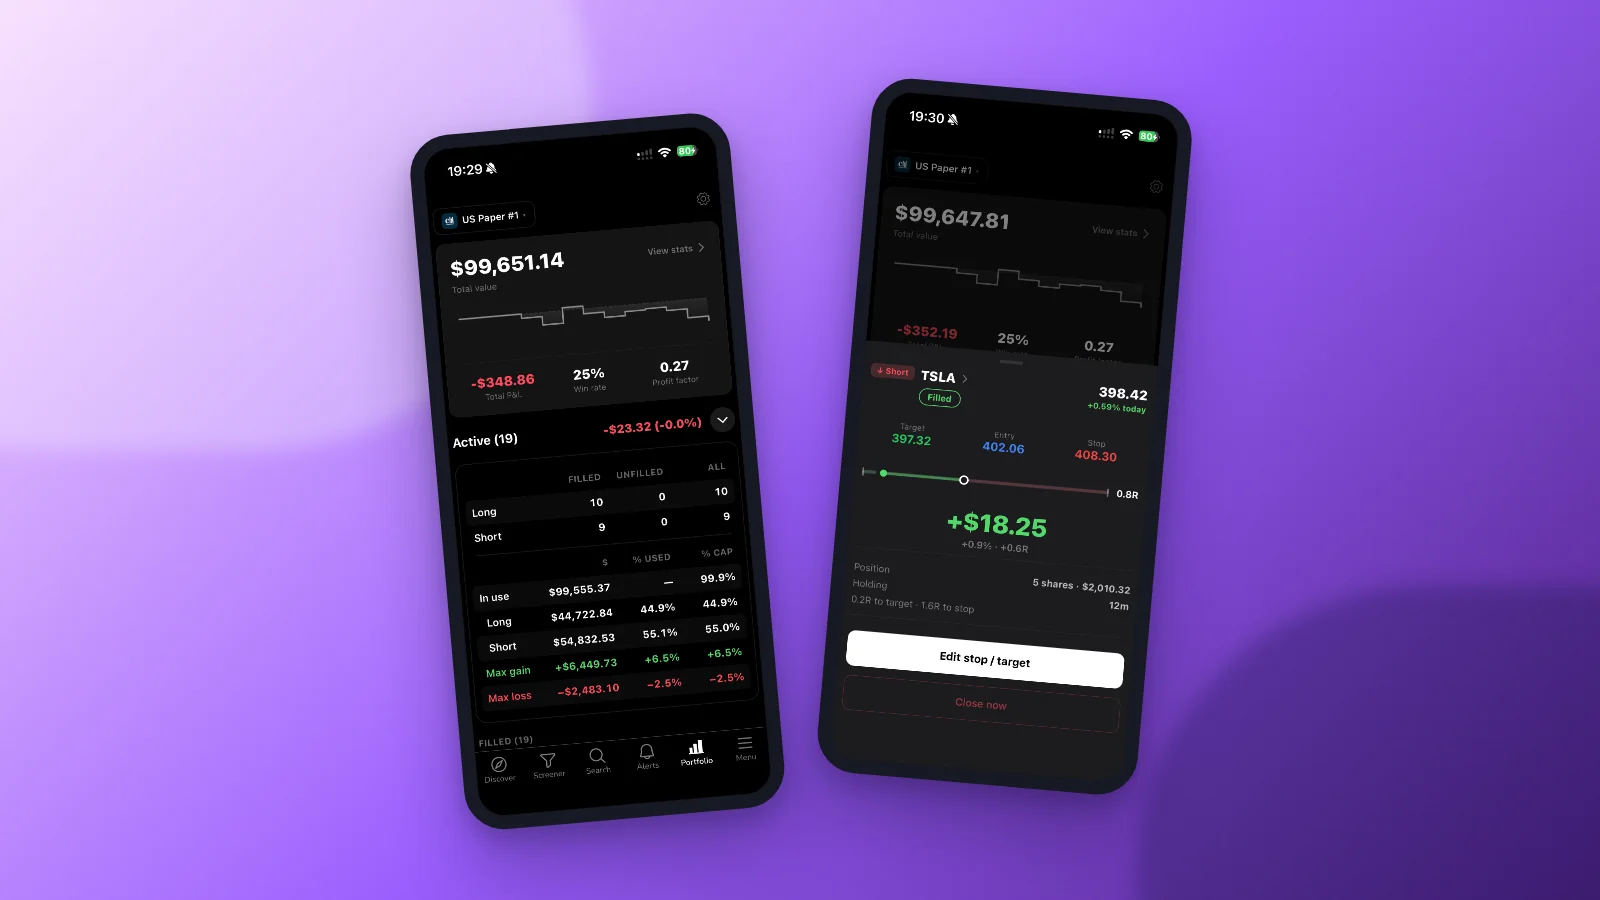
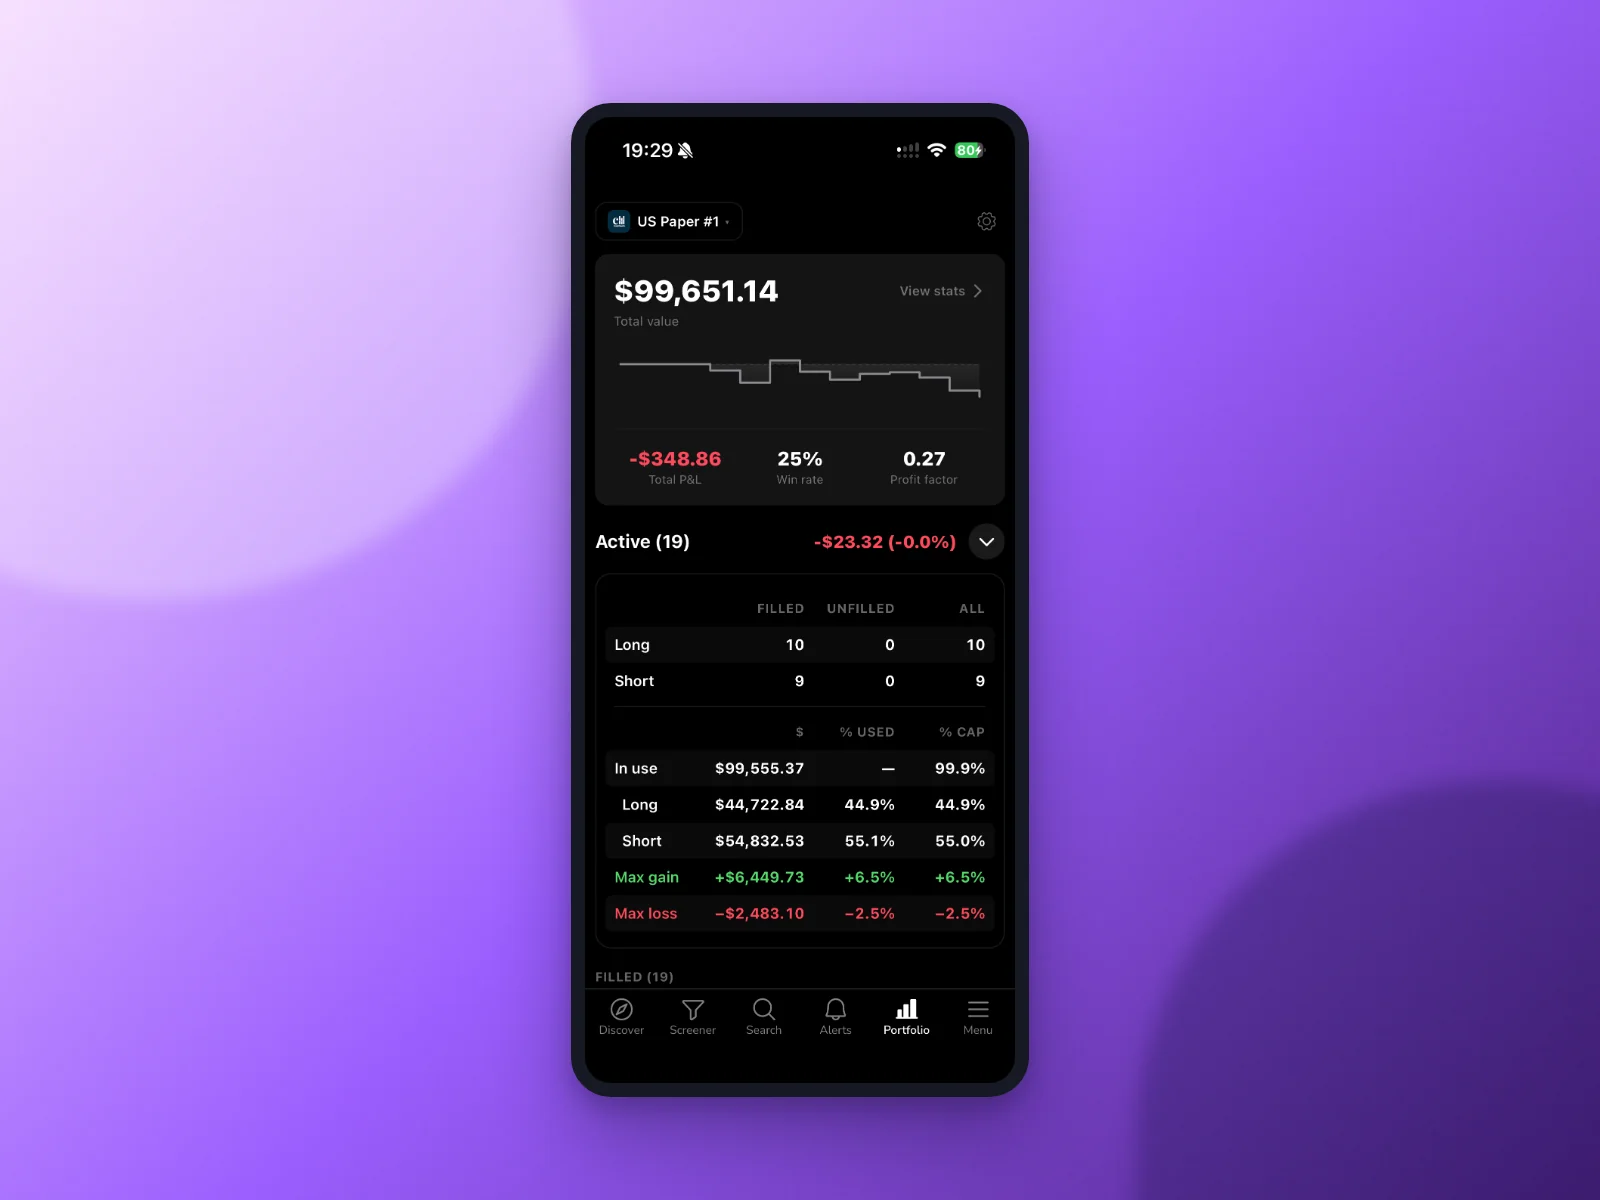
On top of that, ChartMath tracks the batch stats that actually answer the readiness question: win rate, expectancy, R-multiples, and a stops-held percentage across your own resolved trades. Instead of manually tallying a spreadsheet to figure out whether your sample has stabilized, you can see it directly. No more asking "has it been long enough?" You can look at your actual trade count and your actual process metrics and know.
This is copilot territory, not autopilot. ChartMath surfaces the setup with the reasoning behind it in plain English, you decide whether to take it, and you execute the trade yourself. It won't place trades for you, and it won't pretend a calendar date means anything your own trade log doesn't already show. For traders who want to see how a systematic setup gets validated before it's ever risked with real capital, our piece on building an efficient trading workflow in 2026 is a useful companion to this framework, as is our guide on reading a trading signal before you risk money.
If you want to see the mechanics of a backtested screen up close before you decide how to structure your own paper trading routine, you can watch a quick demo or browse the web-based screener to see how entry, stop, and target levels are defined ahead of time rather than guessed on the fly.
Frequently Asked Questions
How many paper trades should I take before going live?
There's no single universal number, because it depends on your setup's win rate and payoff structure. As a practical floor, aim for at least a couple dozen resolved trades on one clearly defined setup before drawing any conclusion, and push toward several dozen for a sample you can actually trust. Fewer than that, and you're reacting to variance, not evidence.
Is 30 days of paper trading enough to go live?
It depends entirely on how many trades those 30 days produced. If you're watching a handful of tickers for an infrequent swing setup, 30 days might only give you a handful of trades, not enough to judge anything. If you're scanning a wider universe for a setup that triggers often, 30 days could produce a real sample. Count the trades, not the days.
Can you paper trade for too long?
Yes. Once your sample size is solid and your process metrics (stops honored, consistent sizing, no revenge trades) check out, continuing to paper trade indefinitely just delays the one test paper trading can't run: how you handle real money on the line. At that point, small live size teaches you more than additional months of simulation.
Does this framework work the same for day trading and swing trading?
The principle is identical, but the timeline looks different. Intraday setups on 1-minute to 15-minute charts resolve faster and generate trade counts quicker, so a meaningful sample might arrive in weeks. Swing setups on daily or weekly charts resolve slower, so hitting the same trade count naturally takes longer in calendar terms. Either way, count trades and process, not weeks.
What should I track in a paper trading log?
At minimum: the setup name, entry price, stop level, target level, outcome, and whether you followed the rule exactly or deviated in any way. That last field is what actually predicts how you'll behave once real capital is involved.
The forum answers will keep giving you a calendar, because a calendar is easy to say and easy to hear. But your readiness to go live was never a date. It's a trade count paired with proof that you followed your own rules when it counted. Stop watching the clock and start watching your log. When you're ready to build that log around setups with entry, stop, and target already mapped out, download ChartMath and start paper trading with the batch stats that tell you exactly when your sample, and your discipline, are ready for real size.
When you're ready to build that log, you can paper trade backtested setups with entry, stop and target pre-filled, position size computed from your chosen account risk, and batch stats showing your resolved trade count, expectancy and whether your stops actually held.

See these setups live in ChartMath
200+ curated screens with backtest data. Free. No credit card required.