Stock Scanner Comparison: Find the Right Tool for Your Style
Pick the wrong stock scanner and you'll spend your trading session doing one of three things: manually refreshing a screener that updates once a day, drowning in alerts that tell you nothing useful, or staring at a platform so complex it takes 45 minutes just to set up a filter. None of those are trading. They're busywork dressed up as preparation.
This stock scanner comparison cuts through the noise. We evaluated five of the most widely used platforms — TradingView, Trade Ideas, Finviz, TrendSpider, and Tickeron — alongside ChartMath, a mobile-first trade discovery platform built specifically for technical traders. We scored each one on the criteria that actually affect your results: real-time data quality, alert usefulness, mobile access, backtesting transparency, and how much setup work you need to do before you can trade.
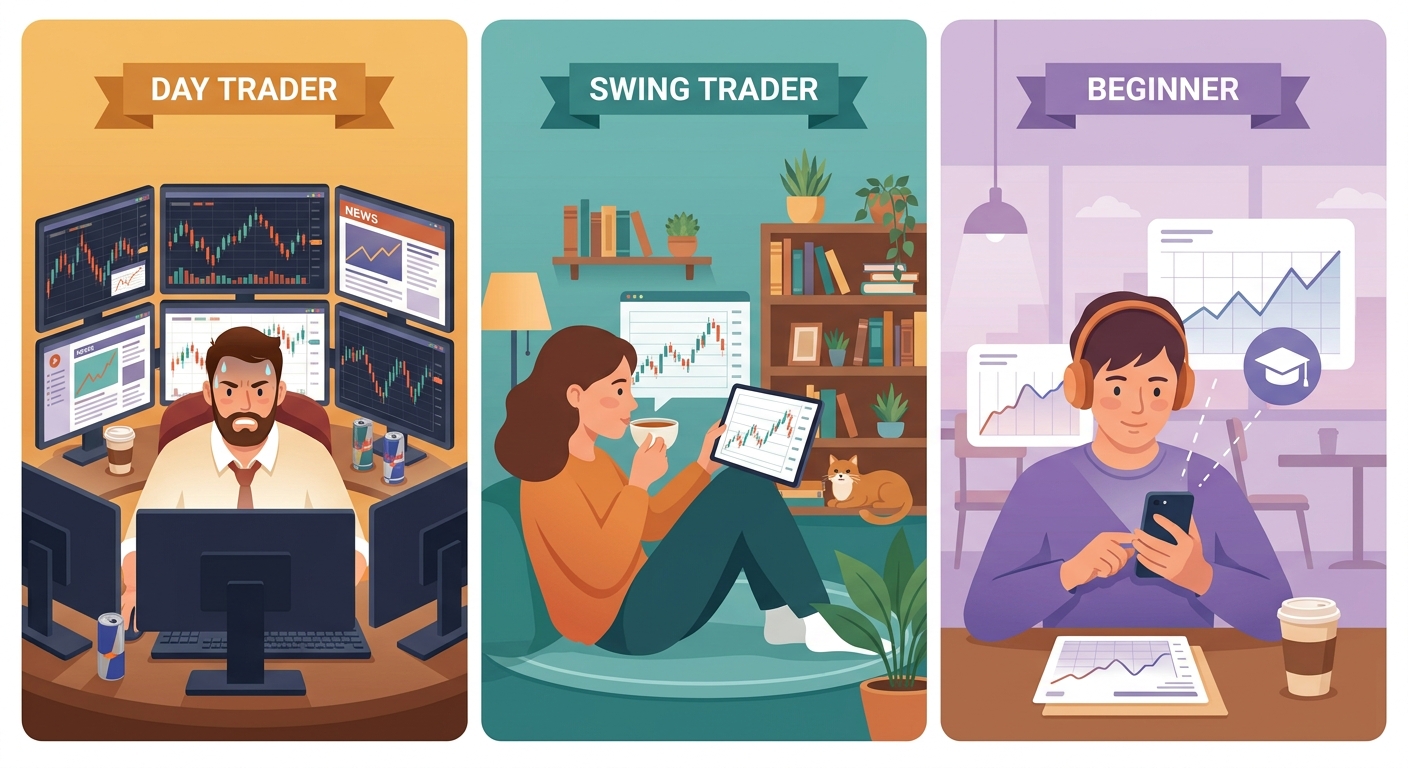
Whether you're a day trader chasing ORB breakouts at 9:35 AM, a swing trader reviewing setups after dinner, or a beginner trying to understand why a pattern works before risking real money, this guide will help you match the right tool to your actual workflow.
Why Your Stock Scanner Choice Defines Your Trading Results
Your scanner is the first link in the trade discovery chain. Before you analyze a chart, size a position, or set a stop loss, something has to surface the right stock at the right moment. If that first step is slow, noisy, or requires you to be glued to a desktop all day, everything downstream suffers.
The most common scanner mistakes traders make aren't about picking the "wrong" platform in some abstract sense. They're about mismatches: a day trader using an end-of-day screener, a beginner trying to write Pine Script alerts, or a swing trader paying for a real-time platform they check once a week. A good stock scanner comparison isn't just about features, it's about fit.
Here's what we're evaluating across every platform in this guide:
- Real-time capability: Does it scan intraday, or only update after the close?
- Alert quality: Do alerts include context, or just a ticker symbol?
- Mobile access: Can you get push notifications on your phone, or are you chained to a desktop?
- Backtesting transparency: Does the platform show you historical performance data for each setup?
- Ease of use: Can you get started without writing code?
Let's start with the criteria in more detail, then move into each platform.
The 5 Criteria That Matter Most in a Stock Scanner Comparison
Before comparing platforms side by side, it helps to understand why each criterion matters. Traders often focus on the wrong things, feature counts, interface aesthetics, or brand recognition, and end up with a tool that looks impressive but doesn't fit how they actually trade.
1. Real-Time vs. End-of-Day Data
For day traders and momentum traders, latency is everything. A scanner that updates at market close is useless for catching an ORB break at 9:35 AM or a VWAP reclaim at 11:00 AM. Even for swing traders, real-time data matters when you want to confirm a breakout is happening on volume before entering. Check whether a platform's real-time capability requires a paid upgrade, many bury this detail in their pricing pages.
2. Alert Quality and Context
There's a massive difference between an alert that says "AAPL triggered" and one that says "AAPL broke above its opening range high on 3.2x relative volume, this setup has a 67% win rate over the last 18 months." The first tells you something happened. The second tells you what to do about it. Integrating high-quality trading alerts with your charting platform is only possible if the alerts themselves carry enough information to act on.
3. Mobile Access and Push Notifications
Most traders aren't sitting at a six-monitor desktop rig from 9:30 AM to 4:00 PM. They're in meetings, running errands, or working a day job while trading part-time. A scanner that only works on desktop is a scanner you'll miss entries on. Push notifications to your phone, with enough context to decide whether to act, are no longer a luxury feature. They're a baseline requirement for anyone who can't watch charts all day.
4. Backtesting Transparency
Would you trade a setup you've never seen perform historically? Most traders wouldn't, but most scanners give you no choice. They surface patterns without any data on how those patterns have performed. Building winning backtesting strategies starts with knowing which setups have a verifiable edge. Look for platforms that show win rates, average returns, and drawdown data for each screen, not just a generic "this pattern is bullish" label.
5. Ease of Use Without Coding
Pine Script is a real programming language. Most traders aren't programmers. Platforms that require custom code to build alerts or screens effectively exclude a large portion of their target audience. Pre-built screens that cover the most common technical setups, ORB, VWAP, RVOL, breakouts, momentum divergences, let traders focus on trading, not software development.
TradingView: Best for Charting, Not Trade Discovery
TradingView is the gold standard for charting. Its interface is clean, its community is massive, and its library of indicators is unmatched. If you want to analyze a chart you've already identified, TradingView is excellent.
But here's the problem: TradingView is not a proactive scanner. It doesn't surface new setups for you. To get alerts on specific conditions, you need to write Pine Script, a proprietary scripting language that takes real time to learn. Pre-built community scripts exist, but they vary wildly in quality and come with no backtest data to validate them.
What TradingView does well:
- World-class charting with hundreds of built-in indicators
- Multi-timeframe analysis on any chart
- Large community of shared scripts and ideas
- Mobile app with basic alert functionality
Where it falls short in this stock scanner comparison:
- Alerts require Pine Script coding, no pre-built screens for ORB, VWAP, or RVOL
- No backtest data attached to alerts or community scripts
- Designed for analyzing stocks you already know about, not discovering new ones
- Mobile alerts are basic, no plain-English context about why a setup triggered
Best for: Experienced traders who already know which stocks they want to watch and have the coding skills to build custom alerts. Not ideal for trade discovery or mobile-first workflows.
Trade Ideas: Powerful but Priced for Professionals
Trade Ideas is one of the most powerful real-time scanners on the market. Its AI-powered "Holly" system generates pre-market trade ideas, and its scanning engine is genuinely fast. For full-time day traders with the budget and patience to learn the platform, it delivers.
The catch? Trade Ideas starts at $118 per month, is desktop-only, and has an interface that can feel like a Bloomberg terminal from 2009. New users often spend weeks just learning how to configure it before they can trade effectively. There's no meaningful mobile app, which means if you step away from your desk, you're flying blind.
What Trade Ideas does well:
- Genuine real-time scanning with fast data feeds
- AI-generated pre-market trade ideas via Holly
- Deep customization for experienced users
- Broad coverage of intraday setups
Where it falls short in this stock scanner comparison:
- Starts at $118/month, one of the most expensive options in this category
- Desktop-only with no mobile push alerts
- Steep learning curve; overwhelming for beginners
- Complex interface requires significant setup time before it's usable
Best for: Full-time day traders with a dedicated desktop setup, a meaningful trading budget, and the time to invest in learning the platform. Not suitable for part-time traders or beginners.
Finviz: Great Starting Point, Limited for Active Traders
Finviz is where most traders start, and for good reason. Its free tier is genuinely useful for learning how to filter stocks by fundamental and technical criteria. The interface is intuitive, the heat maps are visually satisfying, and the screener covers a wide range of conditions.
But Finviz has a ceiling, and active traders hit it quickly. The free version updates end-of-day. Even the Elite tier ($39.99/month) has data delays that make it unsuitable for intraday momentum trading. There's no mobile app, no push alerts, and no backtest data. If you're refreshing Finviz manually during market hours hoping to catch a momentum play, you're already behind.
What Finviz does well:
- Free tier with solid fundamental and technical filters
- Intuitive interface, easy to learn for beginners
- Good for end-of-day swing trade research
- Heat maps and visual market overview tools
Where it falls short in this stock scanner comparison:
- End-of-day data even on paid tiers, not suitable for intraday trading
- No mobile app or push notifications
- No backtest data or historical performance context for any screen
- Manual refresh required, not a proactive alert system
Best for: Beginners learning to filter stocks and swing traders doing end-of-day research. Not suitable for day traders or anyone who needs real-time intraday alerts. For a deeper look at how to use screeners effectively for day trading, see our guide on using stock screeners for day trading in 2026.
TrendSpider: Deep Analysis for Stocks You Already Know
TrendSpider occupies an interesting niche. Its automated trendline detection, multi-timeframe analysis, and backtesting tools are genuinely impressive. If you want to analyze a specific chart in depth, drawing trendlines automatically, checking how a setup has performed historically on that ticker, TrendSpider does it well.
The problem is that TrendSpider is an analysis tool, not a discovery tool. It doesn't scan the entire market to surface new setups. You bring the stocks; it helps you analyze them. For traders who need to find opportunities across thousands of tickers in real time, that's a fundamental limitation. Add in the lack of mobile push alerts and a web-only interface, and TrendSpider becomes a complement to a scanner rather than a replacement for one.
What TrendSpider does well:
- Automated trendline and pattern detection on individual charts
- Multi-timeframe analysis in a single view
- Backtesting on specific tickers and strategies
- Clean, modern interface
Where it falls short in this stock scanner comparison:
- Not a market-wide scanner, won't surface new setups across thousands of stocks
- No mobile app with push notifications
- Web-only platform limits on-the-go usability
- Best used alongside a proactive scanner, not as a standalone discovery tool
Best for: Traders who already have a watchlist and want deep chart analysis on specific tickers. Pair it with a proactive scanner for a complete workflow.
Tickeron: AI Scoring Without the Transparency
Tickeron uses AI-driven pattern recognition to identify technical setups across a broad universe of stocks. The concept is sound, automated pattern detection at scale, but the execution has a transparency problem. Tickeron's AI scoring is largely a black box. You get a signal, but you don't get to see the filters, the methodology, or the historical performance data behind it.
For traders who want to understand their edge, not just follow signals, that's a significant issue. Trusting a setup you can't audit is a difficult ask, especially for beginners who are still building their pattern recognition skills. Tickeron is also web-only, with no mobile push notifications, which limits its usefulness for traders who aren't at their desk during market hours.
What Tickeron does well:
- Broad AI-driven pattern recognition across many tickers
- Covers a wide range of technical patterns
- Relatively accessible interface
Where it falls short in this stock scanner comparison:
- Black-box AI scoring, no visible filters or backtest methodology
- Web-only platform with no mobile push alerts
- Hard to verify or audit the signals you receive
- Limited transparency for traders who want to understand their edge
Best for: Traders comfortable acting on AI-generated signals without needing to understand the underlying methodology. Not ideal for traders who want full transparency into why a setup triggered.
ChartMath: The Mobile-First Stock Scanner Built for Trade Discovery
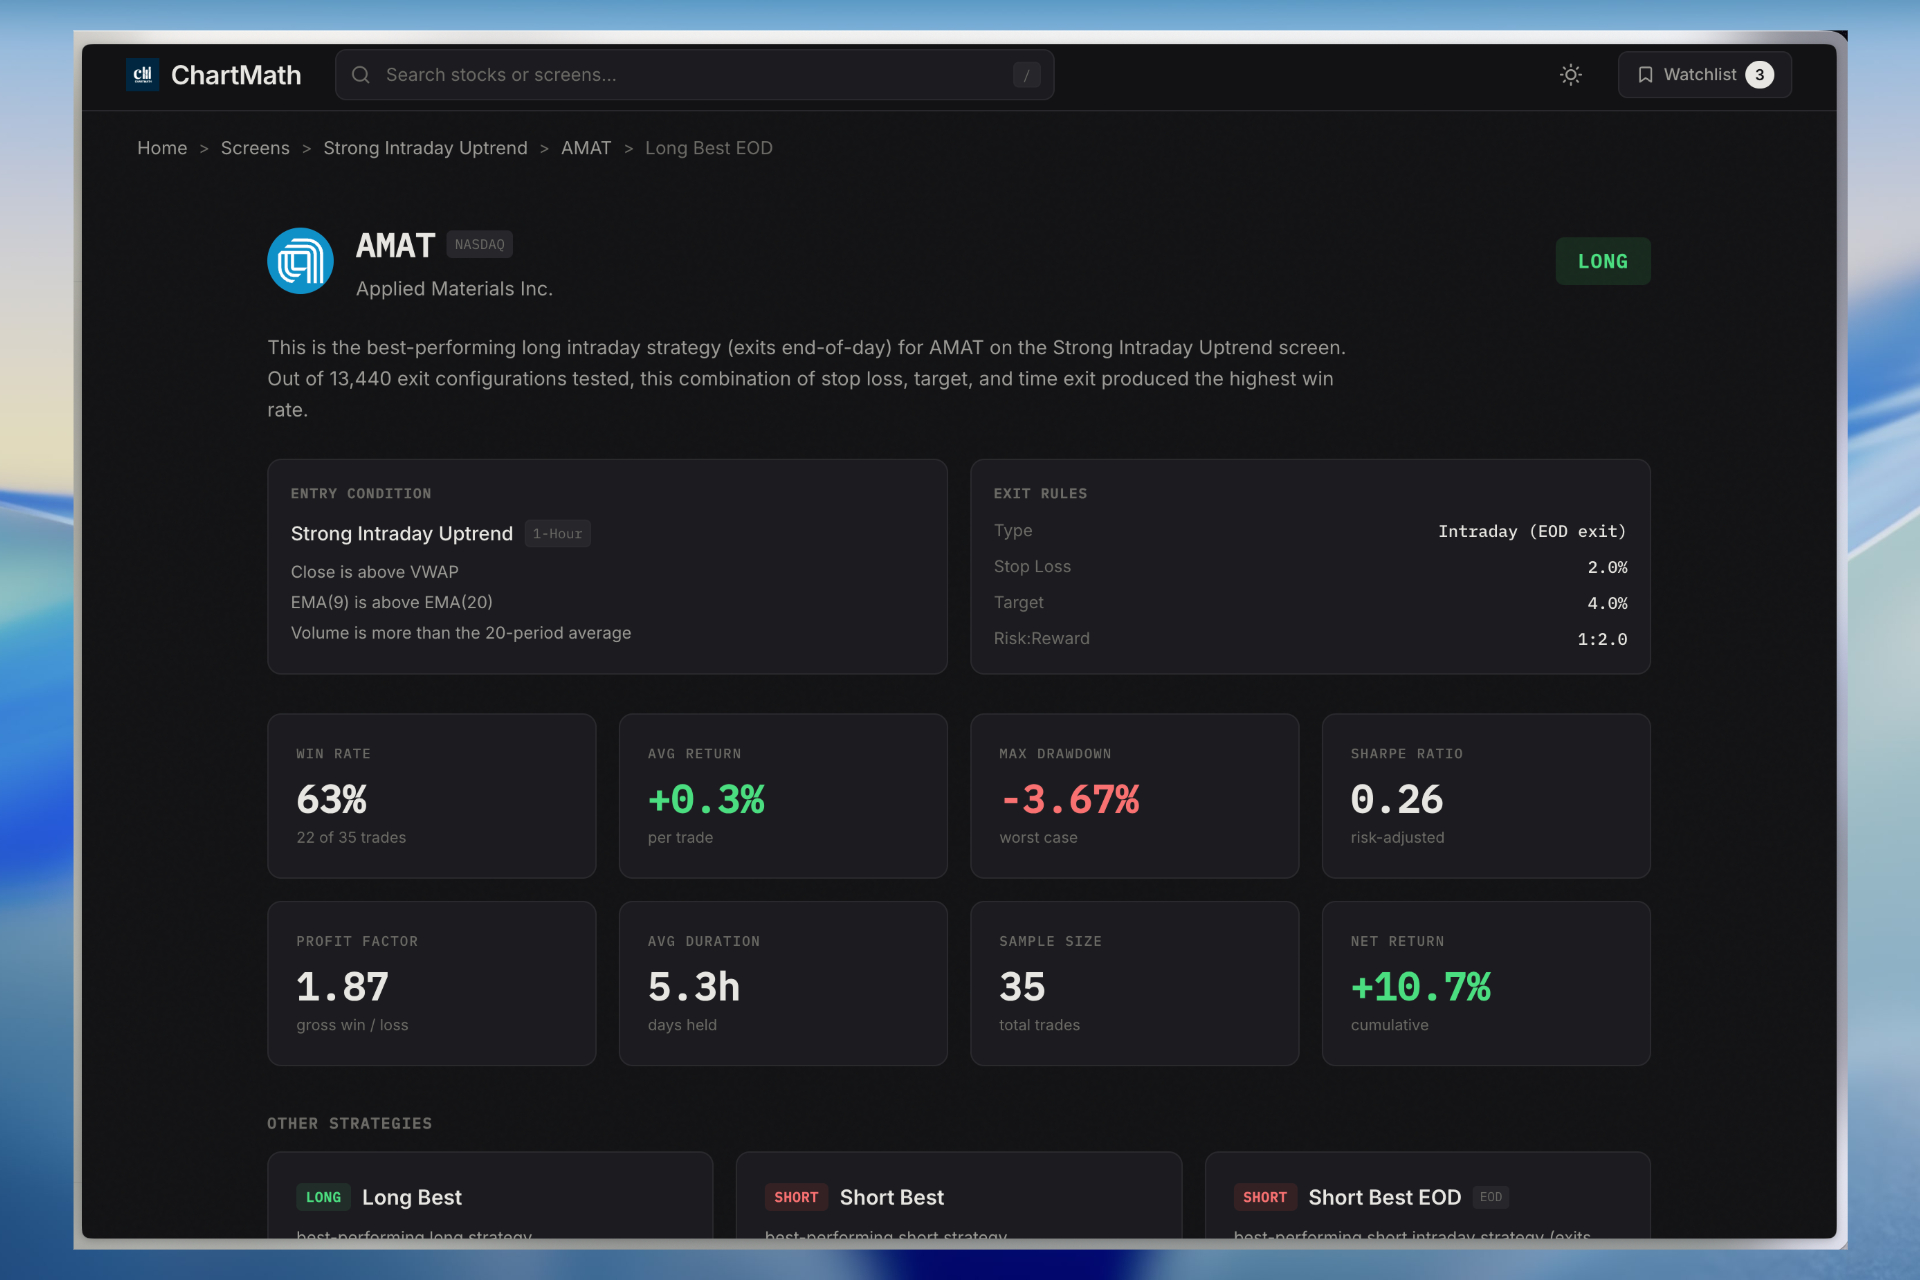
ChartMath was built to solve the specific problems that every other platform in this stock scanner comparison leaves unaddressed: proactive trade discovery, mobile-first push alerts with real context, and backtest data for every single screen, all without requiring a line of code.
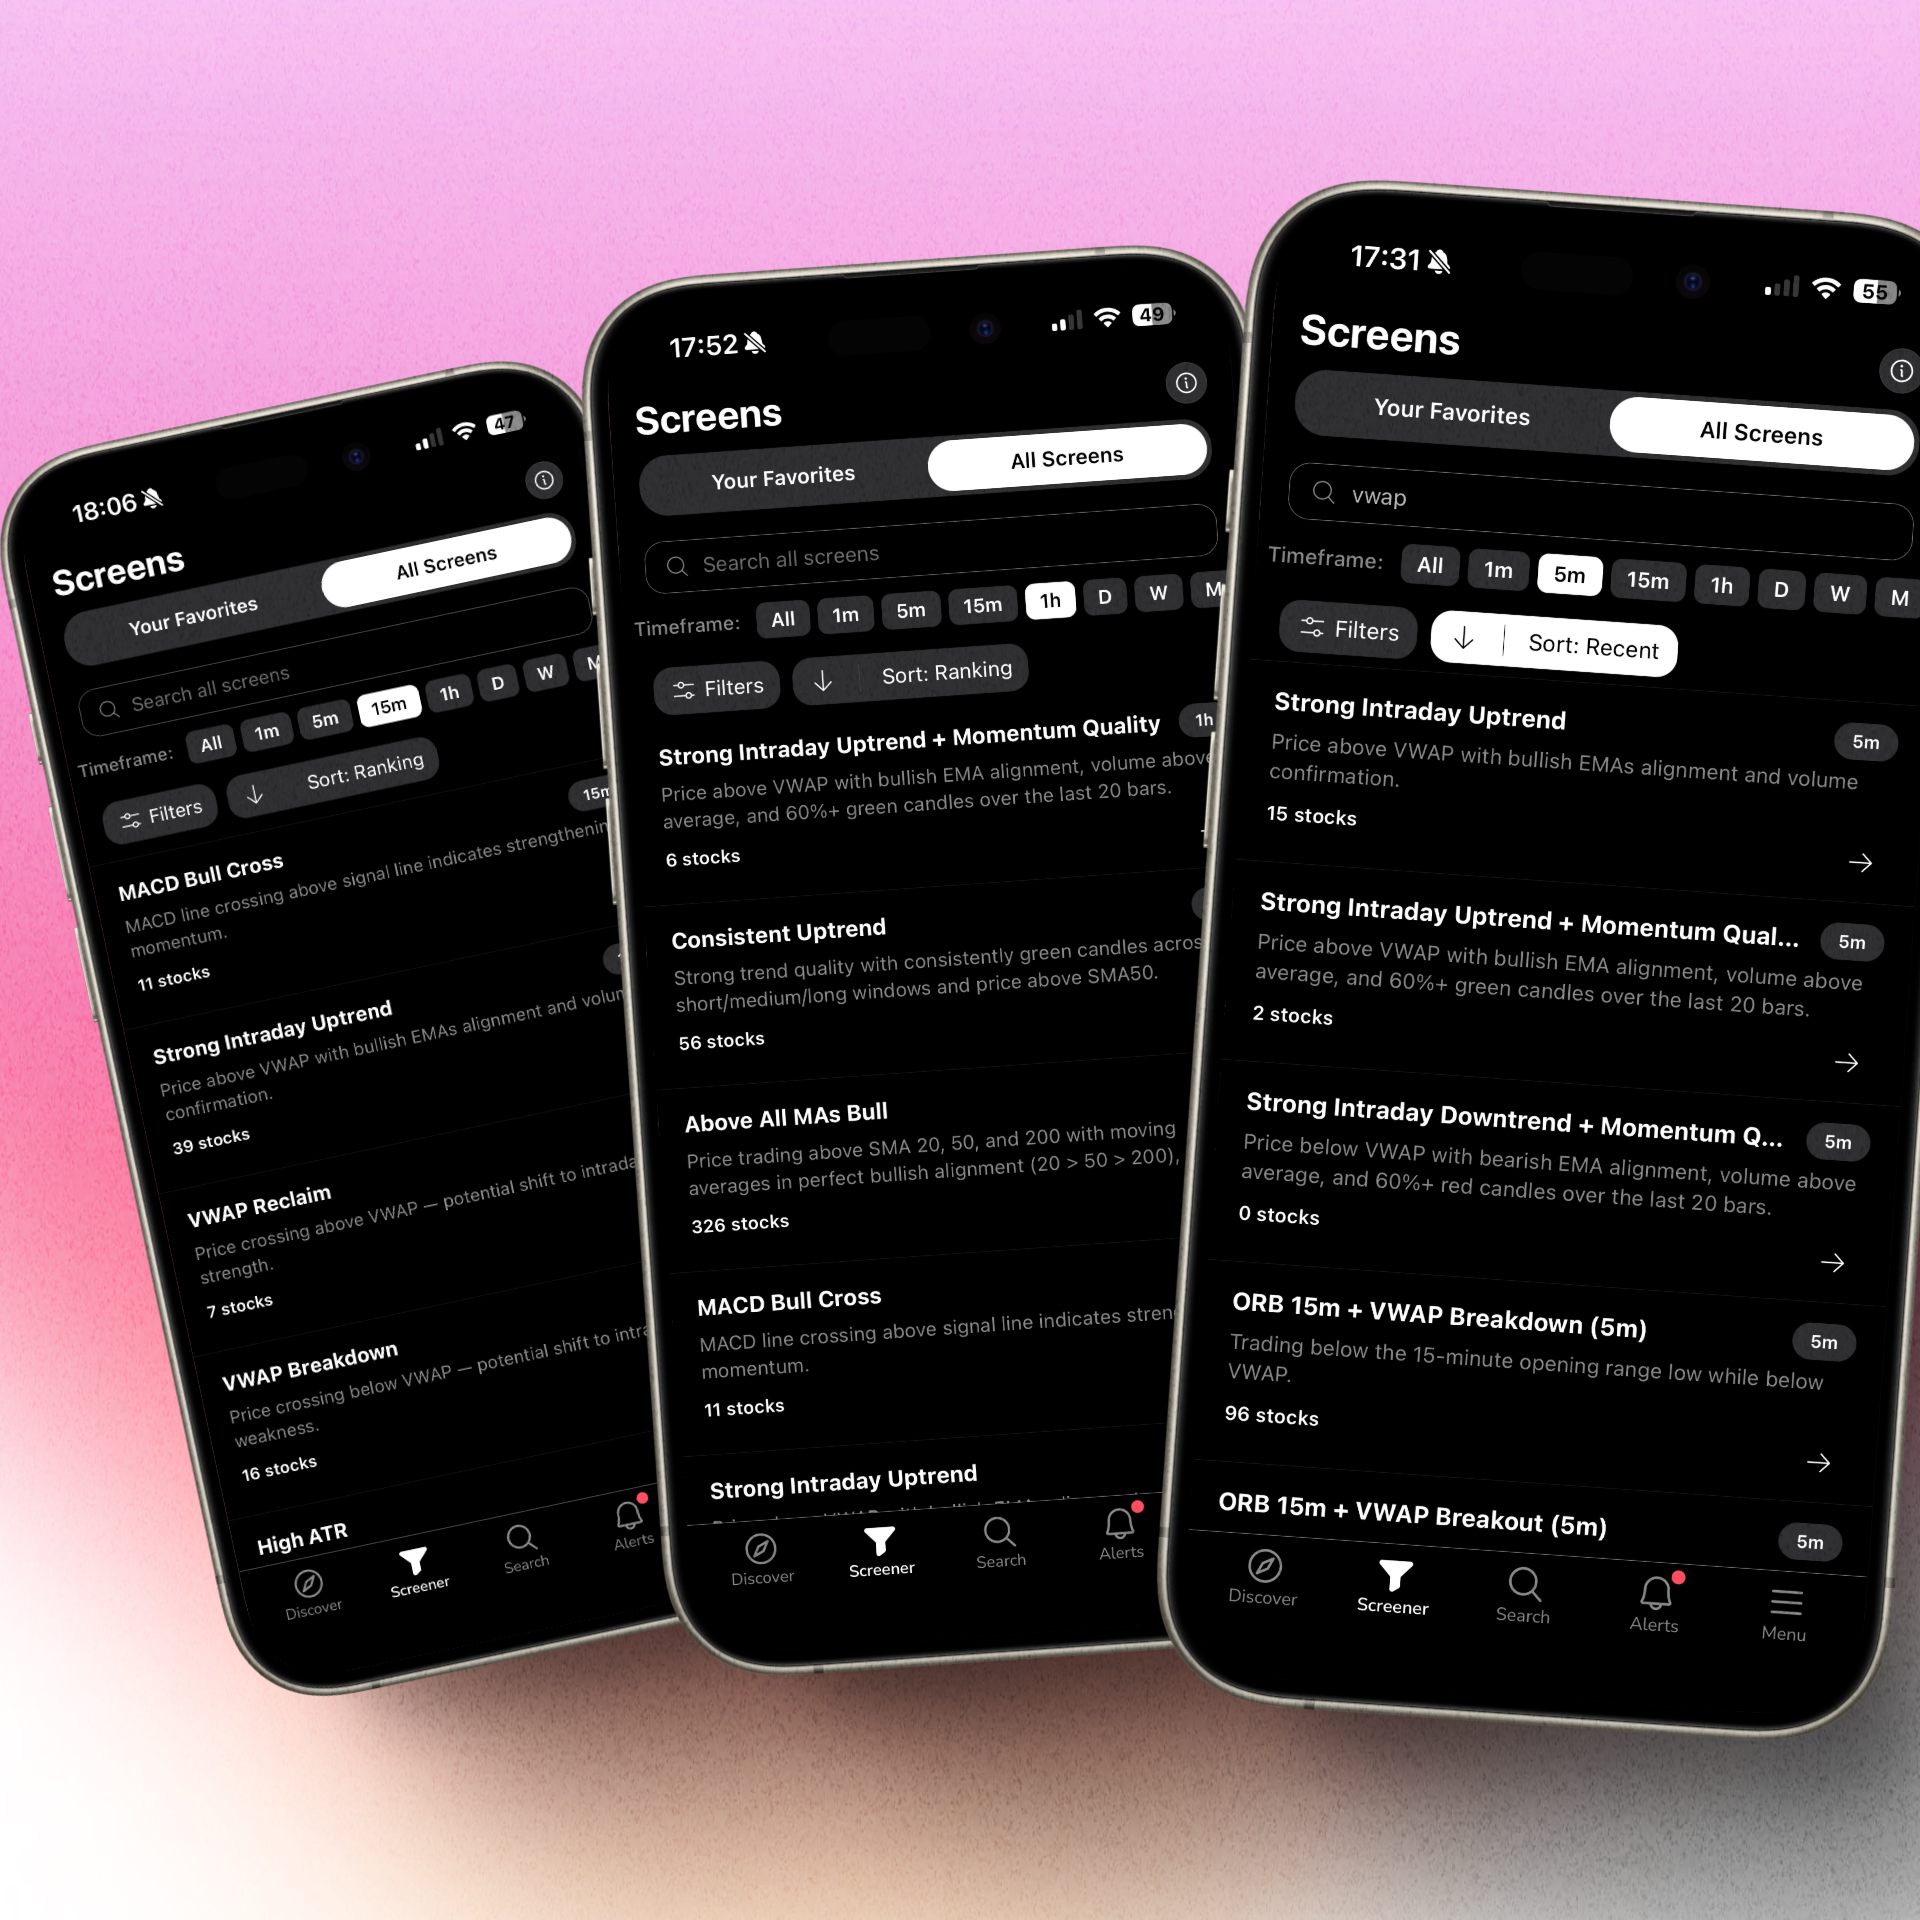
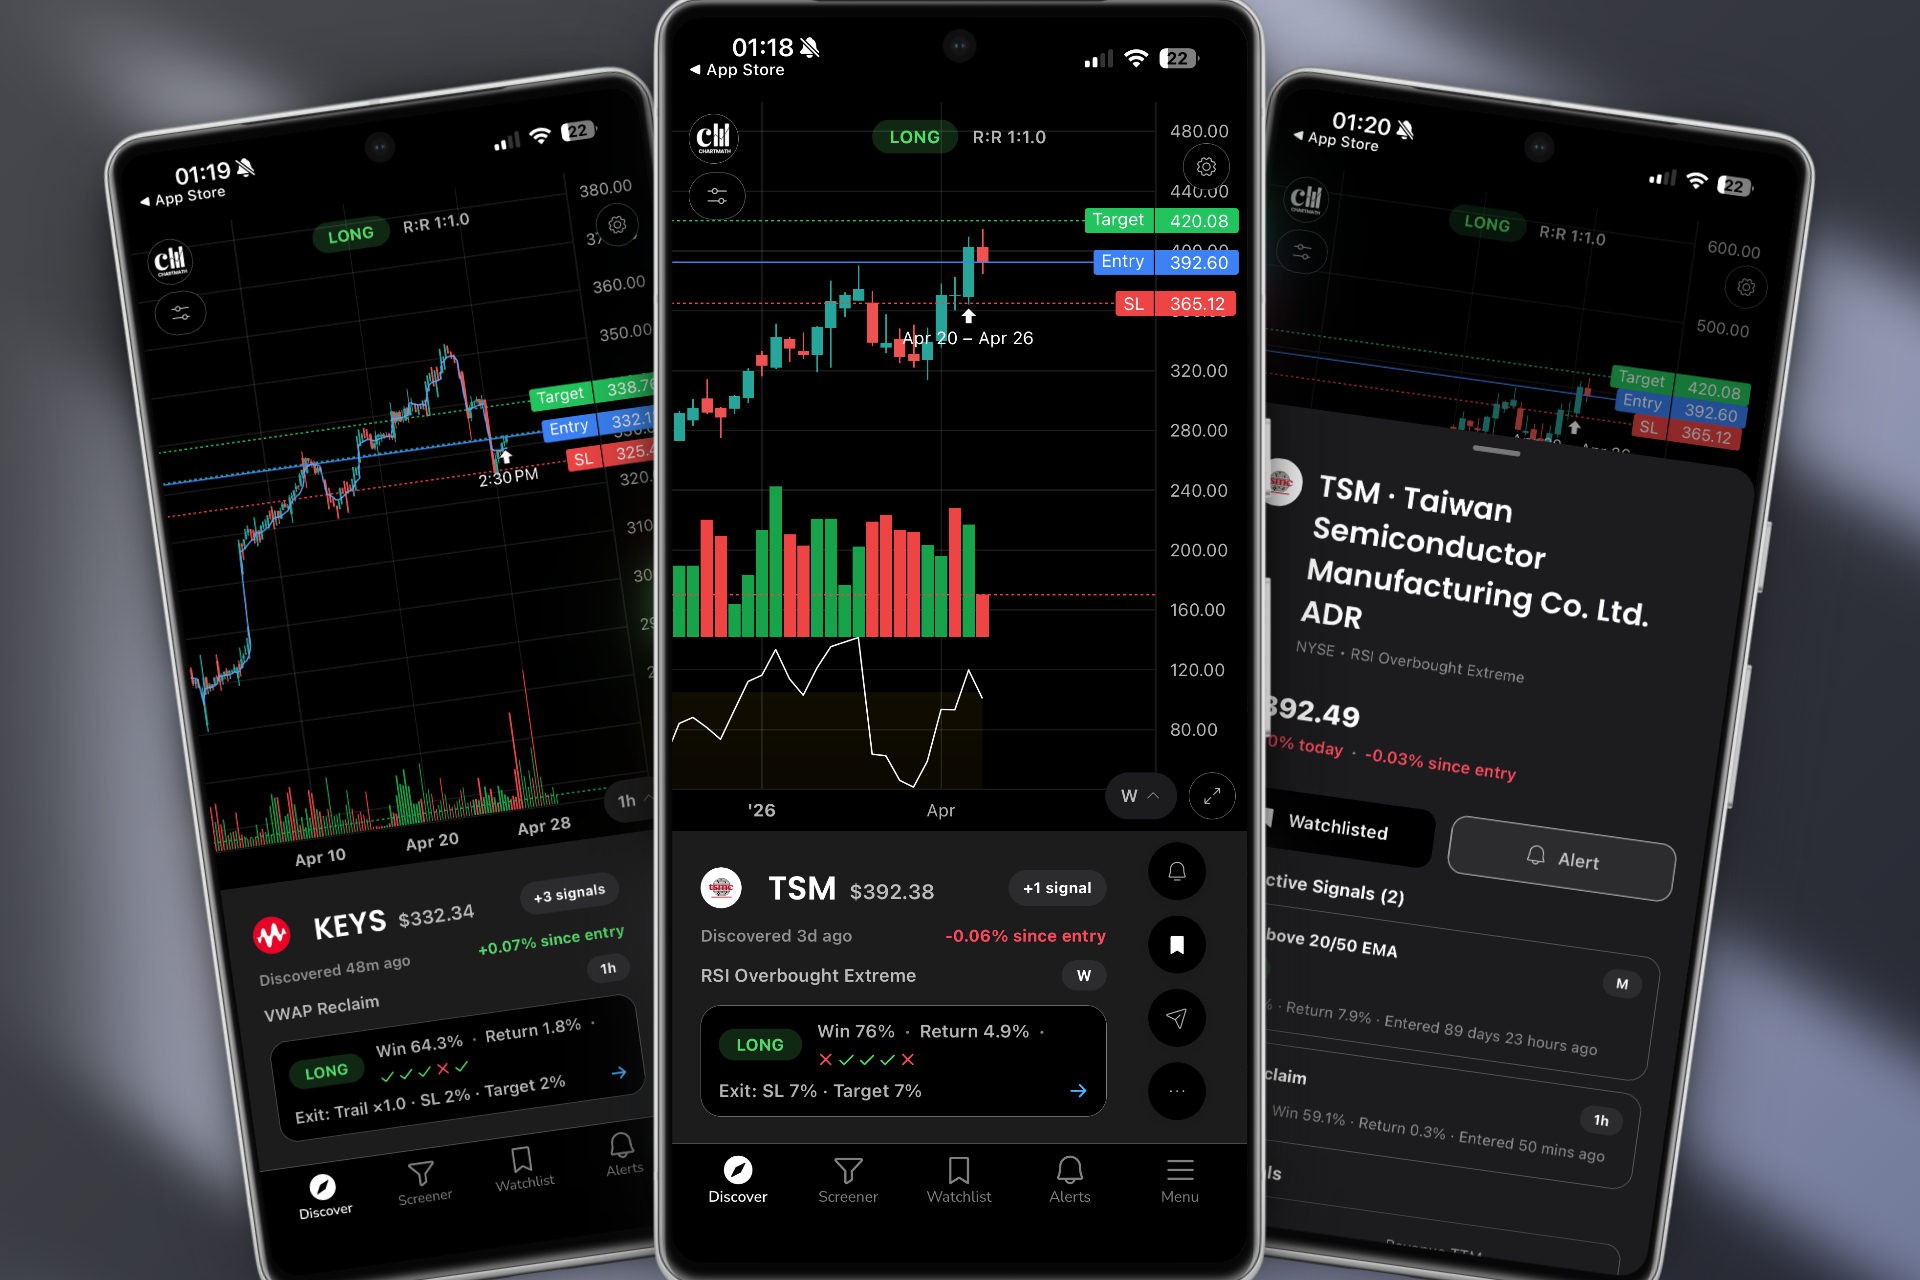
The platform continuously scans the market across 200+ pre-built technical screens covering ORB breaks, VWAP reclaims, RVOL spikes, momentum divergences, breakouts to 52-week highs, and dozens of other setups across multiple timeframes (1m, 5m, 15m, 1h, daily, weekly). When a stock matches a setup, ChartMath sends a push alert to your phone, not just a ticker, but a plain-English explanation of exactly why the setup triggered and what the historical edge looks like.
Every screen in ChartMath comes with backtest data: win rates, average returns, and drawdown statistics calculated from historical market data. Before you take a trade, you can see how that exact setup has performed over time. That's a level of transparency that no other platform in this comparison offers at scale.
What ChartMath does well:
- 200+ pre-built, backtested screens covering every major technical setup, no coding required
- Real-time push alerts with plain-English explanations of why a setup triggered
- Backtest data for every screen, win rates, average returns, and drawdowns visible before you trade
- Mobile-first swipe interface, discover and evaluate setups on your phone like scrolling a feed
- Three discovery modes: Discover (ranked feed of top setups), Screener (filter by strategy), Watchlist (track your favorites)
- Multi-timeframe coverage for both day traders (1m, 15m) and swing traders (daily/weekly)
- $1 first month, then $24.99/month or $149.99/year
Where ChartMath fits best in this stock scanner comparison:
- Day traders who need real-time ORB, VWAP, and RVOL alerts on their phone while away from their desk
- Swing traders who want end-of-day breakout signals delivered before market close
- Beginners who need pre-built screens, plain-English context, and backtest data to build confidence
- Any trader who wants proactive trade discovery, not just chart analysis on stocks they already know
ChartMath is designed as a companion to your existing charting platform, not a replacement for it. You discover the setup in ChartMath, then execute your analysis and trade in TradingView, Thinkorswim, or wherever you chart. For more on how to build that kind of integrated workflow, see our guide on building an efficient trading workflow in 2026.
Ready to see it in action? Watch the ChartMath demo to see how real-time trade discovery works across 200+ technical setups.
Stock Scanner Comparison: Side-by-Side Feature Breakdown
Here's how each platform stacks up across the five criteria that matter most. Use this as a quick reference when making your decision.
| Platform | Real-Time Data | Mobile Push Alerts | Pre-Built Screens | Backtest Data | No-Code Setup |
|---|---|---|---|---|---|
| ChartMath | ✓ | ✓ | ✓ (200+) | ✓ (every screen) | ✓ |
| TradingView | ✓ | Limited | ✗ (code required) | ✗ | ✗ |
| Trade Ideas | ✓ | ✗ | Limited | Partial | Partial |
| Finviz | ✗ (EOD) | ✗ | Basic | ✗ | ✓ |
| TrendSpider | ✓ | ✗ | ✗ (analysis only) | Per-ticker only | ✓ |
| Tickeron | Partial | ✗ | AI-generated | ✗ (black box) | ✓ |
No platform is perfect for every trader. But when you look at the full picture, real-time data, mobile push alerts, pre-built screens, backtest transparency, and no-code accessibility, ChartMath covers the most ground for active technical traders who need proactive trade discovery across all market conditions.
For traders focused specifically on premarket opportunities, our guide on premarket trading strategies for high-probability setups covers how to use scanners effectively before the open.
Which Scanner Fits Your Trading Style?
The best stock scanner isn't the one with the most features. It's the one that fits how you actually trade. Here's a quick breakdown by trading style.
Day Traders: You Need Real-Time, Mobile, and Intraday Setups
If you're trading ORB breaks, VWAP reclaims, and RVOL spikes on 1-minute to 15-minute charts, you need a scanner that's as fast as the market. You also need alerts on your phone, because you can't watch every ticker simultaneously. In this stock scanner comparison, ChartMath and Trade Ideas are the only platforms with genuine real-time intraday scanning. ChartMath adds mobile push alerts and backtest context that Trade Ideas lacks, at a fraction of the price. For a deeper look at intraday execution, see our guide on executing 1-minute to 15-minute intraday plays.
Swing Traders: You Need End-of-Day Signals and a 30-Minute Workflow
Swing traders don't need to watch charts all day, but they do need reliable signals delivered before or after market close so they can review setups on their own schedule. Finviz works for basic end-of-day filtering, but it offers no alerts and no backtest data. ChartMath delivers daily and weekly breakout signals with push notifications and historical performance data, making it a strong fit for the 30-minute daily swing trading workflow that busy professionals rely on.
Beginners: You Need Pre-Built Screens, Plain-English Context, and Backtest Data
If you're new to technical trading, the last thing you need is to spend your first month learning Pine Script or decoding a complex interface. You need pre-built screens that cover proven setups, plain-English explanations of why each alert triggered, and backtest data to build confidence in the patterns you're learning. ChartMath's 200+ pre-built screens and plain-English alert descriptions make it the most beginner-accessible option in this stock scanner comparison, without sacrificing the depth that more experienced traders need.
Power Users and Coders: TradingView or TrendSpider as Complements
If you have Pine Script skills and want maximum customization in your charting environment, TradingView remains the best charting platform available. TrendSpider adds automated technical analysis on top of that. But neither replaces a proactive scanner, they're analysis tools for stocks you've already identified. The most effective setups use ChartMath for discovery, then TradingView or TrendSpider for deeper analysis before entry. For more on building that kind of integrated setup, see our guide on building an efficient trading workflow in 2026.
Frequently Asked Questions About Stock Scanner Comparison
What is the best free stock scanner?
Finviz offers the most capable free tier for basic filtering, but it's end-of-day only. ChartMath also lets you browse screens free on the web with access to real-time scanning and push alerts, making it the stronger free option for active traders who need intraday capability without a subscription commitment.
Do I need a real-time scanner for swing trading?
Not necessarily for every swing trade, but real-time data helps when you want to confirm a breakout is happening on volume before entering. End-of-day scanners like Finviz work for identifying candidates, but you'll want real-time confirmation before pulling the trigger on a position. ChartMath covers both, daily/weekly screens for swing setup discovery and real-time alerts for entry confirmation.
Can I use multiple scanners together?
Yes, and many experienced traders do. A common setup is using ChartMath for proactive trade discovery and push alerts, then switching to TradingView for detailed chart analysis before entering a trade. The two tools complement each other well because they solve different problems: ChartMath finds the setup, TradingView helps you analyze it.
What makes ChartMath different from TradingView alerts?
TradingView alerts require you to write Pine Script code for each condition you want to monitor. They fire when a condition is met, but they don't tell you why it matters or how that setup has performed historically. ChartMath's alerts are pre-built, require no coding, include plain-English explanations of why the setup triggered, and come with backtest data showing historical win rates and returns. It's the difference between a notification and an actionable insight.
Is backtesting data important in a stock scanner?
Absolutely. Trading a setup without knowing its historical performance is essentially trading blind. Backtest data tells you the win rate, average return, and typical drawdown for a given pattern, so you can size positions appropriately and set realistic expectations. Most scanners in this stock scanner comparison don't provide this data at all. ChartMath attaches backtest statistics to every one of its 200+ screens, giving traders a transparent view of their edge before they risk capital. For a deeper dive, see our complete guide on building winning backtesting strategies.
Which scanner is best for momentum trading?
Momentum trading requires real-time RVOL spikes, breakout detection, and fast alerts, all delivered to wherever you are. In this stock scanner comparison, ChartMath is purpose-built for momentum trading, with dedicated screens for RVOL, ORB, VWAP reclaims, and breakout setups across multiple timeframes. For a breakdown of the key indicators involved, see our guide on VWAP vs RVOL vs ORB: which technical indicators work best.
The bottom line: The right scanner isn't the most expensive one or the one with the most features. It's the one that surfaces the right setups, at the right time, in a format you can actually act on, wherever you are.
Make Your Stock Scanner Comparison Count
Every platform in this stock scanner comparison has a legitimate use case. TradingView is the best charting tool available. Trade Ideas is powerful for full-time desktop traders. Finviz is a solid starting point for beginners. TrendSpider excels at deep chart analysis. But when it comes to proactive trade discovery, surfacing new setups across the entire market in real time, delivering context-rich push alerts to your phone, and backing every screen with transparent historical data, ChartMath is the only platform in this comparison built specifically for that job.
If you're tired of manually refreshing screeners, drowning in low-quality alerts, or missing entries because you stepped away from your desk, it's time to try a scanner that works the way you actually trade. Download the ChartMath app and start discovering high-quality setups across 200+ pre-built technical screens, no coding, no alert spam, no missed entries. Or explore the web-based screener to filter setups by strategy and timeframe right now.
Your next high-probability trade is already setting up. The only question is whether your scanner will find it for you.

Ankush Jindal
LinkedInSee these setups live in ChartMath
200+ curated screens with backtest data. First month $1.